Download presentation
Presentation is loading. Please wait.

1
Statistical separation of natural and anthropogenic signals in observed surface air temperature time series T. Staeger, J. Grieser and C.-D. Schönwiese Meteorological Environmental Research / Climatology Institute for Meteorology and Geophysics J.W. Goethe-University, Frankfurt /M., Germany

2
Global mean temperature 1856 – 2003 after P.D. Jones et al. Which parts of the variations in observed temperature are assignable to natural and anthropogenic forcings? Are anthropogenic signals distuingishable from noise?

3
Approach: Causes for the structures in the time series under consideration are being postulated. A pool of potential regressor time series is collected out of the forcings / processes considered. A selection routine is applied to obtain a multiple linear regression model. Stepwise Regression The effects are seen to be linear and additive.

4
Forcings / processes considered: - Greenhouse gases(GHG) - El Niño - Southern Oscillation(SOI) - Explosive volcanism(VUL) - Solar forcings(SOL) - North atlantic oscillation(NAO) - Tropospheric sulphate aerosol(SUL)
 - El Niño - Southern Oscillation(SOI) - Explosive volcanism(VUL) - Solar forcings(SOL) - North atlantic oscillation(NAO) - Tropospheric sulphate aerosol(SUL)")
5
GHG forcing: logarithmic CO 2 equivalent concentration

6
EOF-transformierte Säulendichten Sulfate forcing: The first 3 PCs of 8 zonal means of emission rates:

7
Variations of the Solar constant 1500 - 2001 after Lean:

8
Explosive volcanism: first three PCs out of 16 zonal means of volcanic radiative forcing after Grieser:

9
Southern-Oscillation-Index annual mean 1876 – 2001 (CRU)
")
10
NAO index 1850 - 2001 after P.D. Jones:

11
reservoir R pot forward selection: MLR with R i and R pot for each single R pot is the most significant reg. coeff. above threshold? backward elimination: MLR with all R i except R j for each single R j is the less significant reg. coeff. above threshold? end - model: no model: yes R d back to reservoir Stepwise Regression: deselection of R d no

12
Signal separation:

13
Significance test of the regression coefficients: t-test: :degrees of freedom r i.,part :partial correlation coefficient of R i j: lenght of time series n:number of regressors

14
global mean temperature 1878 – 2000, annual mean after P.D. Jones

15
GHG global mean temperature 1878 – 2000, annual mean after P.D. Jones

16
GHG + SOL global mean temperature 1878 – 2000, annual mean after P.D. Jones

17
GHG + SOL + SOI global mean temperature 1878 – 2000, annual mean after P.D. Jones

18
GHG + SOL + SOI + VUL explained variance: 78.9% global mean temperature 1878 – 2000, annual mean after P.D. Jones

19
explained variance of the complete model and and for single forcings on the global mean temperatur 1878 - 2000

20
Significance of signals: A signal has to be distuingished sufficiently from noise: Given a Gaussian distributed noise term, the significance of a signal to noise ratio can be computed.

21
significance of the greenhouse signal: For Gaussian distributed residuals: A signal has to be distuingished sufficiently from noise:

22
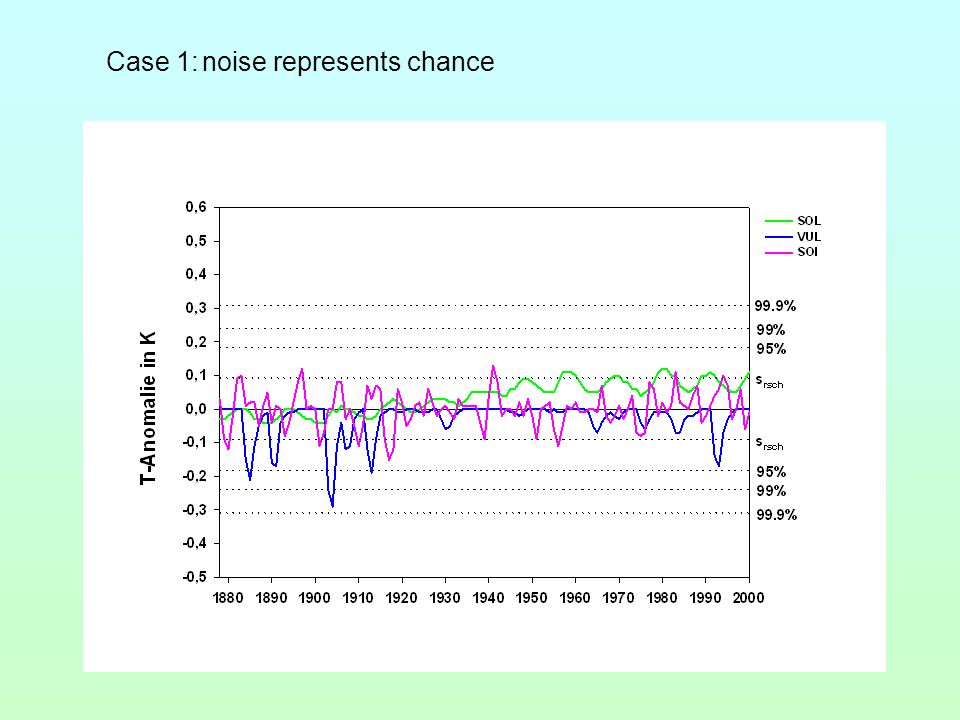
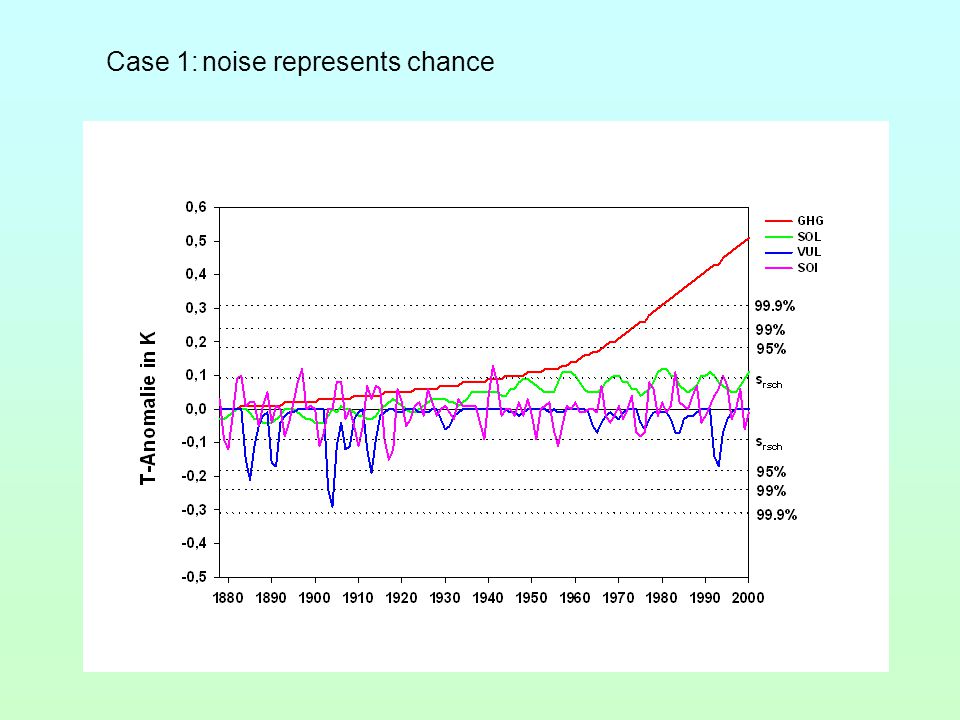
What is noise? Case 1:noise represents chance: To obtain the component representing chance, the residual is separated into a structured and unstructered component. The question to be answered here: Is the greenhouse signal distuingishable from chance?

23
What is noise? Case 2:noise comprises of natural variability and unexplained variance The question to be ansewered here: Is the greenhouse signal distuingishable from variability of non- anthropogenic origin?

24
Case 1:noise represents chance

29
Case 2:noise = natural variability + unexplained

30
Existing area means, temperature annual means 1901 - 2000 Data fields: Spatial distinction leads to area means which are not independent, because they all describe a part of the same field of meteorological data.

31
Transformation of the data field into principal components, which contain structures of the whole field: EOF-Transformation EOF:spacial components PC:time dependent components :Eigen value Empirical Orthogonal Functions:

32
data field EOF-Transformation PC Stepwise Regression backtransformation signal fields, residual field Treatment of data fields:

33
Eigen spectrum:

34
First PC and EOF of the global temperature field 1878 – 2000: 1. PC; e.V.: 40.7%Variance spectrum of the 1. PC 1. EOF

35
GHG signal field for the year 2000 relative to 1901 in [K]:
![GHG signal field for the year 2000 relative to 1901 in [K]:](http://images.slideplayer.com/14/4337306/slides/slide_35.jpg "GHG signal field for the year 2000 relative to 1901 in [K]:")
36
GHG signal field, seasonal means for 2000 relative to 1901 in [K]: NH winterNH spring NH summerNH autum
![GHG signal field, seasonal means for 2000 relative to 1901 in [K]: NH winterNH spring NH summerNH autum](http://images.slideplayer.com/14/4337306/slides/slide_36.jpg "GHG signal field, seasonal means for 2000 relative to 1901 in [K]: NH winterNH spring NH summerNH autum")
37
Solar signal field for 2000 relative to 1906 (first sunspot maximum analyzed) in [K]:
![Solar signal field for 2000 relative to 1906 (first sunspot maximum analyzed) in [K]:](http://images.slideplayer.com/14/4337306/slides/slide_37.jpg "Solar signal field for 2000 relative to 1906 (first sunspot maximum analyzed) in [K]:")
38
NAO signal field winter 1993 relative to mean values 1901-2000 in [K]:
![NAO signal field winter 1993 relative to mean values in [K]:](http://images.slideplayer.com/14/4337306/slides/slide_38.jpg "NAO signal field winter 1993 relative to mean values in [K]:")
39
Sulfate signal in the global temperature field 1901 - 2000: For 1970 relative to 1901 For 2000 relative to 1901

40
Explained variance of the full model and of single forcings for the global temperature data field 1878 - 2000

41
Significance of the GHG signal for 2000 relative to 1901 in percentages: Case 1:noise represents chance Case 2:noise = natural variability + unexplained

42
Significance of the GHG signal for 2000 relative to 1878 in percentages: Case 1:noise represents chance Case 2:noise = natural variability + unexplained

43
1. PC; e.V.: 53,1%Varianzspektrum der 1. PC 1. EOF First PC and EOF of the european temperature field 1878 – 2000:

44
GHG signal field Europe for 2000 relative to 1878 in [K]:
![GHG signal field Europe for 2000 relative to 1878 in [K]:](http://images.slideplayer.com/14/4337306/slides/slide_44.jpg "GHG signal field Europe for 2000 relative to 1878 in [K]:")
45
Significance of the european GHG signal for 2000 relative to 1878 in percentages: Case 1:noise represents chance Case 2:noise = natural variability + unexplained

46
Explained variance of the full model and of single forcings for the european temperature data field 1878 - 2000

47
NAO in the european temperature field: NAO signal field in winter 1925 relative to mean values 1901-2000 in [K] Significance of the NAO signal in Winter 1925 in pecentages Case 2:complete residual and natural variability as noise (without NAO)
![NAO in the european temperature field: NAO signal field in winter 1925 relative to mean values in [K] Significance of the NAO signal in Winter 1925 in pecentages Case 2:complete residual and natural variability as noise (without NAO)](http://images.slideplayer.com/14/4337306/slides/slide_47.jpg "NAO in the european temperature field: NAO signal field in winter 1925 relative to mean values in [K] Significance of the NAO signal in Winter 1925 in pecentages Case 2:complete residual and natural variability as noise (without NAO)")
48
Signficance of the GHG signal in the german mean temperature 1878 - 2000: Case 1:noise represents chance

49
Signficance of the GHG signal in the german mean temperature 1878 - 2000: Case 1: noise = natural variability + unexplained

50
Explained variance of the full model and of single forcings for the german mean temperature 1878 - 2000

51
SLP Europe 1896 – 1995: GHG signal field annual mean 1995 relative to 1896 in [hPa] Significance of the GHG signal annual mean 1995 in percentages Case 1:unstructured residual component as noise
![SLP Europe 1896 – 1995: GHG signal field annual mean 1995 relative to 1896 in [hPa] Significance of the GHG signal annual mean 1995 in percentages Case 1:unstructured residual component as noise](http://images.slideplayer.com/14/4337306/slides/slide_51.jpg "SLP Europe 1896 – 1995: GHG signal field annual mean 1995 relative to 1896 in [hPa] Significance of the GHG signal annual mean 1995 in percentages Case 1:unstructured residual component as noise")
52
NAO in the european SLP field: NAO signal field winter 1989 relative to mean values 1896-1995 in [hPa] Significance of the GHG signal annual mean 1995 in percentages Case 1:unstructured residual component as noise
![NAO in the european SLP field: NAO signal field winter 1989 relative to mean values in [hPa] Significance of the GHG signal annual mean 1995 in percentages Case 1:unstructured residual component as noise](http://images.slideplayer.com/14/4337306/slides/slide_52.jpg "NAO in the european SLP field: NAO signal field winter 1989 relative to mean values in [hPa] Significance of the GHG signal annual mean 1995 in percentages Case 1:unstructured residual component as noise")
53
Explained variance of the full model and of single forcings for the european SLP field 1896 - 1995

54
Precipitation Europe 1900 – 1998: GHG signal field annual totals 1998 relative to 1900 in [mm] Significance of the GHG signal annual totals 1998 Case 1:unstructured residual component as noise
![Precipitation Europe 1900 – 1998: GHG signal field annual totals 1998 relative to 1900 in [mm] Significance of the GHG signal annual totals 1998 Case 1:unstructured residual component as noise](http://images.slideplayer.com/14/4337306/slides/slide_54.jpg "Precipitation Europe 1900 – 1998: GHG signal field annual totals 1998 relative to 1900 in [mm] Significance of the GHG signal annual totals 1998 Case 1:unstructured residual component as noise")
55
NAO in the european precipitation field: NAO signal field winter 1989 relative to mean values 1900-1998 in [mm] Significance of the NAO signal winter 1989 Case 1:unstructured residual component as noise
![NAO in the european precipitation field: NAO signal field winter 1989 relative to mean values in [mm] Significance of the NAO signal winter 1989 Case 1:unstructured residual component as noise](http://images.slideplayer.com/14/4337306/slides/slide_55.jpg "NAO in the european precipitation field: NAO signal field winter 1989 relative to mean values in [mm] Significance of the NAO signal winter 1989 Case 1:unstructured residual component as noise")
56
Explained variance of the full model and of single forcings for the european precipitation field 1900 - 1998

57
Comparism of explained variances for the full models and for single forcings for different temperature data sets 1878 - 2000:

58
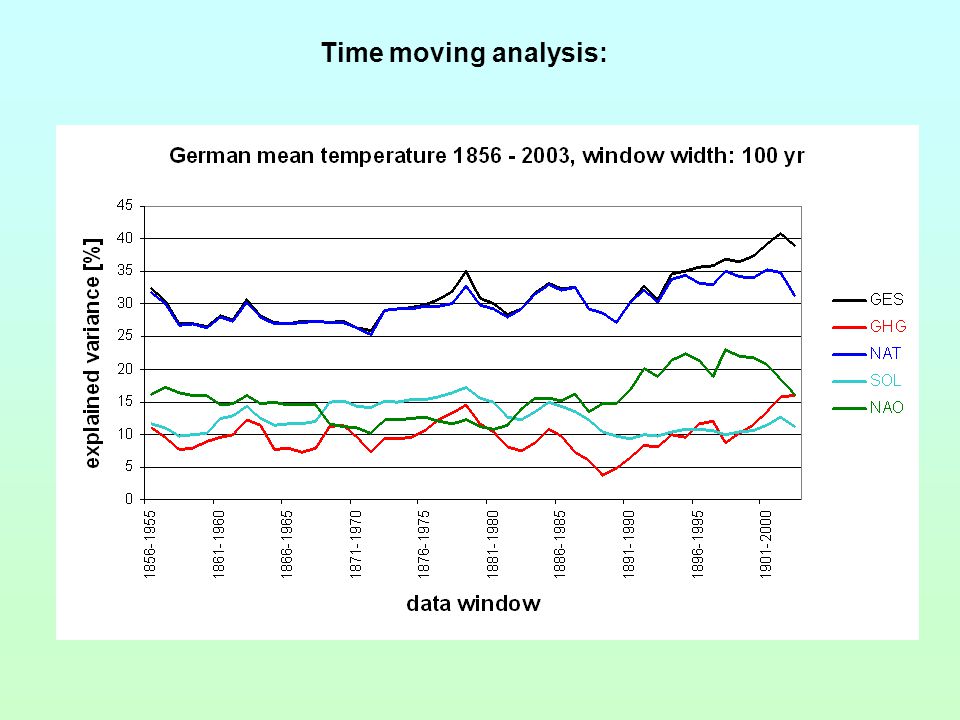
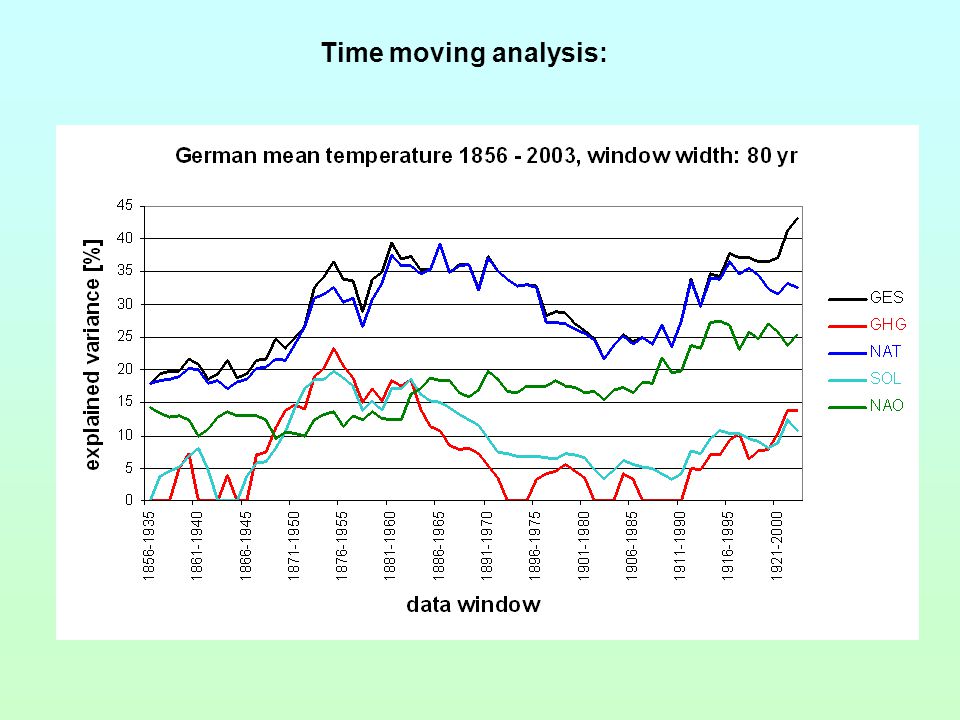
Time moving analysis:

62
Conclusions: Explained variance is highest in global and hemispheric mean temperatures (ca. 70% - 80%) and is reduced in data sets with high spacial resolution. On the global scale, GHG forcing is most important and significant. On the european scale NAO is dominant – GHG forcing is not significant. Time moving analysis shows a growing meaning of GHG forcing compared to natural forcings, especially since around 1985 on the global scale.
 and is reduced in data sets with high spacial resolution. On the global scale, GHG forcing is most important and significant. On the european scale NAO is dominant – GHG forcing is not significant. Time moving analysis shows a growing meaning of GHG forcing compared to natural forcings, especially since around 1985 on the global scale..")
Similar presentations


 that explain maximum variance in (e.g.) 2D (space-time)>")


 considered in the multiple regression statistical model. See the text for data sources. Log.>")