Download presentation
Presentation is loading. Please wait.

1
Admissions Testing: Predicting College Success CRESST September 2002 Wayne J. Camara The College Board

2
Overview Presentation focuses on… Admission Models and Practices Predictors/Criterion of College Success Validity and Subgroup Differences SAT I and SAT II Changes to SAT in 2005

3
Importance of Admisson Factors – 4 year Public

4
Importance of Admisson Factors – 4 year Private

5
Preference in Admissions Test (4-year institutions) 82% of all colleges require test in 99 vs 86% in 89-90 For non-open colleges, (5%) 91% required test in 89-90 vs 87% in 99 Fairtest errors – only 173 of the 390 institutions listed are truly SAT/ACT optional. Annual Survey of Colleges (College Board)
.")
6
Predictor-Criterion Relationship: Criteria Criterion - What outcome do you want to measure? Is it measurable? Predict college success: completion (persistence, graduation) academic (FGPA, Cum GPA) Life success: occupational (salary, job title, degrees) skills (team work, creativity, leadership) community service Benefit: social / economic mobility/ growth
 academic (FGPA, Cum GPA) Life success: occupational (salary, job title, degrees) skills (team work, creativity, leadership) community service Benefit: social / economic mobility/ growth.")
9
Graduation SAT V + M (Astin et al, 1996) 365 institutions, 76,000 students
 365 institutions, 76,000 students")
10
Added value beyond high school grades SAT HSGPA Both Increment All.57.61.68.08 (Bridgeman, et. Al., 2000) Male.56.58.61.07 Female.62.61.71.10 Cumulative.36.42.52.10 (Burton & Ramist 2002) Persistence (all correlations are uncorrected) Non-minority.25.34 - Minority.35.44 - Graduation.29.33.36.03
 Male Female Cumulative (Burton & Ramist 2002) Persistence (all correlations are uncorrected) Non-minority Minority Graduation")
11
Added value beyond high school grades Increment of SAT is about.10 above HSGPA and greatest for African American students HS grades overpredict College grades for Hispanic (.19) and African American males (.22) most. They underpredict grades for white females (-.09)
.")
12
NELS Proficiency Levels x Ethnicity and Income

13
Same Group Differences in HS Grades and Class Rank

14
Differences between HS & College Grades

15
Parental Ed and HSGPA 53

16
Graduation Six-year graduation rates: African Americans (38%) Hispanics (45%) Asians (63%) Whites (56%) SAT scores have only slightly less weight in predicting graduation than HS grades. Actual effects are under estimated as students transfer and attrite who are in good standing.

17
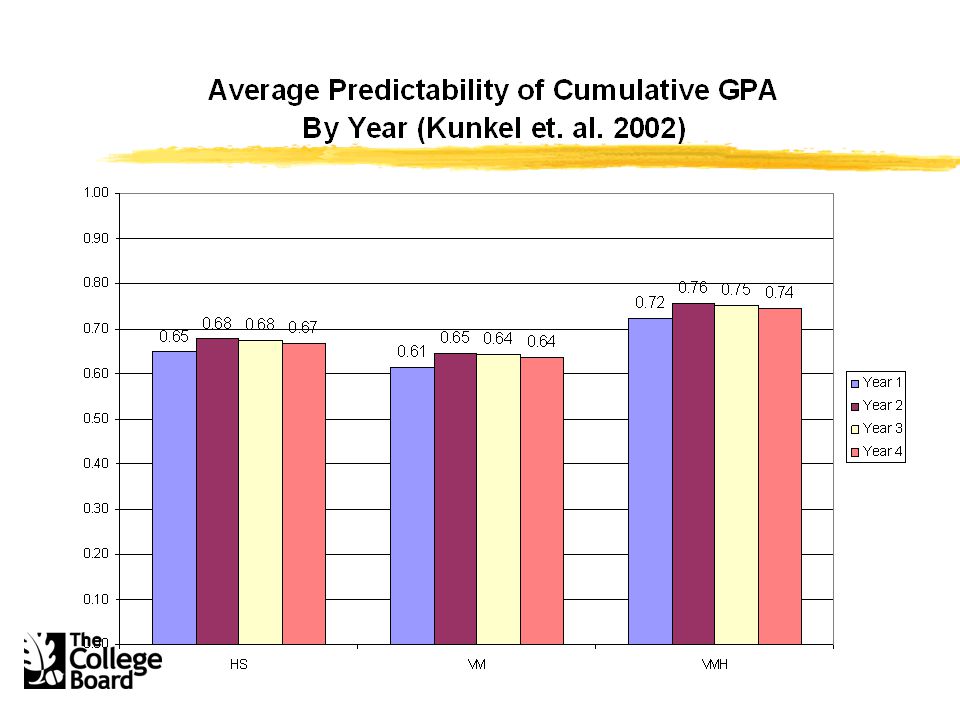
Impact of SAT - Test/Grade Discrepant Score Analysis 68% of students have SAT scores that are highly consistent with their pattern of grades. The remaining 32% of students have discrepant SAT/grades. Half with higher grades. Unadjusted correlation of FGPA with SAT/HSGPA N = 48,410, 23 colleges

18
SAT I vs SAT II 42,985 students entering 38 colleges in 82 and 85. Corrected for shrinkage, restriction of range and crit. unrel.

19
SAT I vs SAT II SAT II more selective test takers Mean SAT I and II for CA Students taking both: V+MWriting Math 1cMath 2c 3 SAT II’s white 1200 593 574646 1764 Latino 1018 (182) 506 (87) 500 (74) 572 (74) 1630 (134) Black 1016 (184) 509 (84) 487 (87) 576 (70) 1503 (261) Asian A 1150 (50) 540 (53) 581 (-7)656 (-10) 1730 (34) Correlations: SAT I V (SAT II W.79) (SAT II Lit.83) SAT I M (SAT II M1C.84) (SAT II M2C.79)
 506 (87) 500 (74) 572 (74) 1630 (134) Black 1016 (184) 509 (84) 487 (87) 576 (70) 1503 (261) Asian A 1150 (50) 540 (53) 581 (-7)656 (-10) 1730 (34) Correlations: SAT I V (SAT II W.79) (SAT II Lit.83) SAT I M (SAT II M1C.84) (SAT II M2C.79)")
20
SAT I vs SAT II Standardized Differences K/C/J = Korean, Chinese, Japanese

21
SAT I and ACT SAT I 138 questions vs ACT 210 questions in similar time SAT two scores (V, M), ACT one score (C, and four subscores) Concordance Study by CB/ETS/ACT (1997) SAT V+M and ACT Composite r=.92 SAT M and ACT M r =.89 SAT V and ACT Reading or English r=.83 SAT V and SAT M r =.66 Correlations between SAT I and SAT II are lower than Correlation between SAT I and ACT
, ACT one score (C, and four subscores) Concordance Study by CB/ETS/ACT (1997) SAT V+M and ACT Composite r=.92 SAT M and ACT M r =.89 SAT V and ACT Reading or English r=.83 SAT V and SAT M r =.66 Correlations between SAT I and SAT II are lower than Correlation between SAT I and ACT")
22
New SAT – Related to College Skills (March/2005) All students take same test – equivalent to current SAT I Three scores (200 – 800 scale) - Critical Reading, Math Reasoning, & Writing Writing includes a 25-minute essay and MC Distributed reading and essay available on web Math more curriculum-related, retain open ended items (qc items removed) Critical Reading – more passages based on curriculum (analogies removed)
 All students take same test – equivalent to current SAT I Three scores (200 – 800 scale) - Critical Reading, Math Reasoning, & Writing Writing includes a 25-minute essay and MC Distributed reading and essay available on web Math more curriculum-related, retain open ended items (qc items removed) Critical Reading – more passages based on curriculum (analogies removed)")
Similar presentations


 & CAHSEE 2009-10 Results Update Prepared for the September 21, 2010 Board of Education.>")


 Report 2010-2011 Presented to ACISD Board of Trustees 12/15/2011 ARANSAS COUNTY ISD – A TEA RECOGNIZED SCHOOL.>")


 About SATs and ACTs December 2010.>")

 Scholars Program Closing the Gap – Redefining the Future Winner-College Board’s 2011 CollegeKeys Compact Innovation.>")