Download presentation
Presentation is loading. Please wait.

1
1 Numerical and Wind-Tunnel Simulation of Wind Loads on Smooth and Rough Domes R.N. Meroney C.W. Letchford P.P. Sarkar

2
2 Powerpoint Presentations!

3
3 Structural Domes Domes are commonly used to enclose large spaces because of their structural efficiency and economic benefit. Domes are excellent at resisting symmetric loading, but Asymmetric loading may cause structural distress and failure.

4
4 Ancient Domed Temples ^ Pantheon Rome 118-125 AD Dome of the Rock > Jerusalem, 684 AD ^ Taj Mahal, Agra India 1631-1641

5
5 Domed Churches < St. Paul’s London 1675-1710 St. Peter’s > Rome 1546-1564 < “Spider” Church, Denver 199?

6
6 Domed Architecture ^ Nappa Center for Performing Arts California, USA ^ Convention Center Hobart, Tasmania Convention Center Hobart, Tasmania Commercial Center Cuerneveca, Mexico ^ ^

7
7 Domed Sports Halls & Stadiums Houston Astrodome Hubert H. Humphrey Metro-Dome, Min Little Sports Palace, Rome Pepsi Center, Denver Sun Dome, Fukui, Japan

8
8 Assembly Hall Dome Assembly Hall, U. of Illinois Urbana/Champ

9
9 Domed Public Buildings ^ Public Exhibition Halls Millennium Dome, London, 320 m diameter, 80,000 sq m floor space Museums and Halls, Barlow Planetarium, CA ^

10
10 Inflated Domes US Pavilion, Osaka Exposition 1970 Carrier Stadium, Syracuse University Georgia Dome, Atlanta Silverdome, Pontiac, MI RCA (Hoosier) Dome Indianapolis, IN
 Dome Indianapolis, IN")
11
11 Inflated Domes (contd) Tokyo Dome “Big Egg” Stadium, Tokyo, Japan
 Tokyo Dome Big Egg Stadium, Tokyo, Japan")
12
12 Industrial and Engineering Domes Nuclear SafetyManure Odor ControlDrinking Water Petrochemical StorageBulk Storage

13
13 Bulk Storage: Dust Supression, Water and Wastewater Treatment Covers Temcor Aluminum Domes Triangulated space truss system with triangulated panels

14
14 Bulk Storage: Coke Piles Pittsburgh, CA Marine Terminal Coke Storage Domes Three 55 m (180 ft) diameter hemispheres Los Angeles, CA Export Terminal Coke Storage Domes Construction Two 73 m (240 ft) diameter hemispheres, Shotcrete applied to interior of inflated airform mounted on footer and stem wall
 diameter hemispheres Los Angeles, CA Export Terminal Coke Storage Domes Construction Two 73 m (240 ft) diameter hemispheres, Shotcrete applied to interior of inflated airform mounted on footer and stem wall")
15
15 Rough Surface Hemispheres Sometimes construction technique leaves surface texture rough!

16
16 Geodesic Dome Construction Demonstration of the construction of an Aluminum Skin Geodesic Dome…. Conservatek Co. (one cycle takes 48 hours)
.")
17
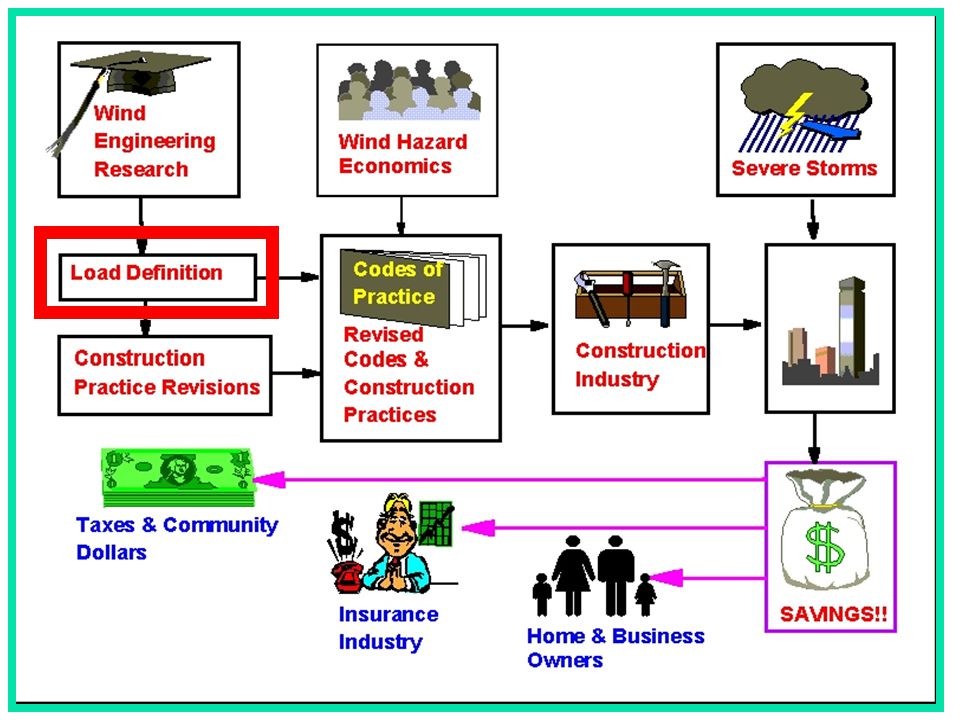
WIND RESEARCH & DESIGN

19
19 CFD Validation Using Physical Modeling VERIFICATION BEFORE PROGNOSTICATION

20
20 CFD Validation Using Physical Modeling: Past Studies StudyCasesProgramFLOWResults Robins et al. (1995) L-shaped bldg 0 0 L-shaped bldg 45 0 L-shaped bldg & slab bldg, 225 o Industrial site, N FLUENT run by 4 inde- pendent partners Turbulent boundary layers Poor scalar transport factors 2-3 too high Meroney et al. (1998) 2d street canyon 3d 3:1:1.26 prism 3d 2:2:1 prism 3d 1:1:1 cube FLUENT K-E model Rey model RNG model Uniform & turbulent boundary layers Poor wake & cavity shapes, Poor scalar transport factors 10-100 too high, Good mean pressure distributions
 L-shaped bldg 0 0 L-shaped bldg 45 0 L-shaped bldg & slab bldg, 225 o Industrial site, N FLUENT run by 4 inde- pendent partners Turbulent boundary layers Poor scalar transport factors 2-3 too high Meroney et al. (1998) 2d street canyon 3d 3:1:1.26 prism 3d 2:2:1 prism 3d 1:1:1 cube FLUENT K-E model Rey model RNG model Uniform & turbulent boundary layers Poor wake & cavity shapes, Poor scalar transport factors too high, Good mean pressure distributions.")
21
21 Wind Effects on Rectangular Structures

22
22 AIJ Rectangular Prism Experiments: Numerical and Physical Modeling AIJ study included 65 sets of laboratory data and 51 CFD simulations. Model dimensions were B:D:H=1:1:0.5 Meroney et al. (1998) simulated with FLUENT code, Rey model, 92,000 cells. Surface pressure distributions were quantitatively similar.
 simulated with FLUENT code, Rey model, 92,000 cells. Surface pressure distributions were quantitatively similar..")
23
23 Meso-scale Modeling of Downbursts Grid 3 Grid 5 5 3 2T & F1 LES using CSU RAMS 5 nested grids down to 1 m scale of flow from a thunderstorm downburst.

24
24 Wind Effects on Hemispherical Domes Inflated domes require internal pressures exceeding external pressures to avoid buckling. Internal pressures must not be too large or excessive membrane or tensile forces occur, and membrane tears.

25
25 Wind-tunnel Study of Inflated Domes 1 2 3 Newman, Ganguli and Shrivastava (1984) studied pressure distributions on three inflatable domes in a boundary layer. H/D = 0.5, 0.37 & 0.25, H/ =0.12-0.13, U=7.5 m/s, Re=UD/ =226,000 FEM calculations show buckling occurs on plane of symmetry and upwind when the internal inflation pressures < 0.7-0.44 of the dynamic pressure at the dome top.

26
26 CSU WEFL Wind Tunnel Experiment Pressure Scanner Pressure Transducer CSU WEFL Industrial Aerodynamics Wind Tunnel PC-NT Computer Postprocess Software Hot Film Anemometer

27
27 Wind-Tunnel Initial Conditions 20 m 2 m 1.8 m Grid: 86,000 cells Velocity Contours: U max = 15 m/s Z = 1m Z = 0.8 m ASCE 7-98C Windtunnel

28
28 Grid Systems: One and Two Domes 18,000 Cells 33,000 Cells 16,400 Cells 43,000 Cells

29
29 12,800 cells Grid Systems: One and Two Domes

30
30 Hemisphere Grids Boundary layer & Hex Grid Boundary layer & Tet Grid

31
31 Velocity & Turbulence Profiles: Single Dome Comparisons

32
32 Single Dome Comparisons: Pressure Profiles

33
33 Single Dome Comparisons: Reynolds Number Variation Reynolds Number = (U H/ ) = 185,000 Reynolds Number = (U H/ ) = 1,440,000 Conclusion: No significant difference
 = 185,000 Reynolds Number = (U H/ ) = 1,440,000 Conclusion: No significant difference")
34
34 Single Dome Comparisons: Turbulence Models Standard kappa- epsilon model (2 equations) Reynolds stress model (7 equations) Spalart Allmaras model (1 equation) Conclusion: No significant difference
 Reynolds stress model (7 equations) Spalart Allmaras model (1 equation) Conclusion: No significant difference")
35
35 Single Dome Comparisons: Pressure Profiles

36
36 Single Dome Comparisons: Smooth vs Rough

37
37 Double Dome Comparisons Approach wind at 90 o

38
38 Double Dome Comparisons Approach wind at 90 o

39
39 Surface Pressures: Angles 0 o, 45 o & 90 o

40
40 Pressure Coefficient Contours: Experimental vs Numerical: Approach wind at 0 o Cp Contours: numerical Cp Contours: experimental 39

41
41 Double Dome Comparisons Approach wind at 0 o

42
42 Double Dome Comparisons Approach wind at 45 o

43
43 Double Dome Comparisons Approach wind at 45 o

44
44 Pressure Coefficient Contours: Experimental vs Numerical: Approach wind at 90 o Cp Contours: numerical Cp Contours: experimental

45
45 Double Dome Comparisons Approach wind at 90 o

46
46 Pressure Coefficient Contours: Experimental vs Numerical: Approach wind at 90 o Cp Contours: numerical Cp Contours: experimental

47
47 Double Dome Comparisons Approach wind at 90 o

48
48 Conclusions CFD calculations reproduced mean Cp behavior over smooth, rough and paired domes. CFD calculations using k- , RNG, and Rey turbulence models gave similar results. CFD calculations at high and low Reynolds numbers gave similar results.

49
49 WHALE WATCHING IS NOT AN EMERGENCY KEEP DRIVING GOOD LUCK Approaching the End

50
50 The End

Similar presentations