Download presentation
Presentation is loading. Please wait.

1
Load Models for Bridges Outline Dead load Live load Extreme load events Load combinations Andrzej S. Nowak University of Michigan Ann Arbor, Michigan

4
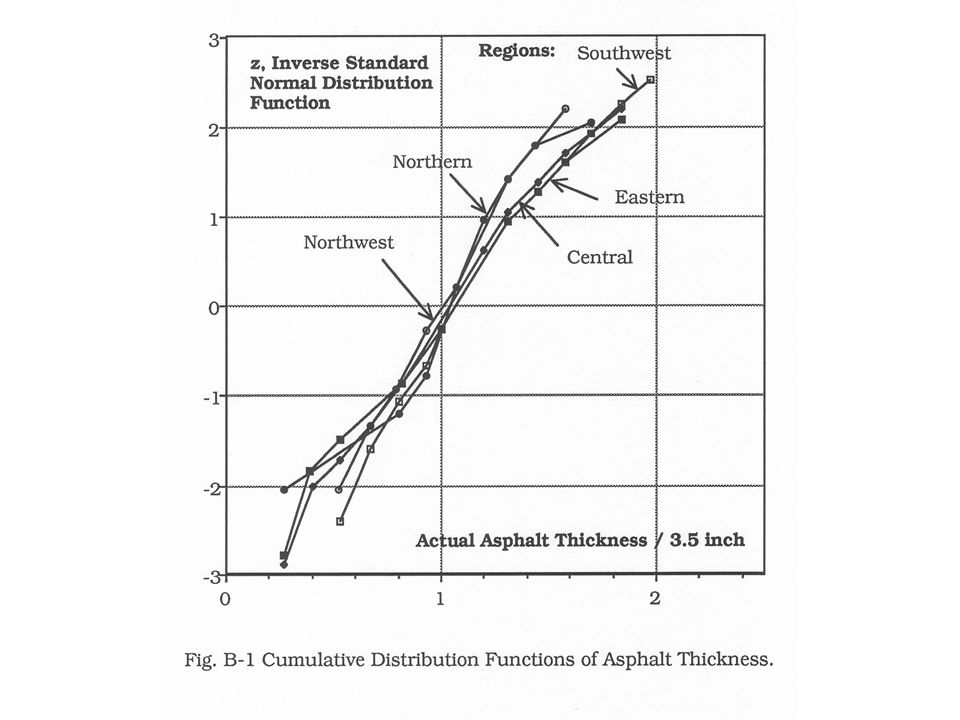
Load Models For each load component: Bias factor, = mean/nominal Coefficient of variation, V = /mean Cumulative distribution function (CDF) Time variation: return period, duration
 Time variation: return period, duration")
7
Statistical Data Base Load surveys (e.g. weigh-in-motion truck measurement) Load distribution (load effect per component) Simulations (e.g. Monte Carlo) Finite element analysis Boundary conditions (field tests)
 Load distribution (load effect per component) Simulations (e.g. Monte Carlo) Finite element analysis Boundary conditions (field tests).")
8
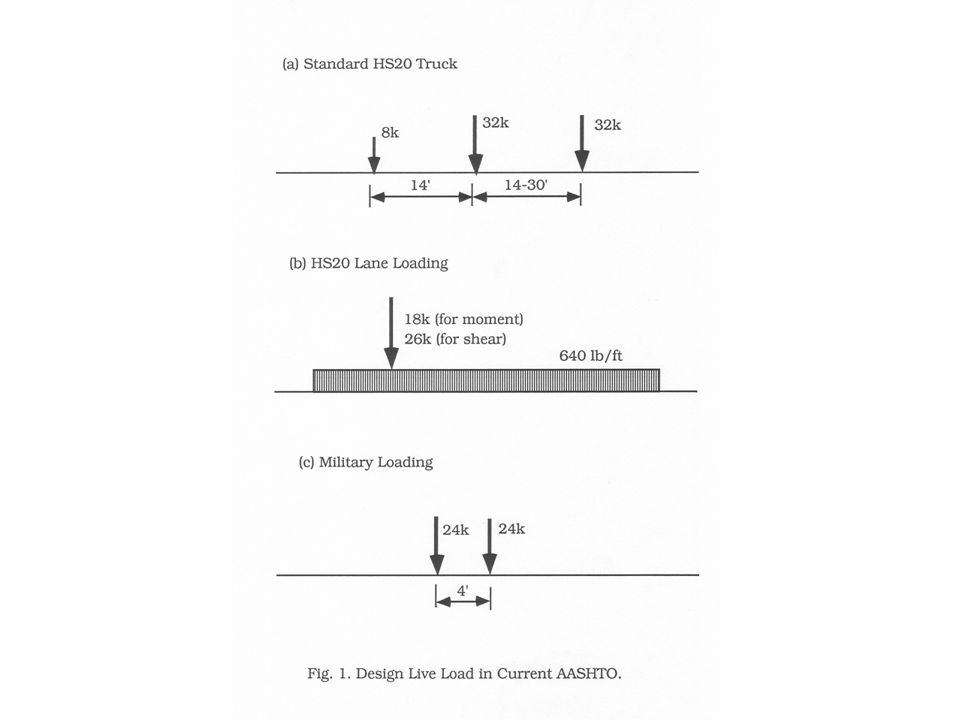
Examples of Load Parameters Dead load for bridges = 1.03-1.05 V = 0.08-0.10 Live load parameters for bridges (AASHTO LRFD Code) = 1.25-1.35 V = 0.12
 = V = 0.12")
14
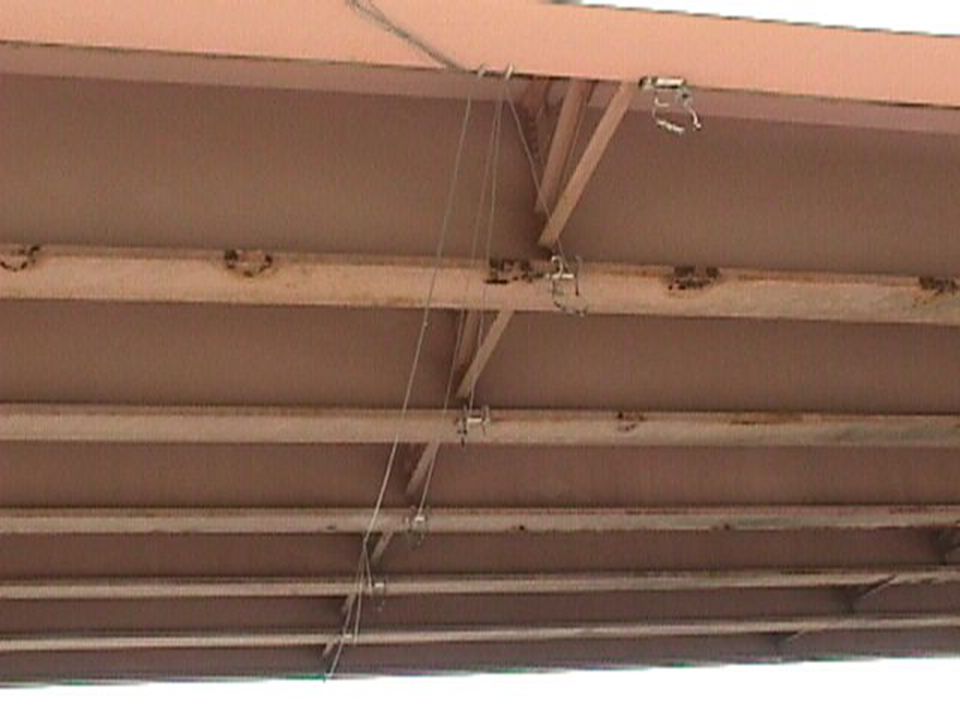
No. 4 Stanley Road over I-75 in Flint (S11-25032)
")
20
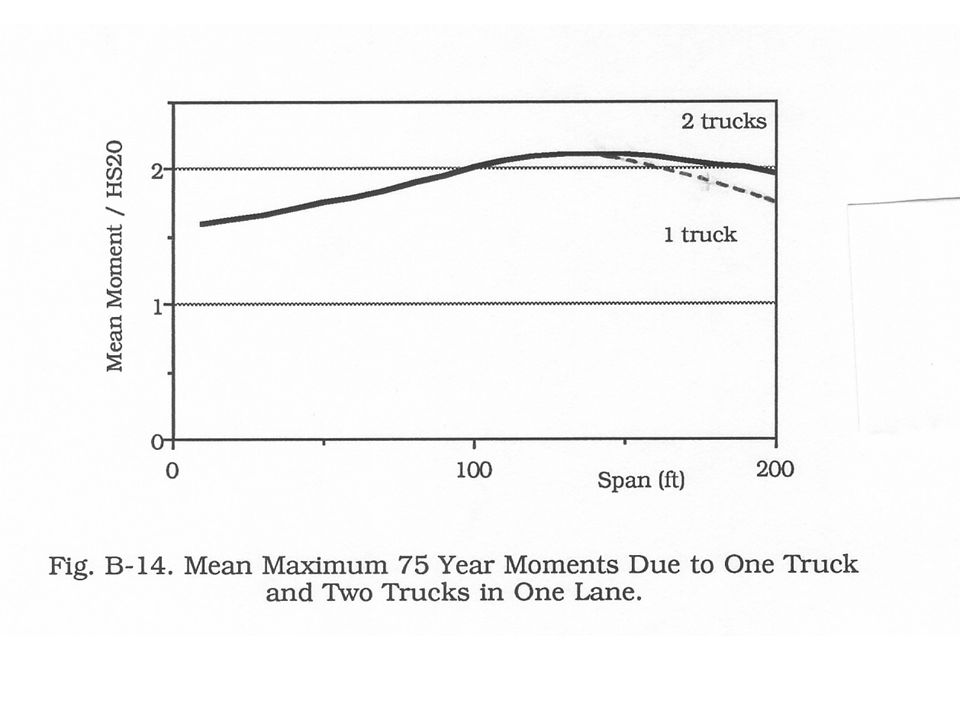
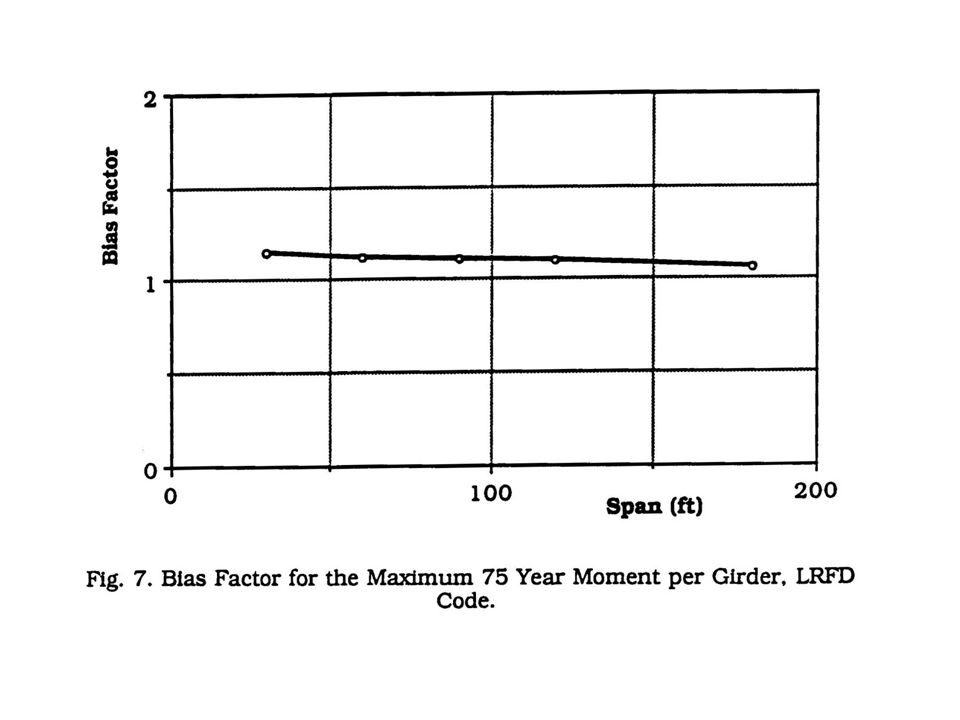
Examples of Bias Factors Two bridge design codes are considered: AASHTO Standard Specifications (1996) AASHTO LRFD Code (1998) For the first one, denoted by HS20, bias factor is non-uniform, so design load in LRFD Code was changed, and the result is much better.
 AASHTO LRFD Code (1998) For the first one, denoted by HS20, bias factor is non-uniform, so design load in LRFD Code was changed, and the result is much better.")
25
Two trucks side-by-side

27
Bias Factor for Load Effect Bias factors shown previously were for lane load (bridge live load) For components (bridge girders), bias factor can be very different
 For components (bridge girders), bias factor can be very different")
28
Girder Distribution Factors What is the percentage of lane load per girder? Is the actual distribution the same as specified by the design code? What are the maximum strains? What is the load distribution factor for one lane traffic and for two lanes

30
Code-Specified GDF - AASHTO Standard (1996) Steel and prestressed concrete girders One lane of traffic Two lanes of traffic S = girder spacing (m)
 Steel and prestressed concrete girders One lane of traffic Two lanes of traffic S = girder spacing (m)")
32
Code-specified GDF - AASHTO LRFD (1998) One lane Two lanes
 One lane Two lanes")
34
Dynamic Load Roughness of the road surface (pavement) Bridge as a dynamic system (natural frequency of vibration) Dynamic parameters of the vehicle (suspension system, shock absorbers)
 Bridge as a dynamic system (natural frequency of vibration) Dynamic parameters of the vehicle (suspension system, shock absorbers)")
35
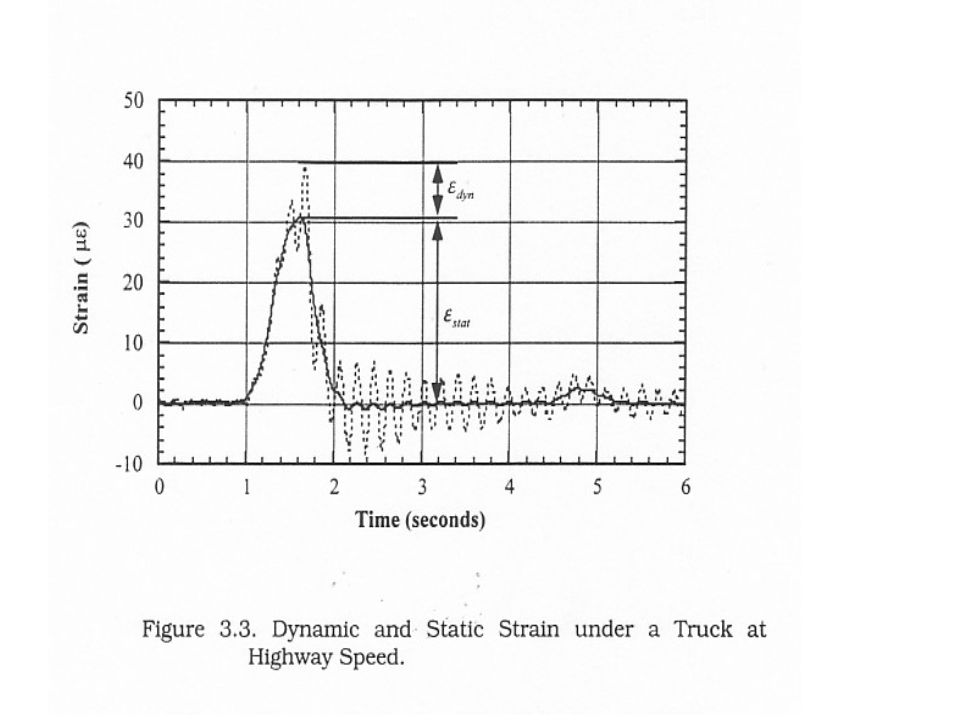
Dynamic Load Factor (DLF) Static strain or deflection (at crawling speed) Maximum strain or deflection (normal speed) Dynamic strain or deflection = maximum - static DLF = dynamic / static
 Static strain or deflection (at crawling speed) Maximum strain or deflection (normal speed) Dynamic strain or deflection = maximum - static DLF = dynamic / static")
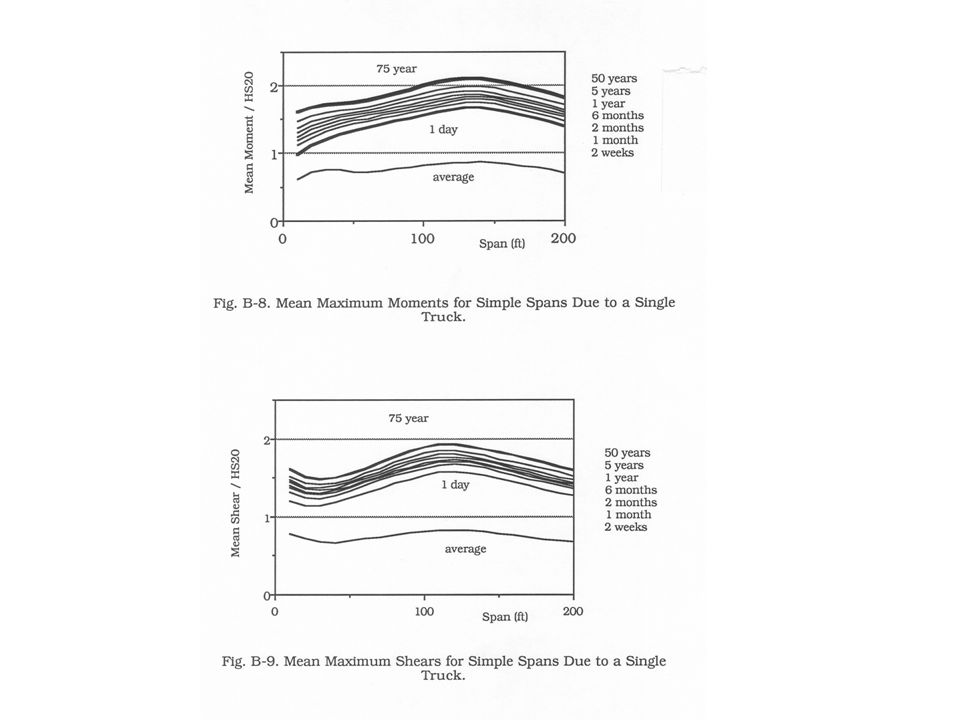
37
Code Specified Dynamic Load Factor AASHTO Standard (1996) AASHTO LRFD (1998) 0.33 of truck effect, no dynamic load for the uniform loading
 AASHTO LRFD (1998) 0.33 of truck effect, no dynamic load for the uniform loading")
41
Load Combinations Load combination factors can be determined by considering the reduced probability for a simultaneous occurrence of time-varying load components So called Turkstra’s rule can be applied

42
Turkstra’s Rule Consider a combination of uncorrelated, time- varying load components Q = A + B + C For each load component consider two values: maximum and average. Then, Qmax = maximum of the following: (A max + B ave + C ave ) (A ave + B max + C ave ) (A ave + B ave + C max )
 (A ave + B max + C ave ) (A ave + B ave + C max ).")
Similar presentations