Download presentation
Presentation is loading. Please wait.

1
Frank Rausche, Garland Likins 2011, Pile Dynamics, Inc. Fundamentals GRLWEAP™ Fundamentals

2
CONTENTCONTENT Background and TerminologyBackground and Terminology Wave Equation ModelsWave Equation Models –Hammer –Pile –Soil The Program FlowThe Program Flow –Bearing graph –Inspector’s Chart –Driveability Background and TerminologyBackground and Terminology Wave Equation ModelsWave Equation Models –Hammer –Pile –Soil The Program FlowThe Program Flow –Bearing graph –Inspector’s Chart –Driveability

3
1800sClosed Form Solutions & Energy Formulas 1950:Smith’s Wave Equation 1970:CAPWAP 1976: WEAP, TTI (mainframes) 1980s:GRLWEAP(PC’s) 1986:Hammer Performance Study 1996, 2006:FHWA Manual updates 1800sClosed Form Solutions & Energy Formulas 1950:Smith’s Wave Equation 1970:CAPWAP 1976: WEAP, TTI (mainframes) 1980s:GRLWEAP(PC’s) 1986:Hammer Performance Study 1996, 2006:FHWA Manual updates Some important developments in Dynamic Pile Analysis WEAP = Wave Equation Analysis of Piles
 1980s:GRLWEAP(PC’s) 1986:Hammer Performance Study 1996, 2006:FHWA Manual updates 1800sClosed Form Solutions & Energy Formulas 1950:Smith’s Wave Equation 1970:CAPWAP 1976: WEAP, TTI (mainframes) 1980s:GRLWEAP(PC’s) 1986:Hammer Performance Study 1996, 2006:FHWA Manual updates Some important developments in Dynamic Pile Analysis WEAP = Wave Equation Analysis of Piles")
4
WAVE EQUATION OBJECTIVES Smith’s Basic Premise:Smith’s Basic Premise: –Replace Energy Formula –Use improved pile model (elastic pile) –Use improved soil model (elasto-plastic static with damping) –Allow for stress calculations Later GRLWEAP improvements:Later GRLWEAP improvements: –realistic Diesel hammer model (thermodynamics) –comparison with pile top measurements –development of more reliable soil constants –driveability and inspectors’ chart options –residual stress analysis option Smith’s Basic Premise:Smith’s Basic Premise: –Replace Energy Formula –Use improved pile model (elastic pile) –Use improved soil model (elasto-plastic static with damping) –Allow for stress calculations Later GRLWEAP improvements:Later GRLWEAP improvements: –realistic Diesel hammer model (thermodynamics) –comparison with pile top measurements –development of more reliable soil constants –driveability and inspectors’ chart options –residual stress analysis option
 –Use improved soil model (elasto-plastic static with damping) –Allow for stress calculations Later GRLWEAP improvements:Later GRLWEAP improvements: –realistic Diesel hammer model (thermodynamics) –comparison with pile top measurements –development of more reliable soil constants –driveability and inspectors’ chart options –residual stress analysis option Smith’s Basic Premise:Smith’s Basic Premise: –Replace Energy Formula –Use improved pile model (elastic pile) –Use improved soil model (elasto-plastic static with damping) –Allow for stress calculations Later GRLWEAP improvements:Later GRLWEAP improvements: –realistic Diesel hammer model (thermodynamics) –comparison with pile top measurements –development of more reliable soil constants –driveability and inspectors’ chart options –residual stress analysis option")
5
GRLWEAP Application WHEN?WHEN? –Before pile driving begins –After initial dynamic pile testing ( refined ) WHY?WHY? –Equipment selection or qualification –Stress determination –Formulate driving criterion Blow count calculation for desired capacityBlow count calculation for desired capacity –Capacity determination from observed blow count WHEN?WHEN? –Before pile driving begins –After initial dynamic pile testing ( refined ) WHY?WHY? –Equipment selection or qualification –Stress determination –Formulate driving criterion Blow count calculation for desired capacityBlow count calculation for desired capacity –Capacity determination from observed blow count
 WHY WHY. –Equipment selection or qualification –Stress determination –Formulate driving criterion Blow count calculation for desired capacityBlow count calculation for desired capacity –Capacity determination from observed blow count WHEN WHEN. –Before pile driving begins –After initial dynamic pile testing ( refined ) WHY WHY. –Equipment selection or qualification –Stress determination –Formulate driving criterion Blow count calculation for desired capacityBlow count calculation for desired capacity –Capacity determination from observed blow count.")
6
Some WEAP Terminology Hammer Ram plus hammer assemblyHammer Ram plus hammer assembly Hammer assembly All non-striking hammer componentsHammer assembly All non-striking hammer components Hammer efficiencyRatio of E k just before impact to E pHammer efficiencyRatio of E k just before impact to E p Driving system All components between hammer and pile topDriving system All components between hammer and pile top Helmet weightWeight of driving systemHelmet weightWeight of driving system Hammer cushionProtects hammer - between helmet and ramHammer cushionProtects hammer - between helmet and ram Pile cushionProtects pile - between helmet and pile topPile cushionProtects pile - between helmet and pile top CapGenerally the striker plate + hammer cushion+helmetCapGenerally the striker plate + hammer cushion+helmet Pile dampingDamping of pile materialPile dampingDamping of pile material Soil dampingDamping of soil in pile-soil interfaceSoil dampingDamping of soil in pile-soil interface QuakePile displacement when static resistance reaches ultimateQuakePile displacement when static resistance reaches ultimate Hammer Ram plus hammer assemblyHammer Ram plus hammer assembly Hammer assembly All non-striking hammer componentsHammer assembly All non-striking hammer components Hammer efficiencyRatio of E k just before impact to E pHammer efficiencyRatio of E k just before impact to E p Driving system All components between hammer and pile topDriving system All components between hammer and pile top Helmet weightWeight of driving systemHelmet weightWeight of driving system Hammer cushionProtects hammer - between helmet and ramHammer cushionProtects hammer - between helmet and ram Pile cushionProtects pile - between helmet and pile topPile cushionProtects pile - between helmet and pile top CapGenerally the striker plate + hammer cushion+helmetCapGenerally the striker plate + hammer cushion+helmet Pile dampingDamping of pile materialPile dampingDamping of pile material Soil dampingDamping of soil in pile-soil interfaceSoil dampingDamping of soil in pile-soil interface QuakePile displacement when static resistance reaches ultimateQuakePile displacement when static resistance reaches ultimate

7
Some WEAP Terminology Bearing Graph Ult. Capacity and max. stress vs. blow count for a given penetration depthBearing Graph Ult. Capacity and max. stress vs. blow count for a given penetration depth Inspector’s ChartCalculates blow count and stresses for given ult. capacity at a given penetration depth as a function of stroke/energyInspector’s ChartCalculates blow count and stresses for given ult. capacity at a given penetration depth as a function of stroke/energy Driveability analysisCalculate blow count and stresses vs. depth based on static soils analysisDriveability analysisCalculate blow count and stresses vs. depth based on static soils analysis SRDStatic Resistance to DrivingSRDStatic Resistance to Driving Soil set-up factorRatio of long term to EOD resistanceSoil set-up factorRatio of long term to EOD resistance Gain/loss factorRatio of SRD to long term resistanceGain/loss factorRatio of SRD to long term resistance Variable set-upSetup occurring during a limited driving interruptionVariable set-upSetup occurring during a limited driving interruption Bearing Graph Ult. Capacity and max. stress vs. blow count for a given penetration depthBearing Graph Ult. Capacity and max. stress vs. blow count for a given penetration depth Inspector’s ChartCalculates blow count and stresses for given ult. capacity at a given penetration depth as a function of stroke/energyInspector’s ChartCalculates blow count and stresses for given ult. capacity at a given penetration depth as a function of stroke/energy Driveability analysisCalculate blow count and stresses vs. depth based on static soils analysisDriveability analysisCalculate blow count and stresses vs. depth based on static soils analysis SRDStatic Resistance to DrivingSRDStatic Resistance to Driving Soil set-up factorRatio of long term to EOD resistanceSoil set-up factorRatio of long term to EOD resistance Gain/loss factorRatio of SRD to long term resistanceGain/loss factorRatio of SRD to long term resistance Variable set-upSetup occurring during a limited driving interruptionVariable set-upSetup occurring during a limited driving interruption

8
THE WAVE EQUATION MODEL The Wave Equation Analysis calculates the movements (velocities and displacements) of any point of a slender elastic rod at any time.The Wave Equation Analysis calculates the movements (velocities and displacements) of any point of a slender elastic rod at any time. The calculation is based on rodThe calculation is based on rod –Length –Cross Sectional Area –Elastic Modulus –Mass density The Wave Equation Analysis calculates the movements (velocities and displacements) of any point of a slender elastic rod at any time.The Wave Equation Analysis calculates the movements (velocities and displacements) of any point of a slender elastic rod at any time. The calculation is based on rodThe calculation is based on rod –Length –Cross Sectional Area –Elastic Modulus –Mass density
 of any point of a slender elastic rod at any time.The Wave Equation Analysis calculates the movements (velocities and displacements) of any point of a slender elastic rod at any time. The calculation is based on rodThe calculation is based on rod –Length –Cross Sectional Area –Elastic Modulus –Mass density.")
9
GRLWEAP Fundamentals For a pile driving analysis, the “rod” is Hammer + Driving System + PileFor a pile driving analysis, the “rod” is Hammer + Driving System + Pile The rod is assumed to be elastic(?) and slender(?)The rod is assumed to be elastic(?) and slender(?) The soil is represented by resistance forces acting at the pile soil interfaceThe soil is represented by resistance forces acting at the pile soil interface For a pile driving analysis, the “rod” is Hammer + Driving System + PileFor a pile driving analysis, the “rod” is Hammer + Driving System + Pile The rod is assumed to be elastic(?) and slender(?)The rod is assumed to be elastic(?) and slender(?) The soil is represented by resistance forces acting at the pile soil interfaceThe soil is represented by resistance forces acting at the pile soil interface
 and slender( )The rod is assumed to be elastic( ) and slender( ) The soil is represented by resistance forces acting at the pile soil interfaceThe soil is represented by resistance forces acting at the pile soil interface For a pile driving analysis, the rod is Hammer + Driving System + PileFor a pile driving analysis, the rod is Hammer + Driving System + Pile The rod is assumed to be elastic( ) and slender( )The rod is assumed to be elastic( ) and slender( ) The soil is represented by resistance forces acting at the pile soil interfaceThe soil is represented by resistance forces acting at the pile soil interface")
10
GRLWEAP - 3 Hammer Models

11
Ram: A, L for stiffness, mass Cylinder and upper frame = assembly top mass Drop height External Combustion Hammer Modeling Ram guides for assembly stiffness Hammer base = assembly bottom mass

12
External Combustion Hammer Model Ram modeled like rodRam modeled like rod Stroke is an input (Energy/Ram Weight)Stroke is an input (Energy/Ram Weight) Impact Velocity Calculated from Stroke with Hammer Efficiency ReductionImpact Velocity Calculated from Stroke with Hammer Efficiency Reduction Assembly impacts during pile reboundAssembly impacts during pile rebound Ram modeled like rodRam modeled like rod Stroke is an input (Energy/Ram Weight)Stroke is an input (Energy/Ram Weight) Impact Velocity Calculated from Stroke with Hammer Efficiency ReductionImpact Velocity Calculated from Stroke with Hammer Efficiency Reduction Assembly impacts during pile reboundAssembly impacts during pile rebound
Stroke is an input (Energy/Ram Weight) Impact Velocity Calculated from Stroke with Hammer Efficiency ReductionImpact Velocity Calculated from Stroke with Hammer Efficiency Reduction Assembly impacts during pile reboundAssembly impacts during pile rebound Ram modeled like rodRam modeled like rod Stroke is an input (Energy/Ram Weight)Stroke is an input (Energy/Ram Weight) Impact Velocity Calculated from Stroke with Hammer Efficiency ReductionImpact Velocity Calculated from Stroke with Hammer Efficiency Reduction Assembly impacts during pile reboundAssembly impacts during pile rebound")
13
External Combustion Hammers Ram Model Ram segments ~1m long Combined Ram- H.Cushion Helmet mass Combined Ram- H.Cushion Helmet mass

14
External Combustion Hammers Assembly model Assembly segments, typically 2 Helmet mass

15
External Combustion Hammers Combined Ram Assembly Model Combined Ram- H.Cushion Helmet mass Combined Ram- H.Cushion Helmet mass Ram segments Assembly segments Ram segments Assembly segments

16
External Combustion Hammer Procedure Static analysis static pile/soil displacements due to weight of assembly, helmet and pileStatic analysis static pile/soil displacements due to weight of assembly, helmet and pile Dynamic analysis starts when ram is within 1 ms of impact.Dynamic analysis starts when ram is within 1 ms of impact. All ram segments then have velocityAll ram segments then have velocity V RAM = (2 g h η) 1/2 – 0.001 g where: h = E rating / W RAM Static analysis static pile/soil displacements due to weight of assembly, helmet and pileStatic analysis static pile/soil displacements due to weight of assembly, helmet and pile Dynamic analysis starts when ram is within 1 ms of impact.Dynamic analysis starts when ram is within 1 ms of impact. All ram segments then have velocityAll ram segments then have velocity V RAM = (2 g h η) 1/2 – 0.001 g where: h = E rating / W RAM
 1/2 – g where: h = E rating / W RAM Static analysis static pile/soil displacements due to weight of assembly, helmet and pileStatic analysis static pile/soil displacements due to weight of assembly, helmet and pile Dynamic analysis starts when ram is within 1 ms of impact.Dynamic analysis starts when ram is within 1 ms of impact. All ram segments then have velocityAll ram segments then have velocity V RAM = (2 g h η) 1/2 – g where: h = E rating / W RAM.")
17
DIESEL HAMMERS

18
Diesel hammer components Piston = Ram Port (closed by piston) Combustion chamber Impact block Hammer Cushion; Helmet CylinderCylinder Compressive stroke
 Combustion chamber Impact block Hammer Cushion; Helmet CylinderCylinder Compressive stroke")
19
DIESEL Hammer MODEL Ram, Impact Block modeled like rodsRam, Impact Block modeled like rods Compression, Expansion Pressures from Gas LawCompression, Expansion Pressures from Gas Law Combustion Pressure from rated energy – measurements; different for Atomized and Liquid Fuel injectionCombustion Pressure from rated energy – measurements; different for Atomized and Liquid Fuel injection Ram velocity reduced by efficiency just before impactRam velocity reduced by efficiency just before impact Ram, Impact Block modeled like rodsRam, Impact Block modeled like rods Compression, Expansion Pressures from Gas LawCompression, Expansion Pressures from Gas Law Combustion Pressure from rated energy – measurements; different for Atomized and Liquid Fuel injectionCombustion Pressure from rated energy – measurements; different for Atomized and Liquid Fuel injection Ram velocity reduced by efficiency just before impactRam velocity reduced by efficiency just before impact

20
Diesel Hammer Ram Model Hammer Cushion Helmet mass Hammer Cushion Helmet mass Ram segments ~1m long Impact Block mass Ram bottom/impact block

21
Diesel Hammer Combustion Pressure Model Precompression- Combustion- Expansion- pressures from thermodynamics PortsPorts Compressive Stroke, h CCompressive Stroke, h C Cylinder Area, A CHCylinder Area, A CH Final Chamber Volume, V CHFinal Chamber Volume, V CH Max. Pressure, p MAXMax. Pressure, p MAX Compressive Stroke, h CCompressive Stroke, h C Cylinder Area, A CHCylinder Area, A CH Final Chamber Volume, V CHFinal Chamber Volume, V CH Max. Pressure, p MAXMax. Pressure, p MAX hChChChC hChChChC

22
DIESEL PRESSURE MODEL Liquid Injection Hammers TimeTime Pressure p MAX PortOpenPortOpen Port Closure ImpactImpact CompressionCompression ExpansionExpansion CombustionCombustion

23
DIESEL PRESSURE MODEL Liquid Injection Hammers Liquid Injection Timing Parameters: TimeTime Pressure p MAX PortOpenPortOpen Port Closure ImpactImpact tDtDtDtD Compression: p=p atm (V in /V) 1.35 Compression: Expansion: p=p MAX (V CH /V) 1.25 Expansion: Combustion Delay, ∆t Combustion Duration, t D ∆t∆t∆t∆t
 1.35 Compression: Expansion: p=p MAX (V CH /V) 1.25 Expansion: Combustion Delay, ∆t Combustion Duration, t D ∆t∆t∆t∆t")
24
DIESEL PRESSURE MODEL Atomized Injection Hammers Atomized Injection Timing Parameters: TimeTime PressurePressure p MAX PortOpen Port Closed Impact Compression: p=p atm (V in /V) 1.35 Expansion: p=p MAX (V CH /V) 1.35 V = V END V = V BEG Volume of Injection End, V BEG Volume of Injection End, V END
 1.35 Expansion: p=p MAX (V CH /V) 1.35 V = V END V = V BEG Volume of Injection End, V BEG Volume of Injection End, V END")
25
CLOSED END DIESEL BOUNCE CHAMBER PRESSURE MODEL Pressure Tank Bounce Chamber Ports Safety Distance FBFBFBFB F B = p atm (V in /V) 1.4 F B W R F B = p atm (V in /V) 1.4 F B W R W React
 1.4 F B W R F B = p atm (V in /V) 1.4 F B W R W React")
26
Downward = upward stroke Downward = upward stroke Program Flow – Diesel Hammers Fixed pressure, variable stroke Downward = rated stroke Downward = rated stroke Calculate pile and ram motion ram motion Calculate pile and ram motion ram motion Find upward stroke stroke Output Output Strokesmatch?Strokesmatch? Setup hammer, Setup hammer, pile, soil model Setup hammer, Setup hammer, pile, soil model Next Ru? N N

27
Downward = upward stroke Downward = upward stroke Program Flow – Diesel Hammers Fixed pressure, variable stroke Downward = rated stroke Downward = rated stroke Calculate pile and ram motion ram motion Calculate pile and ram motion ram motion Find upward stroke stroke Output Output Strokesmatch?Strokesmatch? Setup hammer, Setup hammer, pile, soil model Setup hammer, Setup hammer, pile, soil model Next Ru? N N

28
Diesel Hammer Analysis Procedure 1 Assume stroke 2 Calculate static pile/soil displacements/forces 3 Calculate ram velocity at ports 4 Dynamic analysis begins 5 Two milliseconds before impact, efficiency reduction of ram velocity 6 Impact, combustion, expansion 7 Ram clears port; upstroke calculated 8 If stroke difference > stroke criterion go to 3 1 Assume stroke 2 Calculate static pile/soil displacements/forces 3 Calculate ram velocity at ports 4 Dynamic analysis begins 5 Two milliseconds before impact, efficiency reduction of ram velocity 6 Impact, combustion, expansion 7 Ram clears port; upstroke calculated 8 If stroke difference > stroke criterion go to 3

29
Potential / Kinetic Energy WPWPWPWP WRWRWRWR h E P = W R h (potential or rated energy) E P = W R h (potential or rated energy) WRWRWRWR v i v i E K = ηE P (η - hammer efficiency) E K = ηE P (η - hammer efficiency) v i = 2g h η E K = ½ m R v i 2 (kinetic energy) E K = ½ m R v i 2 (kinetic energy) Max E T = ∫F(t) v(t) dt “Transferred Energy”EMX “Transferred Energy”EMX ETR = EMX/ E R =“transfer ratio”
 E P = W R h (potential or rated energy) WRWRWRWR v i v i E K = ηE P (η - hammer efficiency) E K = ηE P (η - hammer efficiency) v i = 2g h η E K = ½ m R v i 2 (kinetic energy) E K = ½ m R v i 2 (kinetic energy) Max E T = ∫F(t) v(t) dt Transferred Energy EMX Transferred Energy EMX ETR = EMX/ E R = transfer ratio")
30
GRLWEAP hammer efficiencies The hammer efficiency reduces the impact velocity of the ram; reduction factor is based on experienceThe hammer efficiency reduces the impact velocity of the ram; reduction factor is based on experience

31
GRLWEAP hammer efficiencies The hammer efficiency reduces the impact velocity of the ram; reduction factor is based on experienceThe hammer efficiency reduces the impact velocity of the ram; reduction factor is based on experience Hammer efficiencies cover all losses which cannot be calculatedHammer efficiencies cover all losses which cannot be calculated

32
GRLWEAP hammer efficiencies The hammer efficiency reduces the impact velocity of the ram; reduction factor is based on experienceThe hammer efficiency reduces the impact velocity of the ram; reduction factor is based on experience Hammer efficiencies cover all losses which cannot be calculatedHammer efficiencies cover all losses which cannot be calculated Diesel hammer energy loss due to precompression or cushioning can be calculated and, therefore, is not covered by hammer efficiencyDiesel hammer energy loss due to precompression or cushioning can be calculated and, therefore, is not covered by hammer efficiency

33
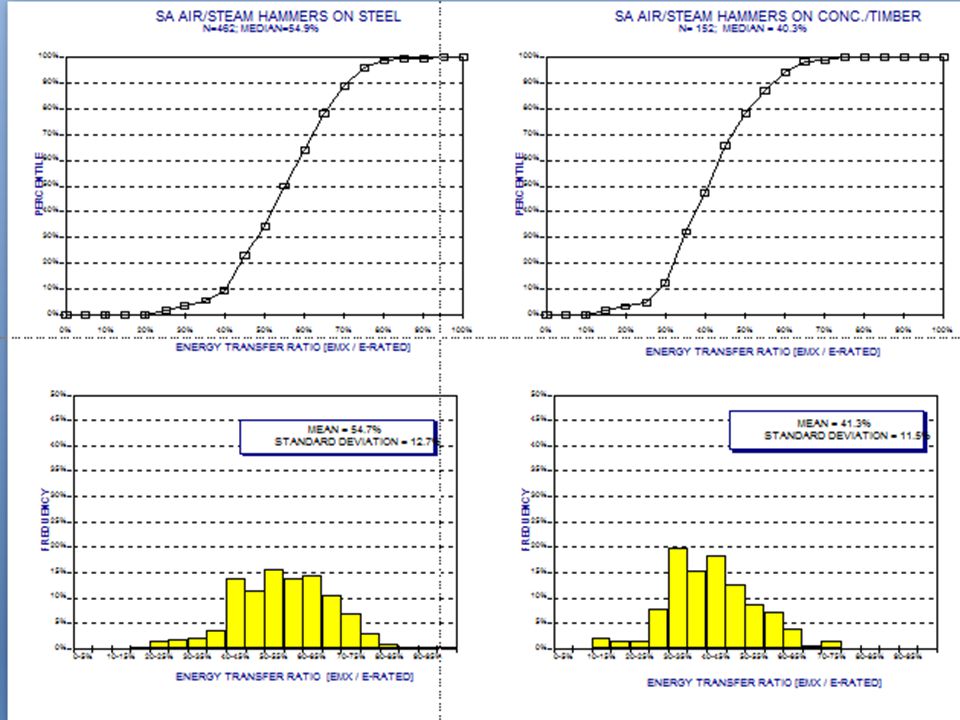
Transfer energy ratios

34
GRLWEAP diesel hammer efficiencies Open end diesel hammers:0.80 (uncertainty of fall height, friction, alignment) Closed end diesel hammers:0.80 (uncertainty of fall height, friction, power assist, alignment)
 Closed end diesel hammers:0.80 (uncertainty of fall height, friction, power assist, alignment)")
36
Other ECH efficiency recommendations Single acting Air/Steam hammers:0.67 (fall height, preadmission, friction, alignment) Double acting Air/Steam/Hydraulic:0.50 (preadmission, reduced pressure, friction, alignment) Drop hammers winch released:0.50 (uncertainty of fall height, friction, and winch losses) Free released drop hammers (rare):0.67 (uncertainty of fall height friction) (uncertainty of fall height friction)
 Double acting Air/Steam/Hydraulic:0.50 (preadmission, reduced pressure, friction, alignment) Drop hammers winch released:0.50 (uncertainty of fall height, friction, and winch losses) Free released drop hammers (rare):0.67 (uncertainty of fall height friction) (uncertainty of fall height friction)")
38
GRLWEAP hydraulic hammer efficiencies Hammers with internal monitor:0.95 (uncertainty of hammer alignment) Hydraulic hammers (no monitor):0.80 Power assisted hydraulic hammers:0.80 (uncertainty of fall height, alignment, friction, power assist) If not measured, fall height must be assumed and can be quite variable – be cautious !
 Hydraulic hammers (no monitor):0.80 Power assisted hydraulic hammers:0.80 (uncertainty of fall height, alignment, friction, power assist) If not measured, fall height must be assumed and can be quite variable – be cautious !")
39
VIBRATORY HAMMER MODEL

40
FLFLFLFL FLFLFLFL FVFVFVFV FVFVFVFV m1m1m1m1 m1m1m1m1 m2m2m2m2 m2m2m2m2 Bias Mass with Line Force Connecting Pads Oscillator with eccentric masses, m e, radii, r e and clamp

41
VIBRATORY HAMMER MODEL 2-mass system with vibratory force F V = m e 2 r e sin t F V = m e 2 r e sin t F V = m e [ω 2 r e sinωt - 2 (t)] 2-mass system with vibratory force F V = m e 2 r e sin t F V = m e 2 r e sin t F V = m e [ω 2 r e sinωt - 2 (t)] FLFLFLFL FLFLFLFL FVFVFVFV FVFVFVFV m1m1m1m1 m1m1m1m1 m2m2m2m2 m2m2m2m2 Bias Mass with Line Force Connecting Pads Oscillator with eccentric masses, m e, radii, r e and clamp
![VIBRATORY HAMMER MODEL 2-mass system with vibratory force F V = m e 2 r e sin t F V = m e 2 r e sin t F V = m e [ω 2 r e sinωt - 2 (t)] 2-mass system with vibratory force F V = m e 2 r e sin t F V = m e 2 r e sin t F V = m e [ω 2 r e sinωt - 2 (t)] FLFLFLFL FLFLFLFL FVFVFVFV FVFVFVFV m1m1m1m1 m1m1m1m1 m2m2m2m2 m2m2m2m2 Bias Mass with Line Force Connecting Pads Oscillator with eccentric masses, m e, radii, r e and clamp](http://images.slideplayer.com/14/4312724/slides/slide_41.jpg "VIBRATORY HAMMER MODEL 2-mass system with vibratory force F V = m e 2 r e sin t F V = m e 2 r e sin t F V = m e [ω 2 r e sinωt - 2 (t)] 2-mass system with vibratory force F V = m e 2 r e sin t F V = m e 2 r e sin t F V = m e [ω 2 r e sinωt - 2 (t)] FLFLFLFL FLFLFLFL FVFVFVFV FVFVFVFV m1m1m1m1 m1m1m1m1 m2m2m2m2 m2m2m2m2 Bias Mass with Line Force Connecting Pads Oscillator with eccentric masses, m e, radii, r e and clamp")
42
GRLWEAP Hammer data file

43
Pile: Masses and Springs Pile: Soil: Elasto-Plastic Springs and Dashpots Soil: Hammer: (Masses and Springs) Hammer: Driving System: Cushions (Springs) Helmet (Mass) Driving System: Cushions (Springs) Helmet (Mass) Hammer-Driving System-Pile-Soil Model
 Hammer: Driving System: Cushions (Springs) Helmet (Mass) Driving System: Cushions (Springs) Helmet (Mass) Hammer-Driving System-Pile-Soil Model")
44
Driving System Modeling The Driving Systems Consists of –Helmet including inserts to align hammer and pile –Hammer Cushion to protect hammer –Pile Cushion to protect concrete piles The Driving Systems Consists of –Helmet including inserts to align hammer and pile –Hammer Cushion to protect hammer –Pile Cushion to protect concrete piles

45
GRLWEAP Driving System Help

47
GRLWEAP Pile Model To make realistic calculations possible The pile is divided into N segments – –of approximate length ∆L = 1 m (3.3 ft) – –with mass m = ρ A ∆L – –and stiffnessk = E A / ∆L – –there are N = L / ∆L pile segments Divide time into intervals (typically 0.1 ms) To make realistic calculations possible The pile is divided into N segments – –of approximate length ∆L = 1 m (3.3 ft) – –with mass m = ρ A ∆L – –and stiffnessk = E A / ∆L – –there are N = L / ∆L pile segments Divide time into intervals (typically 0.1 ms)
 – –with mass m = ρ A ∆L – –and stiffnessk = E A / ∆L – –there are N = L / ∆L pile segments Divide time into intervals (typically 0.1 ms) To make realistic calculations possible The pile is divided into N segments – –of approximate length ∆L = 1 m (3.3 ft) – –with mass m = ρ A ∆L – –and stiffnessk = E A / ∆L – –there are N = L / ∆L pile segments Divide time into intervals (typically 0.1 ms)")
48
Computational Time Increment, ∆t ∆t is a fraction (e.g. ½ ) of the critical time, which is ∆L/c t cr ∆t cr L∆LL∆L L/c ∆t∆t Time Length
 of the critical time, which is ∆L/c t cr ∆t cr L∆LL∆L L/c ∆t∆t Time Length.")
49
Time Increment Time Increment must be a fraction of the critical time increment for numerical stabilityTime Increment must be a fraction of the critical time increment for numerical stability Typically, the time increment is ½ of the critical valueTypically, the time increment is ½ of the critical value Soil resistance has to be considered when calculating the critical time incrementSoil resistance has to be considered when calculating the critical time increment Hammer segments are often criticalHammer segments are often critical

50
Driving system model (Concrete piles) Pile Cushion + Pile Top: Spring + Dashpot Helmet + Inserts Hammer Cushion: Spring plus Dashpot
 Pile Cushion + Pile Top: Spring + Dashpot Helmet + Inserts Hammer Cushion: Spring plus Dashpot")
51
Non-linear springs Springs at material interfaces Hammer interface springs CushionsHelmet/Pile Splices with slacks Hammer interface springs CushionsHelmet/Pile Splices with slacks

52
Non-linear (cushion) springs ParametersParameters Stiffness, k = EA/tStiffness, k = EA/t Coefficient of Restitution, CORCoefficient of Restitution, COR Round-out deformation,δ r, or compressive slackRound-out deformation,δ r, or compressive slack Tension slack, δ sTension slack, δ s ParametersParameters Stiffness, k = EA/tStiffness, k = EA/t Coefficient of Restitution, CORCoefficient of Restitution, COR Round-out deformation,δ r, or compressive slackRound-out deformation,δ r, or compressive slack Tension slack, δ sTension slack, δ s δrδrδrδr δrδrδrδr k / COR 2 k δsδsδsδs δsδsδsδs Compressive Deformation Compressive Force
 springs ParametersParameters Stiffness, k = EA/tStiffness, k = EA/t Coefficient of Restitution, CORCoefficient of Restitution, COR Round-out deformation,δ r, or compressive slackRound-out deformation,δ r, or compressive slack Tension slack, δ sTension slack, δ s ParametersParameters Stiffness, k = EA/tStiffness, k = EA/t Coefficient of Restitution, CORCoefficient of Restitution, COR Round-out deformation,δ r, or compressive slackRound-out deformation,δ r, or compressive slack Tension slack, δ sTension slack, δ s δrδrδrδr δrδrδrδr k / COR 2 k δsδsδsδs δsδsδsδs Compressive Deformation Compressive Force")
53
Material Modulus (ksi) Aluminum Micarta 350 Conbest280 Hamortex125 Nylon175-200 Material Modulus (ksi) Plywood 30 new 75 used Oak (transverse) 60 Oak (parallel) 750 Hammer cushion Pile cushion
 Aluminum Micarta 350 Conbest280 Hamortex125 Nylon Material Modulus (ksi) Plywood 30 new 75 used Oak (transverse) 60 Oak (parallel) 750 Hammer cushion Pile cushion")
54
∆L= L/N 1m Mass density, Modulus, E X-Area, A Spring (static resistance) Dashpot (dynamic resist) Mass m i Stiffness k i The Pile and Soil Model
 Dashpot (dynamic resist) Mass m i Stiffness k i The Pile and Soil Model")
55
Soil Resistance Soil resistance slows pile movement and causes pile reboundSoil resistance slows pile movement and causes pile rebound A very slowly moving pile only encounters static resistanceA very slowly moving pile only encounters static resistance A rapidly moving pile also encounters dynamic resistanceA rapidly moving pile also encounters dynamic resistance The static resistance to driving may differ from the soil resistance under static loadsThe static resistance to driving may differ from the soil resistance under static loads –Pore pressure effects –Lateral movements –Plugging for open profiles –Etc. Soil resistance slows pile movement and causes pile reboundSoil resistance slows pile movement and causes pile rebound A very slowly moving pile only encounters static resistanceA very slowly moving pile only encounters static resistance A rapidly moving pile also encounters dynamic resistanceA rapidly moving pile also encounters dynamic resistance The static resistance to driving may differ from the soil resistance under static loadsThe static resistance to driving may differ from the soil resistance under static loads –Pore pressure effects –Lateral movements –Plugging for open profiles –Etc.

56
The Soil Model Segment Segmenti-1 i k i-1,R ui-1 J i-1 Segment Segmenti+1 k i,R ui JiJiJiJi k i+1,R ui+1 J i+1 RIGID SOIL SURROUNDING SOIL/PILE INTERFACE RIGID SOIL SURROUNDING SOIL/PILE INTERFACE

57
Smith’s Soil Model Total Soil Resistance R total = R si +R di Segment Segmenti uiuiviviuiuivivi Fixed

58
Rigid plastic slider with Resistance R ui Rigid plastic slider with Resistance R ui Elastic spring with max. compression q (quake) Fixed reference uiuiuiui R ui R si k si = R ui /q i 1 quake, q i Static Shaft Resistance Model Parameters R ui, q i
 Fixed reference uiuiuiui R ui R si k si = R ui /q i 1 quake, q i Static Shaft Resistance Model Parameters R ui, q i.")
59
Shaft Resistance and Quake qiqiqiqi R ui qiqiqiqi R si uiuiuiui -R ui Recommended Shaft Quake ( q i ) 2.5 mm; 0.1 inches
 2.5 mm; 0.1 inches")
60
Shaft Resistance and Quake qiqiqiqi R ui qiqiqiqi R si uiuiuiui -R ui Recommended Shaft Quake: 2.5 mm; 0.1 inches

61
The Static Toe Resistance and Quake qiqiqiqi R ui qiqiqiqi R si uiuiuiui For vibratory hammers For normal impact hammers Recommended Toe Quake: 1 mm: hard rock 2.5 mm Non-displacement piles D/120 to D/60 for Displacement Piles

62
Recommended Toe Quakes, q t 0.1” or 2.5 mm 0.04” or 1 mm on hard rock qtqtqtqt R qtqtqtqt R ut u D/120: very dense/hard soils D/60: softer/loose soils Displacement piles Non-displacement piles D

63
Smith’s Soil Damping Model (Shaft or Toe) PileSegment Smith damping factor, J s [s/m or s/ft] R d = R s J s v Fixed reference (soil around pile) velocity v R d = R u J s v Smith-viscous damping factor J svi [s/m or s/ft] dashpot
![Smith’s Soil Damping Model (Shaft or Toe) PileSegment Smith damping factor, J s [s/m or s/ft] R d = R s J s v Fixed reference (soil around pile) velocity v R d = R u J s v Smith-viscous damping factor J svi [s/m or s/ft] dashpot](http://images.slideplayer.com/14/4312724/slides/slide_63.jpg "Smith’s Soil Damping Model (Shaft or Toe) PileSegment Smith damping factor, J s [s/m or s/ft] R d = R s J s v Fixed reference (soil around pile) velocity v R d = R u J s v Smith-viscous damping factor J svi [s/m or s/ft] dashpot")
64
Alternative Soil Models Coyle-Gibson Results (1968) Sand Clay
 Sand Clay")
65
Recommended damping factors after Smith Shaft Clay:0.65 s/mor 0.20 s/ft Sand:0.16 s/m or 0.05 s/ft Silts:use an intermediate value Layered soils: use a weighted average Shaft Clay:0.65 s/mor 0.20 s/ft Sand:0.16 s/m or 0.05 s/ft Silts:use an intermediate value Layered soils: use a weighted average Toe All soils: 0.50 s/mor 0.15 s/ft

66
Numerical treatment: Force balance at a segment Acceleration: a i = (F i – F i+1 + W i – R i ) / m i Velocity, v i, and Displacement, u i, from Integration Acceleration: a i = (F i – F i+1 + W i – R i ) / m i Velocity, v i, and Displacement, u i, from Integration Mass m i Force from upper spring, F i Force from lower spring, F i+1 Resistance force, R i (static plus damping) Weight, W i
 / m i Velocity, v i, and Displacement, u i, from Integration Acceleration: a i = (F i – F i+1 + W i – R i ) / m i Velocity, v i, and Displacement, u i, from Integration Mass m i Force from upper spring, F i Force from lower spring, F i+1 Resistance force, R i (static plus damping) Weight, W i")
67
Numerical Treatment Integration v ni = v oi + ½ (a oi + a ni ) t Time to to to to t o + t t o + t anananan vnvnvnvn unununun uouououo vovovovo aoaoaoao a, v, u u ni = u oi + v oi t + (a oi + a ni ) t 2 / 6
 t Time to to to to t o + t t o + t anananan vnvnvnvn unununun uouououo vovovovo aoaoaoao a, v, u u ni = u oi + v oi t + (a oi + a ni ) t 2 / 6")
68
Calculate displacements: u ni = u oi + v oi t Calculate spring displacement: c i = u ni - u ni-1 Calculate spring forces: F i = k i c i k = EA / ΔL k = EA / ΔL Calculate displacements: u ni = u oi + v oi t Calculate spring displacement: c i = u ni - u ni-1 Calculate spring forces: F i = k i c i k = EA / ΔL k = EA / ΔL u ni-1 mimimimi m i+1 m i-1 u ni u ni+1 F i, c i Wave Equation Analysis calculates displacement of all points of a pile as function of time.

69
Set or Blow Count Calculation from Extrapolated toe displacement RR SetSet Final Set Maximum Set QuakeQuake RuRuRuRu RuRuRuRu ExtrapolatedExtrapolated CalculatedCalculated

70
Blow Count Calculation Once pile toe rebounds, max toe displacement is known, example: 0.3 inch or 7.5 mmOnce pile toe rebounds, max toe displacement is known, example: 0.3 inch or 7.5 mm Final Set= Max Toe Displacement – Quake = 0.3 – 0.1 = 0.2 inchFinal Set= Max Toe Displacement – Quake = 0.3 – 0.1 = 0.2 inch = 7.5 - 2.5 = 5 mm “Blow Count” is Inverse of “Final Set”“Blow Count” is Inverse of “Final Set” BCT = 12 / 0.2 = 60 Bl / ft BCT = 12 / 0.2 = 60 Bl / ft BCT = 1000 / 5 = 200 Bl / m BCT = 1000 / 5 = 200 Bl / m Once pile toe rebounds, max toe displacement is known, example: 0.3 inch or 7.5 mmOnce pile toe rebounds, max toe displacement is known, example: 0.3 inch or 7.5 mm Final Set= Max Toe Displacement – Quake = 0.3 – 0.1 = 0.2 inchFinal Set= Max Toe Displacement – Quake = 0.3 – 0.1 = 0.2 inch = 7.5 - 2.5 = 5 mm “Blow Count” is Inverse of “Final Set”“Blow Count” is Inverse of “Final Set” BCT = 12 / 0.2 = 60 Bl / ft BCT = 12 / 0.2 = 60 Bl / ft BCT = 1000 / 5 = 200 Bl / m BCT = 1000 / 5 = 200 Bl / m

71
Set or Blow Count Calculation from Extrapolated toe displacement RR SetSet Final Set Maximum Set QuakeQuake RuRuRuRu RuRuRuRu ExtrapolatedExtrapolated CalculatedCalculated

72
External Combustion Hammer Procedure Dynamic analysis ends whenDynamic analysis ends when –Pile toe has rebounded to 80% of max d –Pile has penetrated more than 4 inches –Pile toe has rebounded to 98% and energy in pile is essentially dissipated Dynamic analysis ends whenDynamic analysis ends when –Pile toe has rebounded to 80% of max d –Pile has penetrated more than 4 inches –Pile toe has rebounded to 98% and energy in pile is essentially dissipated

73
Alternative Blow Count Calculation by RSA Residual Stress Analysis is also called Multiple Blow AnalysisResidual Stress Analysis is also called Multiple Blow Analysis Analyzes several blows consecutively with initial stresses, displacements from static state at end of previous blowAnalyzes several blows consecutively with initial stresses, displacements from static state at end of previous blow Yields residual stresses in pile at end of blow; generally lower blow countsYields residual stresses in pile at end of blow; generally lower blow counts Residual Stress Analysis is also called Multiple Blow AnalysisResidual Stress Analysis is also called Multiple Blow Analysis Analyzes several blows consecutively with initial stresses, displacements from static state at end of previous blowAnalyzes several blows consecutively with initial stresses, displacements from static state at end of previous blow Yields residual stresses in pile at end of blow; generally lower blow countsYields residual stresses in pile at end of blow; generally lower blow counts

74
RESIDUAL STRESS OPTION BETWEEN HAMMER BLOWS, PILE AND SOIL STORE ENERGY Set for 2 Blows Convergence: Consecutive Blows have same pile compression/sets

75
COMPUTATIONAL PROCEDURE Smith’s Bearing Graph Analyze for a range of capacitiesAnalyze for a range of capacities –In: Static resistance distribution assumed –Out: Pile static capacity vs. blow count –Out: Critical driving stresses vs. blow count –Out: Stroke for diesel hammers vs. blow count Analyze for a range of capacitiesAnalyze for a range of capacities –In: Static resistance distribution assumed –Out: Pile static capacity vs. blow count –Out: Critical driving stresses vs. blow count –Out: Stroke for diesel hammers vs. blow count

76
Bearing Graph: Required Blow Count For required capacity Find minimum blow count

77
Bearing Graph: Capacity Determination Find indicated capacity For observed blow count

78
Static Analysis Ram velocity Dynamic analysis Static Analysis Ram velocity Dynamic analysis Program Flow – Bearing Graph Model hammer & driving system Model hammer & driving system Model Pile Pile stresses Pile stresses Energy transfer Energy transfer Pile velocities Pile velocities Pile stresses Pile stresses Energy transfer Energy transfer Pile velocities Pile velocities Choose first Ru Calculate Blow Count Count Distribute Ru Distribute Ru Set Soil Constants Time Increment Distribute Ru Distribute Ru Set Soil Constants Time Increment Output Output Increase R u ? R u ?Increase Increase Ru Increase Ru Input Input N

79
Static Analysis Ram velocity Static Analysis Ram velocity Program Flow – Bearing Graph Model hammer & driving system Model hammer & driving system Model Pile Dynamic Analysis Dynamic Analysis Pile stresses Pile stresses Energy transfer Energy transfer Pile velocities Pile velocities Dynamic Analysis Dynamic Analysis Pile stresses Pile stresses Energy transfer Energy transfer Pile velocities Pile velocities Choose first Ru Calculate Blow Count Count Distribute Ru Distribute Ru Set Soil Constants Time Increment Distribute Ru Distribute Ru Set Soil Constants Time Increment Output Output Increase R u ? R u ?Increase Increase Ru Increase Ru Input Input N

80
HP 12x53; Clay/Sand Bearing Graph; D19-42 SI-Units

81
PURPOSE OF ANALYSIS Preliminary Equipment SelectionPreliminary Equipment Selection –Hammer OK for Pile, Capacity –Includes stress check Driving CriterionDriving Criterion –Blow Count for Capacity and Stroke Preliminary Equipment SelectionPreliminary Equipment Selection –Hammer OK for Pile, Capacity –Includes stress check Driving CriterionDriving Criterion –Blow Count for Capacity and Stroke

82
OUTPUT REVIEW Blow Counts Satisfactory?Blow Counts Satisfactory? Stresses Less Than Allowable?Stresses Less Than Allowable? Economical Hammer, Pile?Economical Hammer, Pile? If not, consider reanalyzing with different hammer system, pile size. Blow Counts Satisfactory?Blow Counts Satisfactory? Stresses Less Than Allowable?Stresses Less Than Allowable? Economical Hammer, Pile?Economical Hammer, Pile? If not, consider reanalyzing with different hammer system, pile size.

83
OK Bad INSPECTOR’S CHART Constant capacity – analyze with variable energy or stroke

84
Question for Driveability: WHAT IS R U DURING DRIVING? We call it Static Resistance to Driving (SRD), because we lose shaft resistance during driving.We call it Static Resistance to Driving (SRD), because we lose shaft resistance during driving.
, because we lose shaft resistance during driving.We call it Static Resistance to Driving (SRD), because we lose shaft resistance during driving..")
85
Question for Driveability: WHAT IS R U DURING DRIVING? We call it Static Resistance to Driving (SRD), because we lose shaft resistance during driving.We call it Static Resistance to Driving (SRD), because we lose shaft resistance during driving. Will we regain resistance by Soil Set-up primarily along shaft (may be 10 x in clay)Will we regain resistance by Soil Set-up primarily along shaft (may be 10 x in clay) Driveability requires analyze with full loss of set-up (or with partial loss of set-up for a short driving interruption)Driveability requires analyze with full loss of set-up (or with partial loss of set-up for a short driving interruption) We call it Static Resistance to Driving (SRD), because we lose shaft resistance during driving.We call it Static Resistance to Driving (SRD), because we lose shaft resistance during driving. Will we regain resistance by Soil Set-up primarily along shaft (may be 10 x in clay)Will we regain resistance by Soil Set-up primarily along shaft (may be 10 x in clay) Driveability requires analyze with full loss of set-up (or with partial loss of set-up for a short driving interruption)Driveability requires analyze with full loss of set-up (or with partial loss of set-up for a short driving interruption)
, because we lose shaft resistance during driving.We call it Static Resistance to Driving (SRD), because we lose shaft resistance during driving. Will we regain resistance by Soil Set-up primarily along shaft (may be 10 x in clay)Will we regain resistance by Soil Set-up primarily along shaft (may be 10 x in clay) Driveability requires analyze with full loss of set-up (or with partial loss of set-up for a short driving interruption)Driveability requires analyze with full loss of set-up (or with partial loss of set-up for a short driving interruption) We call it Static Resistance to Driving (SRD), because we lose shaft resistance during driving.We call it Static Resistance to Driving (SRD), because we lose shaft resistance during driving. Will we regain resistance by Soil Set-up primarily along shaft (may be 10 x in clay)Will we regain resistance by Soil Set-up primarily along shaft (may be 10 x in clay) Driveability requires analyze with full loss of set-up (or with partial loss of set-up for a short driving interruption)Driveability requires analyze with full loss of set-up (or with partial loss of set-up for a short driving interruption).")
86
Set-up factors Thendean, G., Rausche, F., Svinkin, M., Likins, G. E., September, 1996. Wave Equation Correlation Studies. Proceedings of the Fifth International Conference on the Application of Stress-wave Theory to Piles 1996: Orlando, FL; 144-162.

87
For Driveability with variable setup time Setup factor, SFSetup factor, SF Setup timeSetup time Setup factor, SFSetup factor, SF Setup timeSetup timeRu Time Ru/SF Setup Time

88
For Driveability with variable setup time Setup factor, SFSetup factor, SF Setup timeSetup time Setup factor, SFSetup factor, SF Setup timeSetup timeRu Time Ru/SF Setup Time Remolding Energy Ru/SF Ru Energy Remolding energyRemolding energy

89
Ru Ru/SF Driving Time Set-up Time Waiting Time Remolding energy Re-Drive Ru/SF Set-up factor, SFSet-up factor, SF For Driveability: Static capacity changes Capacity increases (Set-up) after driving stopsCapacity increases (Set-up) after driving stops Capacity decreases (Remolds) during redriveCapacity decreases (Remolds) during redrive
 after driving stopsCapacity increases (Set-up) after driving stops Capacity decreases (Remolds) during redriveCapacity decreases (Remolds) during redrive")
90
AnalysisAnalysis Program Flow – Driveability Model hammer & driving system Model hammer & driving system First depth of analysis - soil model - - soil model - First depth of analysis - soil model - - soil model - Next G/L Next G/L Pile length and model model Pile length and model model Calculate Ru Calculate Ru for first gain/loss Calculate Ru Calculate Ru for first gain/loss Output Output Increase Depth? Depth?Increase Increase Depth Increase Depth Input Input Increase G/L? G/L?Increase N N

91
AnalysisAnalysis Program Flow – Driveability Model hammer & driving system Model hammer & driving system First depth of analysis analysis Next G/L Next G/L Pile length and model model Pile length and model model Calculate Ru Calculate Ru for first gain/loss Calculate Ru Calculate Ru for first gain/loss Output Output Increase Depth? Depth?Increase Increase Depth Increase Depth Input Input Increase G/L? G/L?Increase N N

92
COMPUTATIONAL PROCEDURE Driveability Analysis Analysis as the pile is penetratedAnalysis as the pile is penetrated –Input capacity with depth (static analysis) Generates a driving recordGenerates a driving record –Predicts blow count with depth –Stresses, (diesel stroke), with depth Analysis as the pile is penetratedAnalysis as the pile is penetrated –Input capacity with depth (static analysis) Generates a driving recordGenerates a driving record –Predicts blow count with depth –Stresses, (diesel stroke), with depth
 Generates a driving recordGenerates a driving record –Predicts blow count with depth –Stresses, (diesel stroke), with depth Analysis as the pile is penetratedAnalysis as the pile is penetrated –Input capacity with depth (static analysis) Generates a driving recordGenerates a driving record –Predicts blow count with depth –Stresses, (diesel stroke), with depth")
93
Static Soil Analysis Approximate for Bearing Graph: Approximate for Bearing Graph: –Percent Shaft Resistance –Resistance Distribution Detailed for Driveability Detailed for Driveability –Shaft Resistance vs Depth –End Bearing vs Depth –Set-up Factor Approximate for Bearing Graph: Approximate for Bearing Graph: –Percent Shaft Resistance –Resistance Distribution Detailed for Driveability Detailed for Driveability –Shaft Resistance vs Depth –End Bearing vs Depth –Set-up Factor

94
DriveabilityDriveability

95
PURPOSE OF ANALYSIS Preliminary Equipment SelectionPreliminary Equipment Selection –Hammer OK for Pile, Capacity Driving CriterionDriving Criterion –Blow Count for Capacity and stroke DriveabilityDriveability –Acceptable Blow Count throughout –Acceptable Stresses throughout Preliminary Equipment SelectionPreliminary Equipment Selection –Hammer OK for Pile, Capacity Driving CriterionDriving Criterion –Blow Count for Capacity and stroke DriveabilityDriveability –Acceptable Blow Count throughout –Acceptable Stresses throughout

96
Pile Driving and Equipment Data Form RamRam Anvil

97
Required Input Data HammerHammer –Model –Energy level (stroke) Driving systemDriving system –Hammer cushion material (E, A), thickness –Helmet weight (of entire assembly) –Pile cushion material (E, A), thickness (for concrete piles only) HammerHammer –Model –Energy level (stroke) Driving systemDriving system –Hammer cushion material (E, A), thickness –Helmet weight (of entire assembly) –Pile cushion material (E, A), thickness (for concrete piles only)
 Driving systemDriving system –Hammer cushion material (E, A), thickness –Helmet weight (of entire assembly) –Pile cushion material (E, A), thickness (for concrete piles only) HammerHammer –Model –Energy level (stroke) Driving systemDriving system –Hammer cushion material (E, A), thickness –Helmet weight (of entire assembly) –Pile cushion material (E, A), thickness (for concrete piles only)")
98
Required Input Data Soil (from Borings with elevations)Soil (from Borings with elevations) –Type of soils –N-values vs depth or other strength parameters –Elevation of water table Soil (from Borings with elevations)Soil (from Borings with elevations) –Type of soils –N-values vs depth or other strength parameters –Elevation of water table
Soil (from Borings with elevations) –Type of soils –N-values vs depth or other strength parameters –Elevation of water table Soil (from Borings with elevations)Soil (from Borings with elevations) –Type of soils –N-values vs depth or other strength parameters –Elevation of water table")
99
Data Entry Resistance distributionResistance distribution SimpleSimple From soil input wizardFrom soil input wizard For driveabilityFor driveability Soil properties vs depth:Soil properties vs depth: Shaft unit resistance – requires calculationShaft unit resistance – requires calculation End bearing - requires calculationEnd bearing - requires calculation Quakes and dampingQuakes and damping Set-up factorSet-up factor Analysis depthsAnalysis depths Resistance distributionResistance distribution SimpleSimple From soil input wizardFrom soil input wizard For driveabilityFor driveability Soil properties vs depth:Soil properties vs depth: Shaft unit resistance – requires calculationShaft unit resistance – requires calculation End bearing - requires calculationEnd bearing - requires calculation Quakes and dampingQuakes and damping Set-up factorSet-up factor Analysis depthsAnalysis depths

100
Available Help - Indirect

101
GRLWEAP Help – Direct : F3 Area calculator from any area input field.

102
ResultsResults Output Options:Output Options: Bearing Graph Bearing Graph Proportional shaft resistance/end bearingProportional shaft resistance/end bearing Constant shaft resistanceConstant shaft resistance Constant end bearingConstant end bearing Inspector’s Chart Inspector’s Chart Blow count versus stroke for one RuBlow count versus stroke for one Ru Driveability Driveability Output Options:Output Options: Bearing Graph Bearing Graph Proportional shaft resistance/end bearingProportional shaft resistance/end bearing Constant shaft resistanceConstant shaft resistance Constant end bearingConstant end bearing Inspector’s Chart Inspector’s Chart Blow count versus stroke for one RuBlow count versus stroke for one Ru Driveability Driveability

103
Final Recommendation Perform sensitivity studies on parameters Perform sensitivity studies on parameters Plot upper and lower bound Plot upper and lower bound results Note: low hammer efficiency not always conservative Note: low hammer efficiency not always conservative Read the helps and disclaimers Read the helps and disclaimers On screen or after printing themOn screen or after printing them Compare results with dynamic testing Compare results with dynamic testing

104
SummarySummary There are 3 distinctly different hammer modelsThere are 3 distinctly different hammer models –External Combustion Hammer models –Diesel hammer and pressure models –Vibratory hammer model There are 3 components in driving system modelThere are 3 components in driving system model –Hammer Cushion –Helmet and Inserts –Pile Cushion (concrete piles only) Model Parameters can be found in GRLWEAP Help Section or Hammer data file.Model Parameters can be found in GRLWEAP Help Section or Hammer data file. There are 3 distinctly different hammer modelsThere are 3 distinctly different hammer models –External Combustion Hammer models –Diesel hammer and pressure models –Vibratory hammer model There are 3 components in driving system modelThere are 3 components in driving system model –Hammer Cushion –Helmet and Inserts –Pile Cushion (concrete piles only) Model Parameters can be found in GRLWEAP Help Section or Hammer data file.Model Parameters can be found in GRLWEAP Help Section or Hammer data file.
 Model Parameters can be found in GRLWEAP Help Section or Hammer data file.Model Parameters can be found in GRLWEAP Help Section or Hammer data file..")
105
SUMMARY continued The wave equation analysis works with “Static Resistance to Driving” (SRD) plus a Damping or Dynamic ResistanceThe wave equation analysis works with “Static Resistance to Driving” (SRD) plus a Damping or Dynamic Resistance Important analysis options include:Important analysis options include: –Bearing Graph –Inspector’s Chart –Driveability Graph The whole package is geared towards standard analyses; some research options existThe whole package is geared towards standard analyses; some research options exist The wave equation analysis works with “Static Resistance to Driving” (SRD) plus a Damping or Dynamic ResistanceThe wave equation analysis works with “Static Resistance to Driving” (SRD) plus a Damping or Dynamic Resistance Important analysis options include:Important analysis options include: –Bearing Graph –Inspector’s Chart –Driveability Graph The whole package is geared towards standard analyses; some research options existThe whole package is geared towards standard analyses; some research options exist
 plus a Damping or Dynamic ResistanceThe wave equation analysis works with Static Resistance to Driving (SRD) plus a Damping or Dynamic Resistance Important analysis options include:Important analysis options include: –Bearing Graph –Inspector’s Chart –Driveability Graph The whole package is geared towards standard analyses; some research options existThe whole package is geared towards standard analyses; some research options exist The wave equation analysis works with Static Resistance to Driving (SRD) plus a Damping or Dynamic ResistanceThe wave equation analysis works with Static Resistance to Driving (SRD) plus a Damping or Dynamic Resistance Important analysis options include:Important analysis options include: –Bearing Graph –Inspector’s Chart –Driveability Graph The whole package is geared towards standard analyses; some research options existThe whole package is geared towards standard analyses; some research options exist")
106
Summary: W.E. APPLICATIONS Design stageDesign stage –Preliminary hammer selection –Selection of pile section for driveability –Selection of material strength for driving Construction stageConstruction stage –Hammer system approval –Contractors use to select equipment –One means of estimating blow count –Inspector’s chart for variable hammer stroke Design stageDesign stage –Preliminary hammer selection –Selection of pile section for driveability –Selection of material strength for driving Construction stageConstruction stage –Hammer system approval –Contractors use to select equipment –One means of estimating blow count –Inspector’s chart for variable hammer stroke

107
Summary: Purpose of analysis Develop driving criterion Final Set (Blow count) for a required capacity Final Set as a function of energy/stroke Check driveability Final Set (Blow Count) vs. depth Stresses vs. depth Optimal equipment To Minimize Driving Time Develop driving criterion Final Set (Blow count) for a required capacity Final Set as a function of energy/stroke Check driveability Final Set (Blow Count) vs. depth Stresses vs. depth Optimal equipment To Minimize Driving Time
 for a required capacity Final Set as a function of energy/stroke Check driveability Final Set (Blow Count) vs. depth Stresses vs. depth Optimal equipment To Minimize Driving Time.")
108
78 active slides

Similar presentations


 of representative samples or strength parameters or slope.>")


