Download presentation
Presentation is loading. Please wait.

2
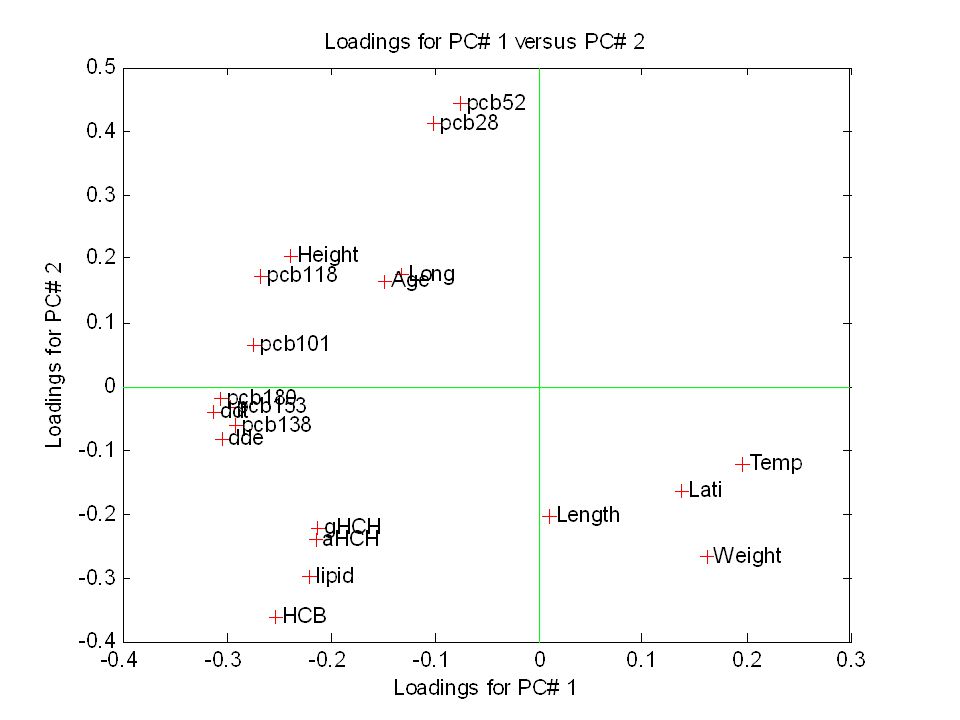
lipid Weight Length Age Height Temp Lati Long HCB aHCH gHCH dde ddt pcb28 pcb52 pcb101 pcb118 pcb138 pcb153 pcb180 1 2 3 4 5 6 7 8 9 10 11 12 13 14 15 16 17 18 19 20 Loadings

3
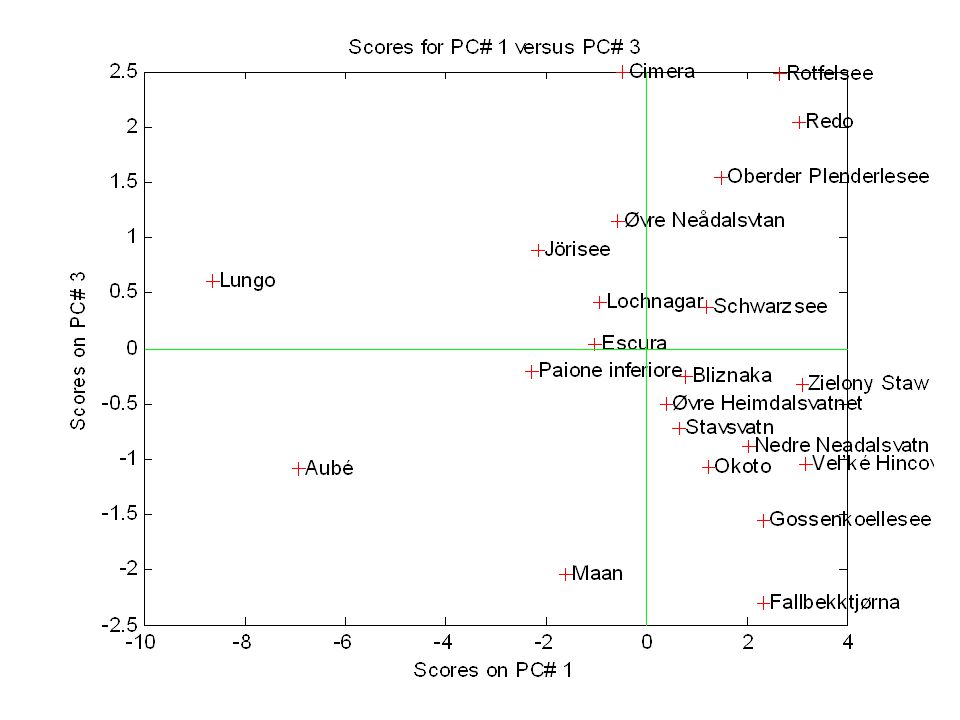
Øvre Neådalsvtan Fallbekktjørna Nedre Neadalsvatn Øvre Heimdalsvatnet Stavsvatn Lochnagar Maan Zielony Staw Gasienicowy Vel’ké Hincovo Gossenkoellesee Rotfelsee Oberder Plenderlesee Schwarzsee Lungo Jörisee Paione inferiore Aubé Redo Okoto Bliznaka Cimera Escura 1 2 3 4 5 6 7 8 9 10 11 12 13 14 15 16 17 18 19 20 21 22 23 24 Scores

4
nscores(:,1)=scores(:,1)./norm(scores(:,1),2); nscores(:,2)=scores(:,2)./norm(scores(:,2),2); plot(loads(:,1),loads(:,2),'ob') hold plot(nscores(:,1),nscores(:,2),'+r') vline(0) hline(0) text(nscores(:,1),nscores(:,2),lakenames(:,1:3)); text(loads(:,1),loads(:,2),namevarall); grid on
=scores(:,1)./norm(scores(:,1),2); nscores(:,2)=scores(:,2)./norm(scores(:,2),2); plot(loads(:,1),loads(:,2), ob ) hold plot(nscores(:,1),nscores(:,2), +r ) vline(0) hline(0) text(nscores(:,1),nscores(:,2),lakenames(:,1:3)); text(loads(:,1),loads(:,2),namevarall); grid on")
7
nscores(:,1)=scores(:,1)./norm(scores(:,1),2); nscores(:,2)=scores(:,2)./norm(scores(:,2),2); plot(loads(:,1),loads(:,2),'ob') hold plot(nscores(:,1),nscores(:,2),'+r') vline(0) hline(0) text(nscores(:,1),nscores(:,2),lakenames(:,1:3)); text(loads(:,1),loads(:,2),namevarall); grid on
=scores(:,1)./norm(scores(:,1),2); nscores(:,2)=scores(:,2)./norm(scores(:,2),2); plot(loads(:,1),loads(:,2), ob ) hold plot(nscores(:,1),nscores(:,2), +r ) vline(0) hline(0) text(nscores(:,1),nscores(:,2),lakenames(:,1:3)); text(loads(:,1),loads(:,2),namevarall); grid on")
8
scores with norm 2

9
scores with norm 1

10
biplot(loads(:,1:2), 'scores',scores(:,1:2), 'varlabels',namevarall(:,1:3), 'ObsLabels', lakenames);
, scores ,scores(:,1:2), varlabels ,namevarall(:,1:3), ObsLabels , lakenames);")
15
y=meanpcb180 xo=meanvar; axo=auto(x); ay=auto(y); [b,ssq,p,q,w,t,u,bin] = pls(axo,ay,5,1); vip_scores = vipr(t(:,1),p(:,1),w(:,1),b(1,:)',1,8,namevarpar);
![y=meanpcb180 xo=meanvar; axo=auto(x); ay=auto(y); [b,ssq,p,q,w,t,u,bin] = pls(axo,ay,5,1); vip_scores = vipr(t(:,1),p(:,1),w(:,1),b(1,:) ,1,8,namevarpar);](http://images.slideplayer.com/14/4307332/slides/slide_15.jpg "y=meanpcb180 xo=meanvar; axo=auto(x); ay=auto(y); [b,ssq,p,q,w,t,u,bin] = pls(axo,ay,5,1); vip_scores = vipr(t(:,1),p(:,1),w(:,1),b(1,:) ,1,8,namevarpar);")
16
b with 1 PLS components y=meanpcb180

17
weights with 1 PLS components

18
VIP with 1 PLS components

19
VIP with 2 PLS components

20
[press,cumpress]=crossval(axo,ay,'sim','loo',5); Percent Variance Captured by PLS Model -----X-Block----- -----Y-Block----- LV # This LV Total This LV Total ---- ------- ------- ------- ------- 1 35.98 35.98 61.20 61.20 2 8.84 44.82 15.90 77.10 3 14.86 59.67 1.78 78.88 4 11.85 71.52 0.60 79.48 5 9.77 81.29 0.13 79.61
![[press,cumpress]=crossval(axo,ay, sim , loo ,5); Percent Variance Captured by PLS Model -----X-Block Y-Block----- LV # This LV Total This LV Total](http://images.slideplayer.com/14/4307332/slides/slide_20.jpg "[press,cumpress]=crossval(axo,ay, sim , loo ,5); Percent Variance Captured by PLS Model -----X-Block Y-Block----- LV # This LV Total This LV Total")
Similar presentations


FREQUENCY 52-530.5 53-541.5 54-551 55-562 56-576.5 57-5818 58-5934.5 59-6079.5.>")


 Penny Barge Design>")
![>> [ax,mx,stdx]=auto(x); >> [scores,loads,ssq,res,reslm,tsqlm,tsq] = pca(ax,1,0,5); Percent Variance Captured by PCA Model Principal Eigenvalue % Variance.](/14/4738716/big_thumb.jpg ">> [ax,mx,stdx]=auto(x); >> [scores,loads,ssq,res,reslm,tsqlm,tsq] = pca(ax,1,0,5); Percent Variance Captured by PCA Model Principal Eigenvalue % Variance.>")
 When you don’t know the standard deviation.>")


 rate = A rate which has been weighted to remove the influence of some extraneous variable, such as age.>")


