Download presentation
Presentation is loading. Please wait.

1
Technical Analysis Momentum, MACD indicator and Trend lines. Disclosure: For informational purposes only.

2
Momentum.. Momentum deals with the rate at which prices are changing. For example, in an uptrend, prices are rising and the trend line slopes upward. Momentum measures how quickly the prices are rising or how steeply the trend line is sloping. Momentum is similar to acceleration and deceleration. For example, let us assume that a car is initially traveling at a constant speed of 30 mph; at that point, the car has a constant slope of 30. When the car starts accelerating, it is gaining momentum, and it’s travel slope is increasing. At some point, the car cannot maintain the level of acceleration, and the rate of increase in speed begins to decline. The car is then said then to be decelerating, even though it is still traveling at an increasing rate of speed. The speed itself is not increasing as fast as earlier, so momentum is falling. The same principle applies to markets. Speed is equivalent to the slope of the price trend—the number of points gained per day, for instance. The most famous momentum indicator.. “MACD” Moving Average Convergence Divergence--A positive MACD indicates that the average price during the past 12 periods exceeds the average price over the past 26 periods. Front-weight moving averages, which are adjusted by weighting so that more recent data assumes more significance in the average than past data. As a result, The MACD offers the best of both worlds: Trend following and Momentum.

3
MACD continued… Weekly-base MACD patterns, as well as monthly MACD patterns, provide meaningful information regarding longer-term stock market trends. Daily MACD combinations: 6- to 19- unit for rapid buy signals during a more favorable climate. A 12- to 26- unit for a neutral market and for sell signals during very weak market periods. A 19- to 39- unit MACD for sell signals. Signal lines will usually be six- to nine- unit exponential moving averages of the MACD lines. The MACD is derived by dividing one Moving Average by another. Basically, it combines three Moving Averages into two lines. The equilibrium line is important. When the two Moving Averages cross below the equilibrium line, it means that the shorter EMA is at a value less than the longer EMA. This is a Bearish Signal. When the EMAs are above the equilibrium line, it means the shorter EMA has a value greater than the longer EMA. This is a Bullish Signal.

4
Gee-Whiz info.. There might be many benefits in attending lectures, meetings, and technical classes regarding trading tactics and investing, but it is probably best to operate alone in making and implementing actual trading decisions and to assume within yourself, the responsibilities of poor trades and the credit for good ones. Don’t confuse rising stock prices with being a financial genius. Similarly, it is best to keep your results and performance private. The temptation to boast of your successes and fears of reporting failures will almost certainly not help your performance. (IBD) Accumulation/Distribution: A momentum indicator that attempts to gauge supply and demand by determining whether investors are generally buying or selling a certain stock by identifying divergences between stock price and volume flow.
 Accumulation/Distribution: A momentum indicator that attempts to gauge supply and demand by determining whether investors are generally buying or selling a certain stock by identifying divergences between stock price and volume flow..")
6
Two Separate Indicators. 1. “0” line= 12 DMA is above or below 26 DMA (positive trend) 2. Black MACD line/slope= 12 DMA – 26 DMA (positive/negative momentum)
.")
7
Pay close attention to the “0” line, Bottom right. Positive Trend, but negative momentum.

8
Positive Trend/Slopes. Trend following (+) and Momentum (-)
 and Momentum (-)")
9
Large price spreads. 0 - 13.0 in less than two mo’s.

10
Small price spreads but still in an uptrend. MACD above 0.

12
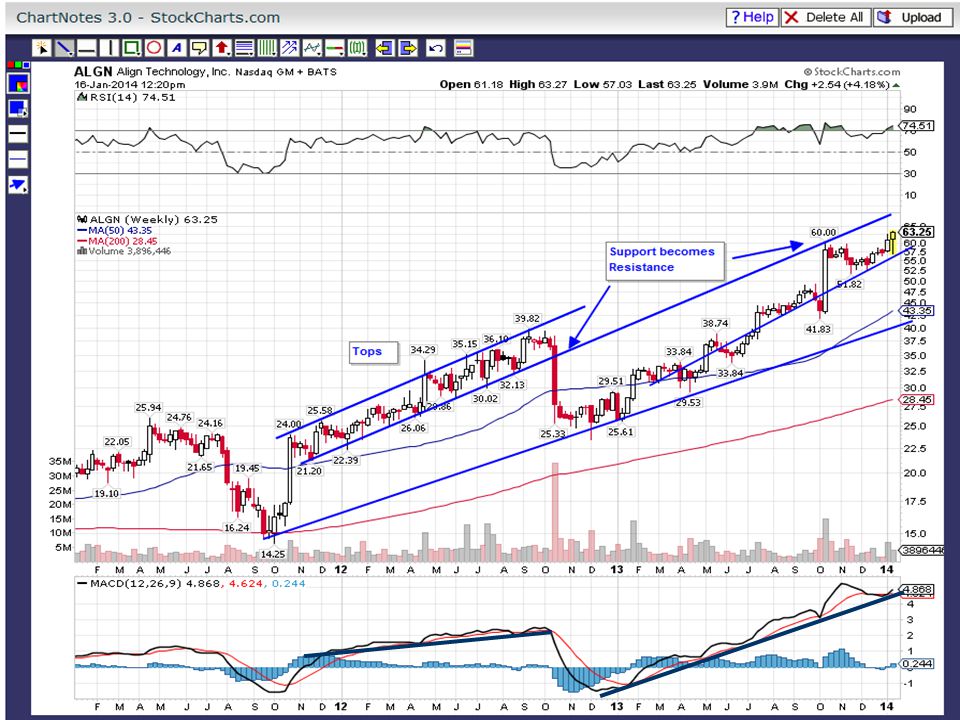
Prior Resistance becomes support Importance of using Trend lines in combination w/ MACD indicator.

14
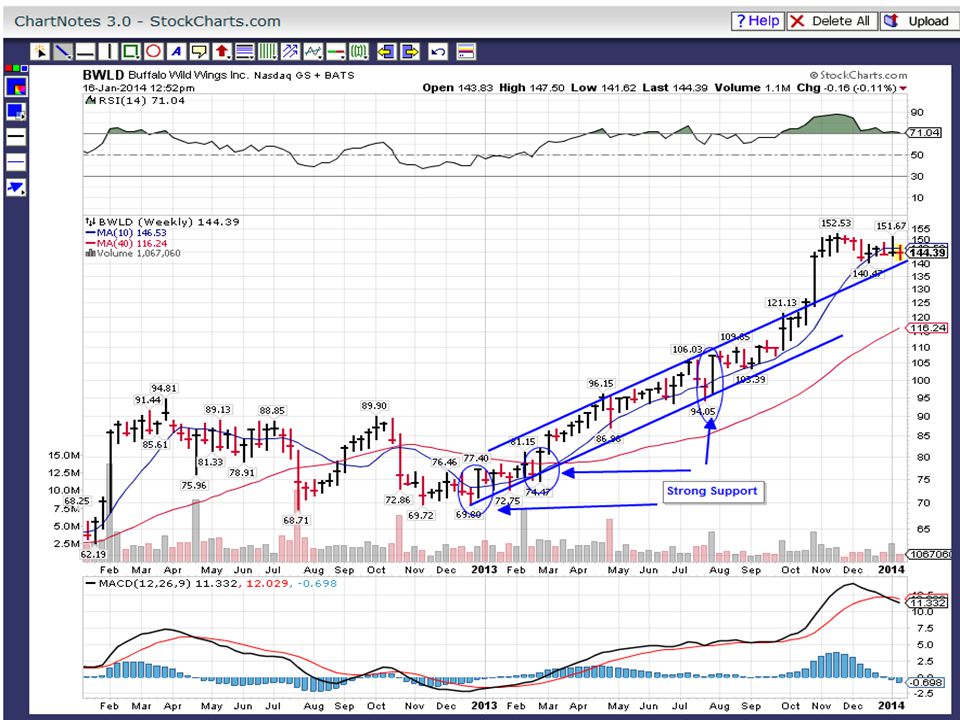
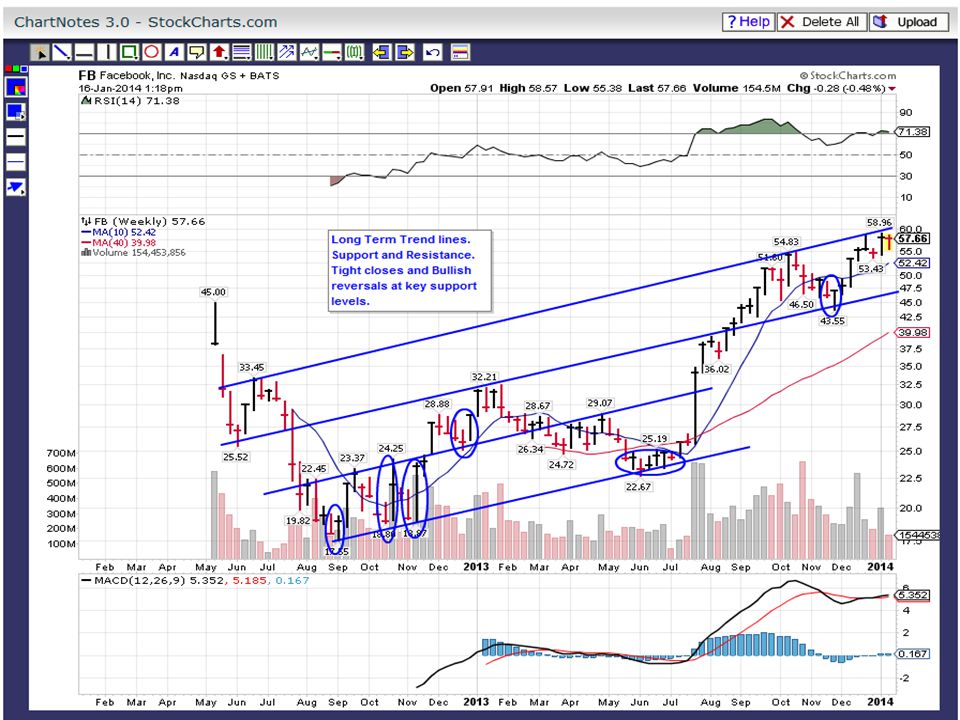
Strong MACD=Strong Trend, Pay close attention to upward trend lines and support/resistance trend lines.

29
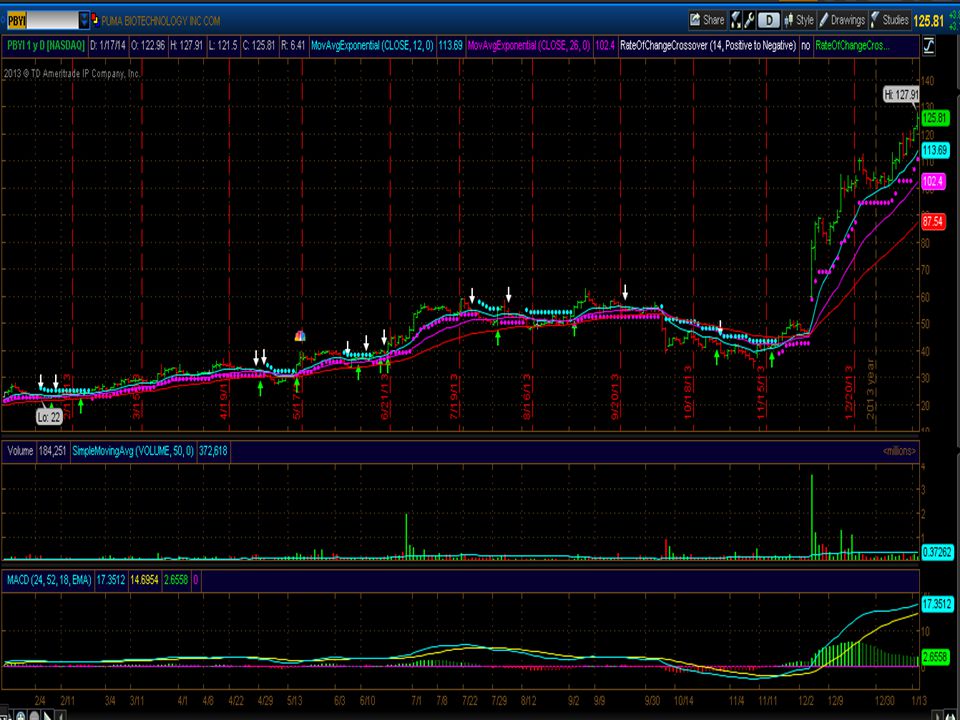
MACD went from 0 – 6.5 in less than 2 mo’s

34
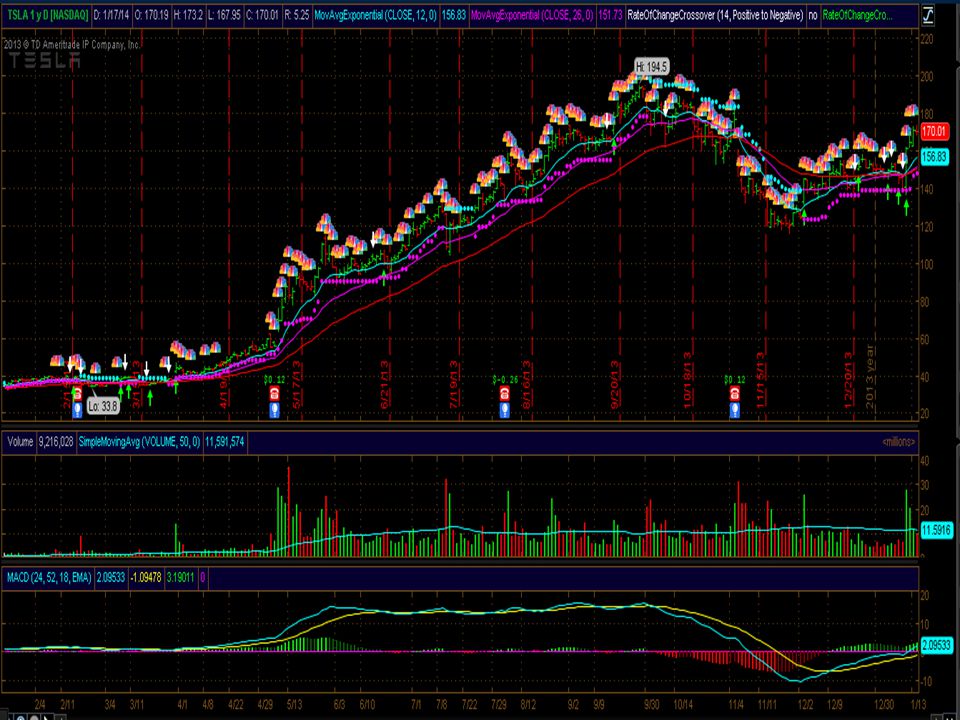
Bullish Trend & Momentum Reversal?

35
Bearish Momentum & Trend Reversal?

40
VCP’s

42
Break-out. As featured in IBD

45
Break-down.. As featured in IBD

48
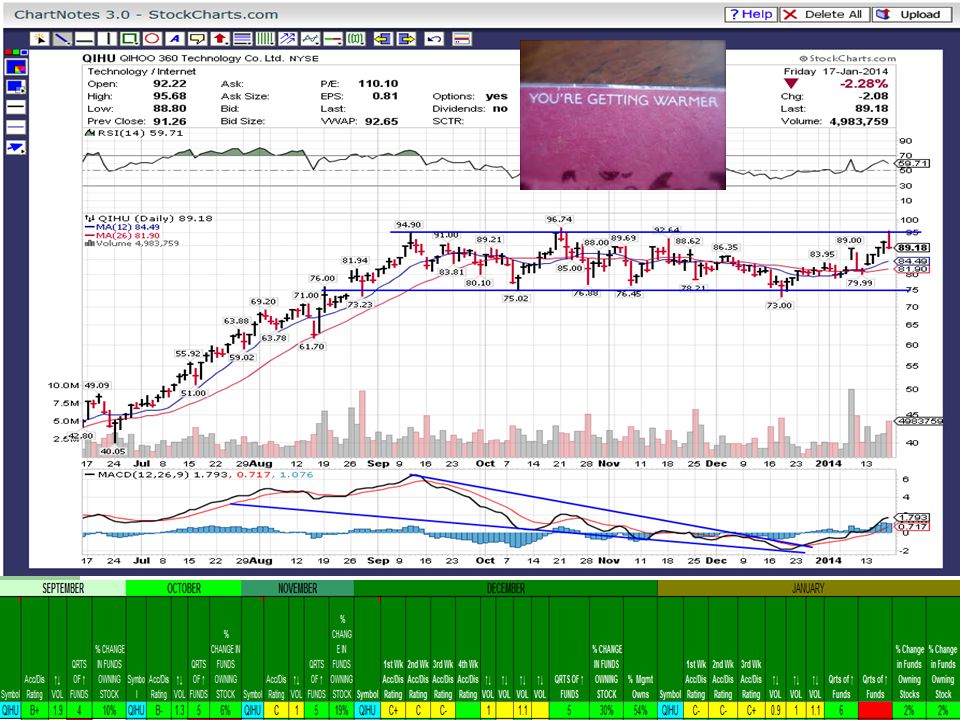
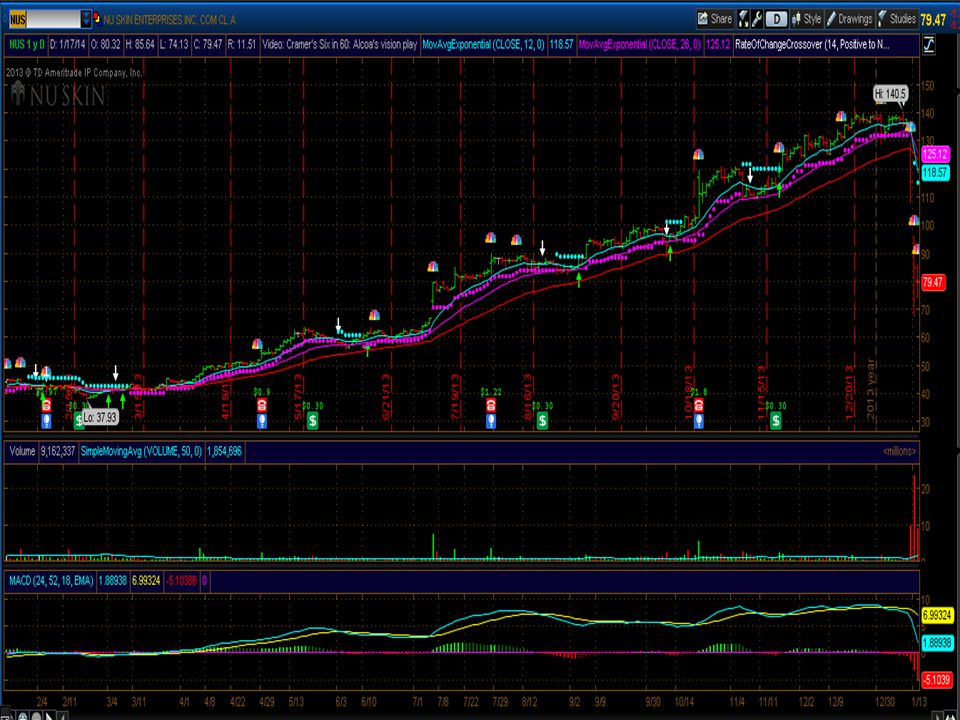
Pay close attention to the lower indicator, the MACD, and how it maintains a level above the equilibrium line.

Similar presentations


 Some important things we should all know…. Conceptual Understanding of… 1.MACD 2.P/E ratio 3.PEG ratio.>")

