Download presentation
Presentation is loading. Please wait.

1
Critical appraisal of clinical research evidence Chris Lewis – May 2008

2
How to read a “paper”

3
Objectives: To enable VTS members to have a good working knowledge of: Processes of EBM Conduct of a RCT Sources of bias in a RCT Risk assessment terminology (RR ARR NNT)
")
4
Evidence Based Medicine Incorporating the best available research evidence into clinical decision making

5
Processes of Evidence Based Medicine Asking answerable questions (PICO) Accessing the best information Appraising the information for validity and relevance Applying the information to patient care
 Accessing the best information Appraising the information for validity and relevance Applying the information to patient care")
6
Asking an answerable question Population Intervention Comparator Outcome(s)
")
7
Types of “paper” research evidence Primary studies – Case studies – Experiments – Surveys – Clinical Trials Secondary studies – Non-systematic reviews – Systematic reviews Meta-analyses Guidelines Decision analyses Economic analyses

8
AdvantagesDisadvantages Evidence-based Guideline Summarises all relevant research about all possible interventions for a clinical problem. Explores benefits and harms. May become out-of-date quickly. Expert opinion often fills gaps in evidence. Systematic ReviewSummarises all research about an intervention. Usually only one of several possible interventions is considered. May not explore benfits vs harms. Primary StudyVery specific informationNot comprehensive Types of evidence

9
Topics of Primary Study and Types of Study Design Phenomena Observation / qualitative studies Aetiology Cohort studies (or Case-control studies) Diagnosis and screening Cross-sectional analytical studies Prognosis Cohort studies Intervention Randomised Controlled Trials
 Diagnosis and screening Cross-sectional analytical studies Prognosis Cohort studies Intervention Randomised Controlled Trials")
10
How do you read a clinical research paper?

11
How to read a (clinical research) paper Scan abstract for a few seconds – Are the authors conclusions of interest? – Briefly assess study design – Briefly assess statistical precision of results – Formulate a brief summary Critically appraise methods & results sections for validity Critically appraise results section (especially the tables and figures) for relevance Draw your own conclusions about clinical applicability
 for relevance Draw your own conclusions about clinical applicability.")
12
What conclusions have you drawn concerning clinical application of the Heart Protection Study?

13
How to read a (clinical research) paper Scan abstract for a few seconds – Are the authors conclusions of interest? – Briefly assess study design – Briefly assess statistical precision of results – Formulate a brief summary Critically appraise methods & results sections for validity Critically appraise results section (especially the tables and figures) for relevance Draw your own conclusions about clinical applicability
 for relevance Draw your own conclusions about clinical applicability.")
14
WHAT INFORMATION WOULD YOU INCLUDE IN A BRIEF SUMMARY OF A CLINICAL RESEARCH PAPER? What is the essential information you want to know about any clinical research evidence?

15
Information to include in summary Type of study Size Study Population Intervention Comparator Duration Outcome(s) Main findings (with relevant statistics) Conclusion(s)
 Main findings (with relevant statistics) Conclusion(s)")
16
Produce a brief summary for the Heart Protection Study (6 to 8 short sentences) Note which parts of the paper you have to read to produce your summary.
 Note which parts of the paper you have to read to produce your summary.")
17
Heart Protection Study (Lancet.v360.pp7-22.6/7/2002) Randomised placebo-controlled trial 20536 UK adults, aged 40 to 80, with CHD, other occlusive arterial disease or diabetes. Effect of Simvastatin 40mg vs placebo on mortality, fatal and non-fatal vascular events. 5 years follow-up

18
All cause mortality reduced in the simvastatin group 1328/10269 (12.9%) vs 1507/10267 (14.7%); p=0.0003; RR 0.87 (0.81-0.94); NNT=55 First vascular event rate reduced in the simvastatin group 2033/10269 (19.8%) vs 2585/10267 (25.2%); p<0.0001; RR 0.76 (0.72-0.81); NNT=18. No significant harms identified All people similar to the study population should be treated with Simvastatin 40mg

19
How much of the paper have we actually read to get to this summary?

20
How to read a (clinical research) paper Scan abstract for a few seconds – Are the authors conclusions of interest? – Briefly assess study design – Briefly assess statistical precision of results – Formulate a brief summary Critically appraise methods & results sections for validity Critically appraise results section (especially the tables and figures) for relevance Draw your own conclusions about clinical applicability
 for relevance Draw your own conclusions about clinical applicability.")
21
Flow Diagram for a RCT / cohort study 1 Selection and sampling4 Outcomes 2 Allocation (with or without Randomisation)5 Analysis 3 Follow-up
5 Analysis 3 Follow-up")
22
Validity- External Validity To whom do the results of this trial apply? Can the results be reasonably applied to a definable group of patients in a particular clinical setting in routine practice? Are the results generalisable beyond the trial setting?

23
Appraisal of External Validity Where were the participants recruited from (primary care / referral centre)? Do the inclusion and exclusion criteria make sense? What proportion of the screened population was recruited?

24
Where were the participants recruited from?

25
Methods: Recruitment p8 69 UK hospitals

26
Inclusion Criteria:

27
Methods: Eligibility p8 Men and women aged 40 to 80 + Blood total cholesterol >= 3.5mmol/L + Past medical history of any one or more of CHD, CVA, TIA, PVD, DM OR Men, 65 to 80, treated for hypertension

28
Exclusion criteria:

29
1.Anyone already on a statin or Dr considered statin to be clearly indicated. 2.Contraindications – Chronic liver disease – ALT >67 IU/L (1.5 x ULN) – Child-bearing potential 3.Conditions requiring a dose reduction – Severe renal disease – Creatinine >200 mmol/L 4.Interactions – Treatment with ciclosporin, fibrates, niacin 5.Conditions similar to known unwanted effects – Inflammatory muscle disease – CK >750 IU/L (3 x ULN) 6.Patient unlikely to survive 5 years follow-up – Severe heart failure – Another life threatening condition 7.Conditions limiting compliance – Severely disabling stroke – Dementia
 – Child-bearing potential 3.Conditions requiring a dose reduction – Severe renal disease – Creatinine >200 mmol/L 4.Interactions – Treatment with ciclosporin, fibrates, niacin 5.Conditions similar to known unwanted effects – Inflammatory muscle disease – CK >750 IU/L (3 x ULN) 6.Patient unlikely to survive 5 years follow-up – Severe heart failure – Another life threatening condition 7.Conditions limiting compliance – Severely disabling stroke – Dementia.")
30
What proportion of the screened population was recruited?

31
Results: patient enrolment & Fig.1 p10 49% (31458/63603) of screened population excluded or refused We are not given a break-down of the reasons 36% (11609/32145) of population accepted for run-in were not subsequently randomised. – 26% chose not to enter or “did not seem likely to be compliant for 5 years” – 5% considered to have clear indication for statin – 3% raised ALT, CK or Creatinine at pre-treatment screen – 2% attributed various problems to run-in treatment – 1% cholesterol <3.5mmol/L Only 32% (20536/63603) of screened population were randomised.
 of screened population were randomised..")
32
Validity- Internal Validity The extent to which the observed difference in outcomes between the two comparison groups can be attributed to the intervention rather than other factors.

33
What are the possible causes of an “effect” in a RCT?

34
Bias Placebo Chance Real effect

35
Bias Allocation (Selection) Bias – Failure of randomisation Systematic differences in comparison groups Performance Bias Systematic differences in interventions received by the two groups Attrition Bias Systematic differences in withdrawals from the trial Detection (Measurement) Bias – Failure of blinding Systematic differences in outcome assessment
 Bias – Failure of randomisation Systematic differences in comparison groups Performance Bias Systematic differences in interventions received by the two groups Attrition Bias Systematic differences in withdrawals from the trial Detection (Measurement) Bias – Failure of blinding Systematic differences in outcome assessment")
36
Internal Validity - Sources of Bias in a RCT 2 Allocation Bias (Failure of Randomisation) 3 Follow-up – Performance Bias and Attrition Bias 4 Outcomes – Detection Bias (Failure of Blinding)
 3 Follow-up – Performance Bias and Attrition Bias 4 Outcomes – Detection Bias (Failure of Blinding)")
37
CONSORT definition: Selection bias—a systematic error in creating intervention groups, causing them to differ with respect to prognosis. The groups differ in measured or unmeasured baseline characteristics because of the way in which participants were selected for the study or assigned to their study groups.

38
Confounding—a situation in which the estimated intervention effect is biased because of some difference between the comparison groups apart from the planned interventions - such as baseline characteristics, prognostic factors, or concomitant interventions. For a factor to be a confounder, it must differ between the comparison groups and predict the outcome of interest.

39
Comparison of Cohort and RCT Cohort Population diverse Allocation by clinical decision Outcomes can be defined retrospectively Outcomes may be rare Follow-up may be retrospective and may be long-term Analysis complex multivariate RCT Population highly selected Allocation by chance Outcomes defined prospectively Outcomes must be common Follow-up pre-determined and usually short-term Analysis relatively simple

40
Possible types of comparisons in cohort study General population – Intervention v alternative intervention – Intervention v no intervention Restricted population – Intervention v alternative intervention – Intervention v no intervention

41
Do patients who receive atypical antipsychotic drugs have an increased risk of hip fracture? All older peopleOlder people with dementia Atypical antipsychotic (n=34 960) No Intervention (n=1 251 435) Atypical antipsychotic (n=21 427) No intervention (n=58 754) Mean (SD) age80.46 (7.63)74.50 (6.58)81.69 (7.11)80.95 (7.64) No (%) with dementia 21 427 (61.3)58 754 (4.7)21 427 (100)58 754 (100) Effect on age distribution and sample size of restricting comparison of atypical antipsychotic with no intervention to individuals with dementia
 No Intervention (n= ) Atypical antipsychotic (n=21 427) No intervention (n=58 754) Mean (SD) age80.46 (7.63)74.50 (6.58)81.69 (7.11)80.95 (7.64) No (%) with dementia (61.3) (4.7) (100) (100) Effect on age distribution and sample size of restricting comparison of atypical antipsychotic with no intervention to individuals with dementia.")
42
Consider the difference between the three sets of figures here: Atypical antipsychotic (n=21 427) No intervention (n=58 754) Mean (SD) age81.69 (7.11)80.95 (7.64) Mean (SD) age81.69 (1.11)80.95 (7.64) Mean (SD) age81.69 (7.11)80.95 (1.64)
 No intervention (n=58 754) Mean (SD) age81.69 (7.11)80.95 (7.64) Mean (SD) age81.69 (1.11)80.95 (7.64) Mean (SD) age81.69 (7.11)80.95 (1.64)")
43
Selection / Allocation Bias Assessed by looking at the Table of Baseline Characteristics

44
Womens Health Initiative JAMA v288, pp321-333, 17 th July 2002 A randomised placebo-controlled trial. 16608 American women, aged 50-79, with intact uterus. Effect of conjugated equine oestrogens 0.625mg od + medroxyprogesterone acetate 2.5mg od on incidence of CHD and Breast Cancer 8.5 years follow-up planned, but stopped after 5.2 years.

45
CHD rate increased in oest+prog group 164/8506 (1.93%) vs 122/8102 (1.51%); RR 1.29 (1.02-1.63); ARI 0.42%; NNH 238 Breast Ca rate increased in oest+prog group 166/8506 (1.95%) vs 124/8102 (1.53%); RR 1.26 (1.00 – 1.59); ARI 0.42%; NNH 238 Treatment group also had increased rate of venous thrombo- embolism and reduced rates of fractures and colo-rectal carcinoma. Overall long-term harms exceeded benefits 751/8506 (8.83%) vs 623/8102 (7.69%); RR 1.15 (1.03-1.28); ARI 1.14%; NNH 88 When prescribing combined HRT in the over-50’s short-term benefits should be balanced by consideration of long-term harms.
 vs 623/8102 (7.69%); RR 1.15 ( ); ARI 1.14%; NNH 88 When prescribing combined HRT in the over-50’s short-term benefits should be balanced by consideration of long-term harms..")
46
Table of Baseline Characteristics (WHI) Are all important characteristics listed? Are any of the differences between the treatment and placebo groups statistically significant? Are there any differences in the two groups that may bias the results? What age range includes 95% of the Placebo group? Assuming HRT has no effect – which group would you expect to have more heart attacks? Does this introduce a bias? If so, in which direction does it operate?

47
Performance Bias Contamination: Provision of the intervention to the control group Compliance: Poor compliance with the allocated intervention Co-interventions Provision of unintended additional interventions to either group

48
Attrition Bias Count (drop-out) Loss to follow-up rate should not exceed outcome event rate and should be equal in all groups.
 Loss to follow-up rate should not exceed outcome event rate and should be equal in all groups.")
49
Detection (Measurement) Bias Best: Double-blind Both patient and investigator unaware of treatment allocation Less important if outcome is objective (e.g. death) Critical if outcome is subjective Impossible for some comparisons eg medical vs surgical intervention
 Critical if outcome is subjective Impossible for some comparisons eg medical vs surgical intervention.")
50
What are the possible causes of an “effect” in a RCT? Bias Placebo Chance Real effect

51
Placebo Effect You can only know the size of a placebo effect if a placebo has been used!

54
Appraisal of Internal Validity Was assignment of patients to treatments randomised? Were groups similar at start of trial? Were groups treated similarly, apart from the experimental treatment? Were all participants accounted for in the conclusions? Were all participants analysed in the groups to which they were randomised (Intention To Treat analysis)? Were participants and clinicians kept “blind” to treatment received?
. Were participants and clinicians kept blind to treatment received .")
55
Randomisation? (with allocation concealment) Best: Centralised computer randomisation Should be independent of investigators Where: Methods HPS Methods: Recruitment p8 “The central telephone randomisation system…”
 Best: Centralised computer randomisation Should be independent of investigators Where: Methods HPS Methods: Recruitment p8 The central telephone randomisation system… .")
56
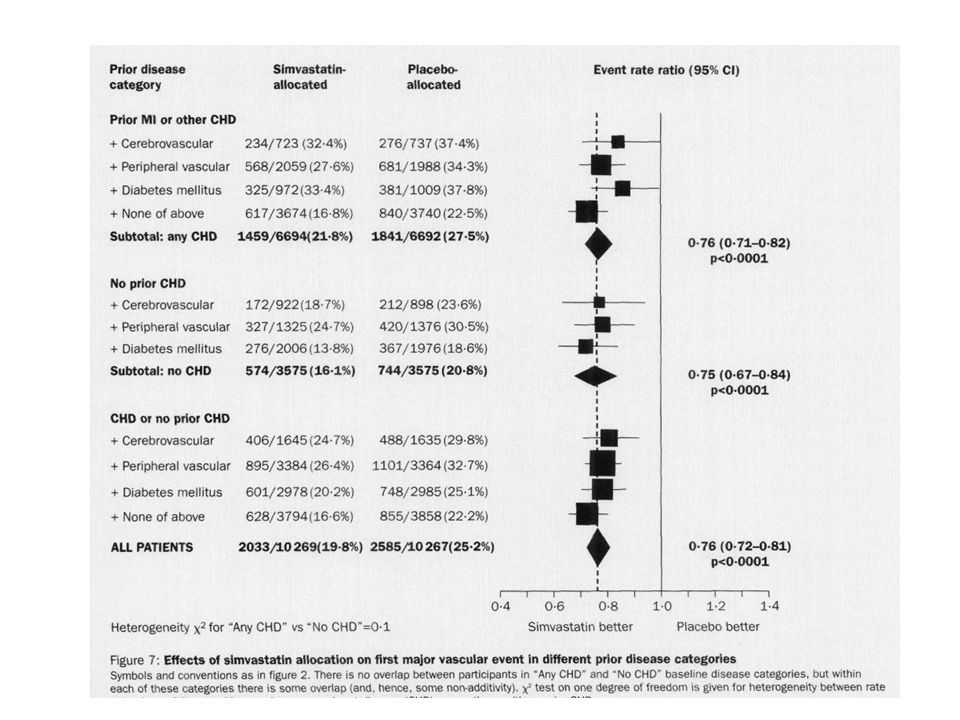
Similar Groups? Table of baseline characteristics (Note p-values) Where: Results HPS: Methods: Recruitment p8 “The central telephone randomisation system used a minimisation algorithm to balance the treatment groups with respect to eligibility criteria and other major prognostic factors” Results: Patient Enrollment p10 “…good balance between the groups for the main pre-randomisation prognostic features…” But – there is no table of baseline characteristics! We are left to make our assessment from the numbers allocated to each sub-group in Fig.8 p16
 Where: Results HPS: Methods: Recruitment p8 The central telephone randomisation system used a minimisation algorithm to balance the treatment groups with respect to eligibility criteria and other major prognostic factors Results: Patient Enrollment p10 …good balance between the groups for the main pre-randomisation prognostic features… But – there is no table of baseline characteristics. We are left to make our assessment from the numbers allocated to each sub-group in Fig.8 p16.")
57
Treated equally? Where: Methods - for intended schedule Results - for actual treatment HPS: Methods: Recruitment p8 “..randomly allocated to receive 40mg simvastatin daily or matching placebo tablets in specially prepared calendar packs..”

58
HPS: Results: Compliance p11 Placebo-allocated group more likely to be prescribed a non-study statin (32% vs 5% at end of study). Averaged over the 5 years of study 85% of simvastatin group and 17% of placebo group received a statin.

59
Non-equal treatment – Classic example 1948 – Trial of Vitamin E in pre-term infants Vitamin E prevented retrolental fibroplasia (by removal from 100% Oxygen to give the frequent doses of Vit E)
")
60
Loss to follow-up Rough guide: 5% - OK >20% - validity doubtful AND Must not exceed outcome event rate Where: Results

61
HPS – Loss to Follow-up SimvastatinPlacebo Mortality0.03%0.04% Morbidity0.33%0.25% Total0.36%0.29% Outcome ER19.8%25.2% Results: Fig.1 p10

62
Intention-to-treat analysis Maintains the randomisation Where: Results HPS: Summary: Methods p7 “Analyses…compare all simvastatin-allocated versus all placebo-allocated participants. These ‘intention-to-treat’ comparisons…” Results: Compliance p11

63
Blinding? Best: Double-blind Where: Methods HPS: Does not mention “blinding” But we are given some suggestion the randomisation process kept the allocation concealed from both patients and investigators. Methods: Recruitment p9 “…matching placebo tablets in specially prepared calendar packs.” Methods: Follow-up p9 “….coordinating centre clinical staff…were kept unaware of the study treatment allocation.”

64
How to read a (clinical research) paper Scan abstract for a few seconds – Are the authors conclusions of interest? – Briefly assess study design – Briefly assess statistical precision of results – Formulate a brief summary Critically appraise methods & results sections for validity Critically appraise results section (especially the tables and figures) for relevance Draw your own conclusions about clinical applicability
 for relevance Draw your own conclusions about clinical applicability.")
65
Appraisal of Relevance / Impact Were all the outcomes studied important? Were all the important outcomes studied? Was sub-group analysis pre-planned? Could the treatment effect have arisen by chance? How large was the treatment effect?

66
HPS: Outcomes Primary Outcomes – Mortality – Non-fatal vascular events MI, CVA, Revascularisation Secondary Outcomes – Cancer – Other major morbidity Where: Summary

67
Was sub-group analysis pre-planned? Where: Methods, Statistical Analysis “The data analysis plan was prespecified…before any analysis of the effects of treatment were available…”

68
Could the treatment effect have arisen by chance? p-values Statistical test of the (“null”) hypothesis that the intervention had no effect If p<0.05 result is statistically significant i.e. the effect would occur by chance less than 5% of the time The smaller the p-value the less likely is the effect to occur by chance Confidence Intervals (95%) Range of values that has a 95% chance of including the true value
 hypothesis that the intervention had no effect If p<0.05 result is statistically significant i.e. the effect would occur by chance less than 5% of the time The smaller the p-value the less likely is the effect to occur by chance Confidence Intervals (95%) Range of values that has a 95% chance of including the true value.")
69
How large was the treatment effect? RRRRRARRNNT Death0.870.131.8%55 Event0.760.245.4%18

70
Expressions of Risk In the study population, treatment with Simvastatin 40mg for 5 years, compared with placebo, resulted in: A 13% reduction in risk of death A 24% reduction in risk of a major vascular event A 1.8% reduction in deaths A 5.4% reduction in major vascular events We need to treat 55 people to defer one death We need to treat 18 people to prevent / defer a major vascular event.

71
Expressions of Risk Relative Risk (RR) = EER / CER Relative Risk Reduction (RRR) = 1 – RR Absolute Risk Reduction (ARR) = CER – EER Numbers Needed to Treat (NNT) = 1/ARR EER = Experimental Event Rate CER = Control Event Rate
 = EER / CER Relative Risk Reduction (RRR) = 1 – RR Absolute Risk Reduction (ARR) = CER – EER Numbers Needed to Treat (NNT) = 1/ARR EER = Experimental Event Rate CER = Control Event Rate")
72
Relative Risk RR & RRR may remain constant despite huge differences in absolute event rates They are useful to determine whether a biological effect exists …. BUT They do not discriminate between huge treatment effects and trivial ones.

73
CEREERRRR 0.160.1037.5% 0.0160.01037.5% 0.00160.001037.5%

74
Absolute Risk Reduction ARR reflects baseline risk and does discriminate between huge and trivial treatment effects.

75
CEREERRRRARR 0.160.1037.5%6% 0.0160.01037.5%0.6% 0.00160.001037.5%0.06%

76
Numbers Needed to Treat The number of people you need to treat for one of them to have the desired outcome over a specified period of time. A good measure of clinical relevance. Allows calculation of cost per desired outcome.

77
CEREERRRRARRNNT 0.160.1037.5%6%16.7 0.0160.01037.5%0.6%167 0.00160.001037.5%0.06%1667

78
NNT for various CER’s and RRR’s RRR CER50%40%30%20%10% 0.9234611 0.378111733 0.120253350100 0.012002503335001000 0.001200025003333500010000 Note that a small RRR for a condition with a high CER is more clinically important than a large RRR for a condition with a low CER

79
Cost: HPS Can be calculated from NNT It costs (£25 x 12 x 5 x 55) £82500 to defer one death. It costs (£25 x 12 x 5 x 18) £27000 to prevent / defer one major vascular event.
 £27000 to prevent / defer one major vascular event..")
80
Women’s Health Initiative (WHI) Estrogen + Progestin Placebo Women (n)85068102 Fractures ~5 yrs650788 Rate (annualised)0.01470.0191 Can you calculate RR, RRR, ARR and NNT?
 Estrogen + Progestin Placebo Women (n) Fractures ~5 yrs Rate (annualised) Can you calculate RR, RRR, ARR and NNT")
81
Women’s Health Initiative (WHI) Estrogen + Progestin Placebo Women (n)85068102 Fractures ~5 yrs650788 Rate (annualised)0.01470.0191 RR = EER/CER = 0.0147/0.0191 = 0.77 RRR = 1-RR = 1 – 0.77 = 0.23 ARR = CER–EER = 0.0191 – 0.0147 = 0.0044 NNT = 1/ARR = 1/0.0044 = 227
 Estrogen + Progestin Placebo Women (n) Fractures ~5 yrs Rate (annualised) RR = EER/CER = / = 0.77 RRR = 1-RR = 1 – 0.77 = 0.23 ARR = CER–EER = – = NNT = 1/ARR = 1/ = 227")
82
Women’s Health Initiative (WHI) HRT for one year: Reduces the risk of fracture by 23% Reduces the number of fractures by 0.44% We need to treat 227 post-menopausal women for one year to prevent one fracture At ~£20/month (20x12x227) = £54480 per fracture prevented
 HRT for one year: Reduces the risk of fracture by 23% Reduces the number of fractures by 0.44% We need to treat 227 post-menopausal women for one year to prevent one fracture At ~£20/month (20x12x227) = £54480 per fracture prevented")
83
Number Needed to Harm Estrogen + Progestin Placebo Women (n)85068102 Breast Cancer ~5 yrs166124 Rate (annualised)0.00380.0030 Can you calculate RR, RRI, ARI, NNH?
 Breast Cancer ~5 yrs Rate (annualised) Can you calculate RR, RRI, ARI, NNH")
84
Number Needed to Harm Estrogen + Progestin Placebo Women (n)85068102 Breast Cancer ~5 yrs166124 Rate (annualised)0.00380.0030 RR = EER/CER = 0.0038/0.0030 = 1.27 RRI = RR-1 = 1.27-1 = 0.27 ARI = EER-CER = 0.0038-0.0030 = 0.0008 NNH = 1/ARI = 1250
 Breast Cancer ~5 yrs Rate (annualised) RR = EER/CER = / = 1.27 RRI = RR-1 = = 0.27 ARI = EER-CER = = NNH = 1/ARI = 1250")
85
Women’s Health Initiative (WHI) HRT for one year: Increases the risk of breast cancer by 27% Increases the number of breast cancers by 0.08% We need to treat 1250 post-menopausal women for one year to give one of them breast cancer.
 HRT for one year: Increases the risk of breast cancer by 27% Increases the number of breast cancers by 0.08% We need to treat 1250 post-menopausal women for one year to give one of them breast cancer.")
86
How to read a (clinical research) paper Scan abstract for a few seconds – Are the authors conclusions of interest? – Briefly assess study design – Briefly assess statistical precision of results – Formulate a brief summary Critically appraise methods & results sections for validity Critically appraise results section (especially the tables and figures) for relevance Draw your own conclusions about clinical applicability
 for relevance Draw your own conclusions about clinical applicability.")
87
Appraising Applicability Is my patient similar to the study population? Is the treatment feasible in my clinical setting? Will potential benefits of treatment outweigh potential harms of treatment for my patient?

88
Outcomes with CER 25% and NNT=20 www.nntonline.net

89
CURE. NEJM 2001 v345 p394 Worse with Rx

90
Discuss the evidence for and against the following conclusions regarding clinical applicability in relation to the Heart Protection Study:

91
Group 1 There is no need to check LFT’s prior to commencing statin therapy. There is no need to check LFT’s during statin therapy. There is no need to check CK prior to commencing statin therapy. There is no need to check CK during statin therapy.

92
Group 2 All people with diabetes should be treated with a statin. All men >65 who are treated for hypertension should be treated with a statin.

93
Group 3 Amongst people similar to the study population there is no need to test blood cholesterol levels prior to commencing a statin. Once a decision has been taken to start statin treatment there is no need to monitor blood cholesterol levels.

94
Group 4 Statins should be stopped at age 80. Women benefit from statin treatment to the same extent as men. Once started statin treatment should be continued indefinitely.

95
Group 1 There is no need to check LFT’s prior to commencing statin therapy. There is no need to check LFT’s during statin therapy. There is no need to check CK prior to commencing statin therapy. There is no need to check CK during statin therapy.

96
People with raised ALT and CK were excluded from the study. We are not told how many screened people were excluded for this reason, but 3% of pre- randomisation run-in group were excluded for raised ALT, CK or Creatinine (Results para1 p10)
.")
98
SimvaPlaceboARINNHp ALT 2-4x1.35%1.28%0.07%1428 ALT >4x0.42%0.31%0.11%909 CK 4-10x0.19%0.13%0.06%1667 CK >10x0.11%0.06%0.05%2000 Myo0.05%0.01%0.04%25000.2 Rhabdo0.05%0.03%0.02%5000 Persistant ALT >4x 0.09%0.04%0.05%20000.3 Persistant CK >4x 0.07%0.01%0.06%16670.07

99
There is good evidence that it is not necessary to monitor LFT’s or CK in follow-up of Simvastatin 40mg treatment in the absence of relevant symptoms. The low (not statistically significant) attributable risk of persistently raised ALT or CK due to Simvastatin 40mg makes it improbable that pre-treatment testing will be of value to the patient. This study does not provide evidence about generalisability to other statins (or other doses of simvastatin).
 attributable risk of persistently raised ALT or CK due to Simvastatin 40mg makes it improbable that pre-treatment testing will be of value to the patient. This study does not provide evidence about generalisability to other statins (or other doses of simvastatin)..")
100
Group 2 All people with diabetes should be treated with a statin. All men >65 who are treated for hypertension should also be treated with a statin.

102
Event rate SimvaPlaceboARRNNT Diabetes20.2%25.1%4.9%20 There is good evidence that people with diabetes aged 40 to 80, with total cholesterol >=3.5 mmol/L should be offered Simvastatin 40mg.

103
Only 1% of the trial population was male >65 on treatment for hypertension and had no history of vascular disease or diabetes. This subgroup was not separately analysed (or if it was analysed it was not reported). This study provides no evidence concerning the benefits treatment for this subgroup
. This study provides no evidence concerning the benefits treatment for this subgroup.")
104
Group 3 Amongst people similar to the study population there is no need to test blood cholesterol levels prior to commencing a statin. Once a decision has been taken to start statin treatment there is no need to monitor blood cholesterol levels.

105
Patients with Total Cholesterol <3.5 mmol/L were excluded. Outcome event rate benefit from simvastatin 40mg did not vary with starting cholesterol level or pre-randomisation LDL response. But the study does not tell us whether much larger reductions in LDL cholesterol would give rise to larger reductions in outcome event rates.

106
This study provides no evidence of need to check cholesterol levels during treatment with simvastatin 40mg. This information needs to be taken in the context that other studies have reported greater benefit for greater reduction in cholesterol levels, and QOF provides a financial incentive to treat to a target level.

107
Group 4 Statins should be stopped at age 80. Women benefit from statin treatment to the same extent as men. Once started statin treatment should be continued indefinitely.

108
Trial population were aged 40 to 80 at outset – so the oldest were 85 at end of trial. Event rateSimvaPlaceboARRNNT <6516.9%22.1%5.2%19 65 – 6920.9%27.2%6.3%16 >7023.6%28.7%5.1%20 Considerable overlap of confidence intervals of event rate ratios for different age subgroups suggests no statistically significant difference in treatment effect with age within the age groups studied. Trend chi 2 0.73 (nb 3.84 ~ p<0.05)
.")
109
Note: 67% of trial participants were male Event rateSimvaPlaceboARRNNT Male21.6%27.6%6.0%17 Female14.4%17.7%3.3%30 Note the pattern of overlap of confidence intervals Heterogeneity chi 2 0.76 The actual results tell us that there is a difference in benefit between male and female, but the statistical tests tell us that this difference is not significant.

110
Study duration was 5 years, so strictly it only informs us of benefits and harms over the first 5 years of treatment. But figures 5 & 6 give some information which allows us to predict that benefits would continue for longer than 5 years – how much longer is a matter of opinion / judgment.

112
Event rate YearsimvaplaceboARRNNT 14.7%5.1%0.4%250 23.9%5.6%1.7%59 33.9%5.6%1.7%59 43.8%5.2%1.4%71 5+5.8%7.3%1.5%67

113
Event rate Diff inAdjusted YearARRStatin use ARRNNT 10.4%85%0.5%200 21.7%76%2.2%45 31.7%67%2.5%40 41.4%59%2.4%42 5+1.5%50%3.0%33

115
Before we can apply the results of any individual primary study we have to place it in the context of all other relevant research. > Systematic Reviews, Guidelines What is already known What this study adds Has anything been added since this study?

116
Levels of Evidence: ISystematic Review of all relevant RCT’s IIAt least one good quality RCT IIIGood non-randomised trials; cohort or case- control studies. IV‘Expert’ opinion

117
Further Reading Cochrane handbook for systematic reviews of interventions http://www.cochrane.org/resources/handbook/Handbook4.2.6Sep2006.pdf http://www.cochrane.org/resources/handbook/Handbook4.2.6Sep2006.pdf Consort Statements http://www.consort-statement.org/?o=1001 Bandolier BMJ

118
Odds Ratios Odds of an event = no. of events / no. of non-events e.g. 51 boys/100 births Odds of boy = 51/49 = 1.04 Odds >1 means event more likely to happen than not Odds of an impossibility are zero Odds of a certainty are infinity Odds ratio = odds in intervention group / odds in control group

119
Odds Ratios (cont.) When events are rare Odds and Risk are similar OR and RR are similar As prevalence (control event rate) and OR increase the error in using OR as an approximation for RR becomes unacceptable.
 When events are rare Odds and Risk are similar OR and RR are similar As prevalence (control event rate) and OR increase the error in using OR as an approximation for RR becomes unacceptable.")
120
In the simvastatin group: the odds of an event are 2033/8236 = 0.247 or 24.7% the risk of an event is 2033/10269 = 0.198 or 19.8% In the placebo group: The odds of an event are 2585/7684 = 0.336 or 33.6% The risk of an event is 2585/10267 = 0.252 or 25.2% EventNo Event Simvastatin2033823610269 Placebo2585768410267 The odds ratio (=relative odds) is 0.247/0.336 = 0.735 or 73.5% The risk ratio (=relative risk) is 0.198/0.252 = 0.786 or 78.6% An absolute difference of 51:1000 and a relative error of ~7% In HPS:
 is 0.247/0.336 = or 73.5% The risk ratio (=relative risk) is 0.198/0.252 = or 78.6% An absolute difference of 51:1000 and a relative error of ~7% In HPS:")
121
Odds ratios are used because of their superior mathematical properties: They can always take values between 0 and infinity; values RR can take are dependent on CER. With OR’s the relationship between the two possible outcomes (event or not event) is reciprocal – not so for RR. OR’s always used in case-control studies where disease prevalence is not known. When adjusting for confounding factors which affect event rates, logistic regression models (the correct approach) use odds and report effects as odds ratios.
 is reciprocal – not so for RR. OR’s always used in case-control studies where disease prevalence is not known. When adjusting for confounding factors which affect event rates, logistic regression models (the correct approach) use odds and report effects as odds ratios..")
Similar presentations


>")


>")


