Download presentation
Presentation is loading. Please wait.

1
VS. This report shows another example where the reality of coherent noise is pitted against the complacency of the linear seismic mathematicians. This data comes from the Michigan basin, and my contact is looking for shallow reef possibilities. He was testing the merits of 3D and felt a prospect he had been excited about disappeared on the new shooting. On the chance that my ADAPS pre-stack logic could help, he asked me to look into the situation. In my early work on coal seam resolution in Scotland (Dr. Robin Westerman) I had determined that the troublesome coherent noise was unique to each shot point and that the process of gathering 3D traces for stacking completely jumbled the picture. I say understanding what goes into the stack should be a basic professional requirement for those using seismic. Since the noise is generated at the source, looking at it as a function of the offset from the shot is an obvious first step.I therefore asked for the raw 3D data in the original shot point format. To those few who have spent any time on my website (adaps.com) the themes here will not be new. This is just another example of the type of interference I say is omnipresent on land data. I felt so sure of my grounds that I paid for the reprocessing. My preliminary answer to the potential client is that the noise is strong enough that we have no idea how many reefs exist. Removing the strong noise is not a simple thing. The current industry answer is the use of band pass filtering, where my approach is to predict and gently lift off specific events.If you are interested in following my progress click on the ostrich to email me, and I will add you to my list. Almost everything you will see on the next 30 slides is noise. Somewhere, underneath it all, true reflections exist. There are two major noise types I want you to watch. The most obvious one here is what some would call ground roll. It is particularly serious in the shallow target zone.I show that it is caused by nested refractions (horizontally traveling energy). The second is the central noise cone, which I believe is caused by shear waves and their subsequent refractions. Of course I will comment on both through the presentation. There were 312 shot points in the 3D set. This first 30 is very representative of all. The last hurrah? Approaching the tottery stage, I am forced to accept my failure to convince the seismic world of the truth and beauty of my non-linear logic. You will note some sarcasm sprinkled through the slides. I am particularly irritated with myself for spending a lot trying to sell via LinkedIn, which I now view as a social network not really suited to (contrary) idea propagation. In any case it seems time for me to draw back and lick my wounds, conserving what little resources I have left. After all I’ve been obsessed with inversion topics since the 60’s.
 I had determined that the troublesome coherent noise was unique to each shot point and that the process of gathering 3D traces for stacking completely jumbled the picture. I say understanding what goes into the stack should be a basic professional requirement for those using seismic. Since the noise is generated at the source, looking at it as a function of the offset from the shot is an obvious first step.I therefore asked for the raw 3D data in the original shot point format. To those few who have spent any time on my website (adaps.com) the themes here will not be new. This is just another example of the type of interference I say is omnipresent on land data. I felt so sure of my grounds that I paid for the reprocessing. My preliminary answer to the potential client is that the noise is strong enough that we have no idea how many reefs exist. Removing the strong noise is not a simple thing. The current industry answer is the use of band pass filtering, where my approach is to predict and gently lift off specific events.If you are interested in following my progress click on the ostrich to me, and I will add you to my list. Almost everything you will see on the next 30 slides is noise. Somewhere, underneath it all, true reflections exist. There are two major noise types I want you to watch. The most obvious one here is what some would call ground roll. It is particularly serious in the shallow target zone.I show that it is caused by nested refractions (horizontally traveling energy). The second is the central noise cone, which I believe is caused by shear waves and their subsequent refractions. Of course I will comment on both through the presentation. There were 312 shot points in the 3D set. This first 30 is very representative of all. The last hurrah. Approaching the tottery stage, I am forced to accept my failure to convince the seismic world of the truth and beauty of my non-linear logic. You will note some sarcasm sprinkled through the slides. I am particularly irritated with myself for spending a lot trying to sell via LinkedIn, which I now view as a social network not really suited to (contrary) idea propagation. In any case it seems time for me to draw back and lick my wounds, conserving what little resources I have left. After all I’ve been obsessed with inversion topics since the 60’s..")
2
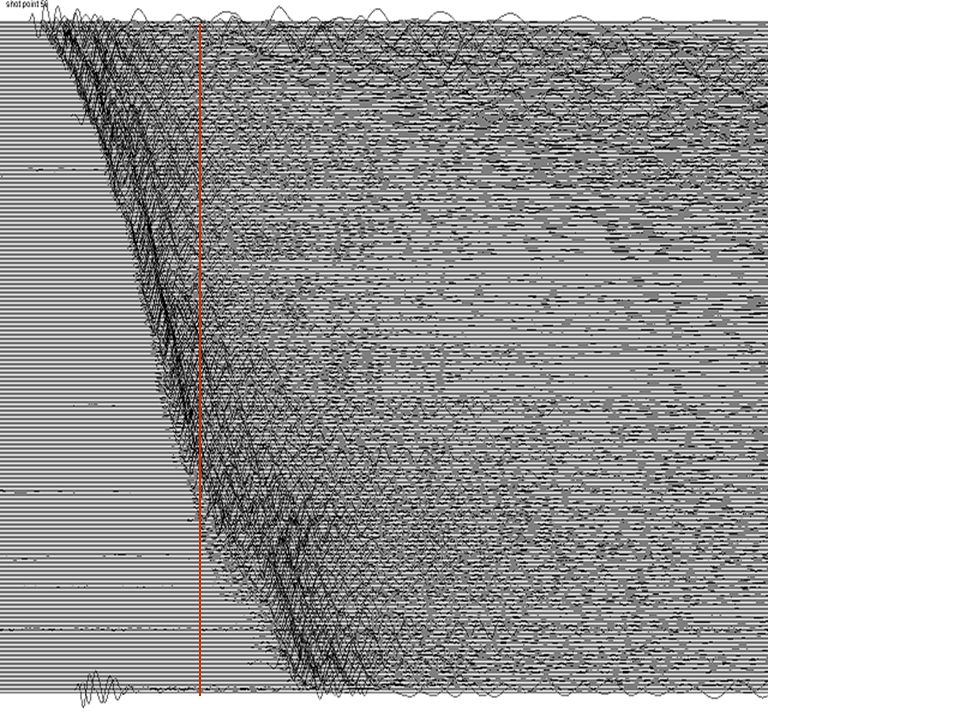
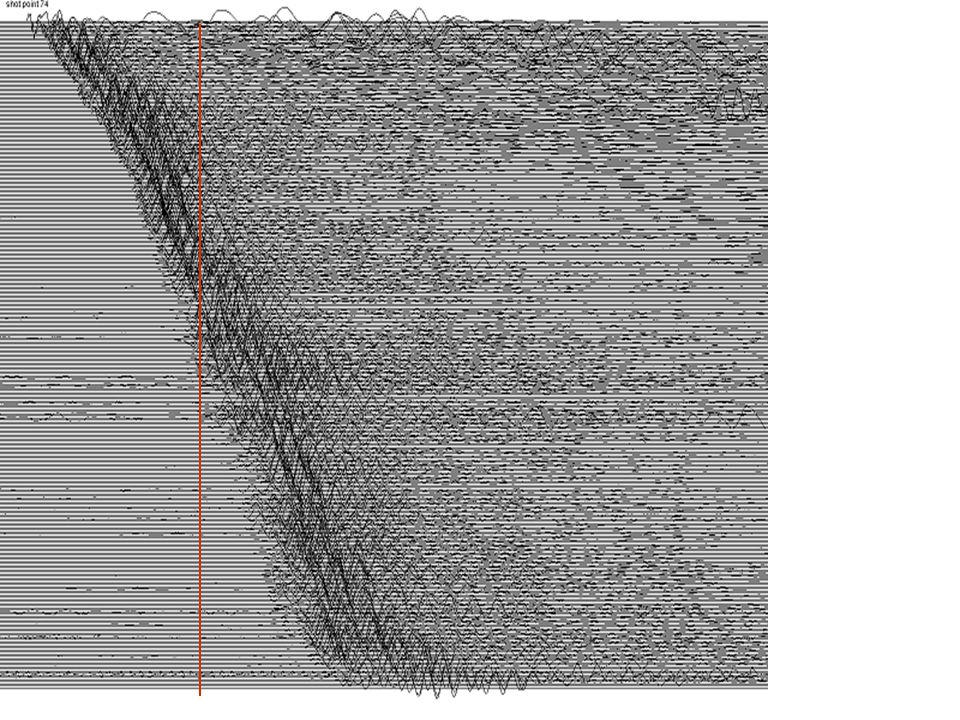
Here on shot point 1 I introduce the noise zones I want you to observe. The traces here are sorted by absolute offset from the shot. To the left of the yellow line we see a series of horizontally traveling refractions. As we move away from the shot, the faster (deeper) refractions catch up with the earlier ones, causing strong interference patterns. Above the green line we see the central noise cone caused by shear waves emanating from the shot. On this prospect this cone is not as strong as the near surface refractions, but we will see later on that it still is a lot stronger than the reflected events. The red timing line is placed at the same time position on all slides. It’s purpose is to show you how the noise differs between the shots. Pay close attention here. So where are the reflections we should see between the noise bands? I doubt you will find any in the entire series. The fact that final, normal stacks show continuous events suggests that the real data lies beneath what we see here. The actual early energy on the outside traces is about a tenth of that near the shot, so keep that in mind as you move on. Faith in linear, time series mathematics is almost a seismic religion. This presentation is one more attempt to show the need for non-linear solutions.
 refractions catch up with the earlier ones, causing strong interference patterns. Above the green line we see the central noise cone caused by shear waves emanating from the shot. On this prospect this cone is not as strong as the near surface refractions, but we will see later on that it still is a lot stronger than the reflected events. The red timing line is placed at the same time position on all slides. It’s purpose is to show you how the noise differs between the shots. Pay close attention here. So where are the reflections we should see between the noise bands. I doubt you will find any in the entire series. The fact that final, normal stacks show continuous events suggests that the real data lies beneath what we see here. The actual early energy on the outside traces is about a tenth of that near the shot, so keep that in mind as you move on. Faith in linear, time series mathematics is almost a seismic religion. This presentation is one more attempt to show the need for non-linear solutions..")
3
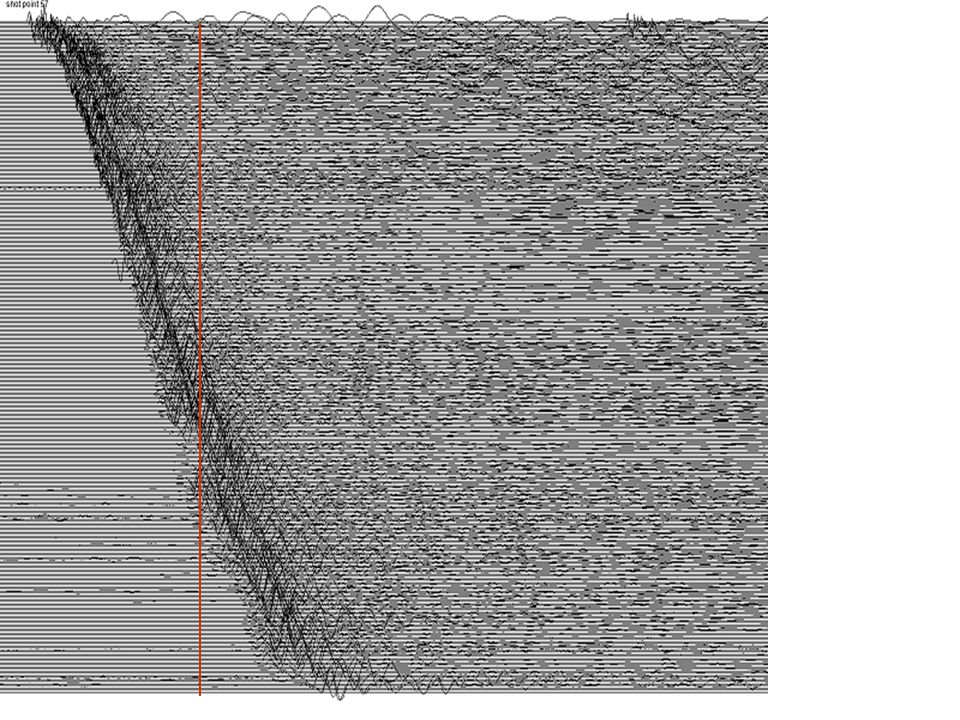
Toggle back to see the big difference in the shallow energy. This is shot point 2, and while I have not spotted it on a map I assume it’s close to shot point 1. Non-linear inversion logic (at least in my ADAPS system) essentially breaks what is done in linear work into pieces, allowing the designer to fine tune the logic. Iterations replace hard equations, keeping the process from going wild. This allows moving all the way to single spike answers in a statistical manner. The black box stigma – The reluctance of the industry to confront the weakness of current time series inversions has posed a barrier I have not been able to climb over. Because researchers have grown up using time series approaches, systems that rely on optimization are automatically put in question. Yet problems such as I describe herein are completely ignored. That is the conundrum I have struggled with for years. The LinkedIn exercise I had hoped that using LinkedIn would provide a bridge to those willing to consider non-linear answers. Unfortunately I found the path cluttered by social media needs, and technical exchange limited to status quo trivialities. Out of over 750 contacts I’ve just had a half dozen friendly replies, none with any hope of financial support, This show is one more attempt to put problems into perspective. At least it gives me the chance to once more agree with myself.
 essentially breaks what is done in linear work into pieces, allowing the designer to fine tune the logic. Iterations replace hard equations, keeping the process from going wild. This allows moving all the way to single spike answers in a statistical manner. The black box stigma – The reluctance of the industry to confront the weakness of current time series inversions has posed a barrier I have not been able to climb over. Because researchers have grown up using time series approaches, systems that rely on optimization are automatically put in question. Yet problems such as I describe herein are completely ignored. That is the conundrum I have struggled with for years. The LinkedIn exercise I had hoped that using LinkedIn would provide a bridge to those willing to consider non-linear answers. Unfortunately I found the path cluttered by social media needs, and technical exchange limited to status quo trivialities. Out of over 750 contacts I’ve just had a half dozen friendly replies, none with any hope of financial support, This show is one more attempt to put problems into perspective. At least it gives me the chance to once more agree with myself..")
4
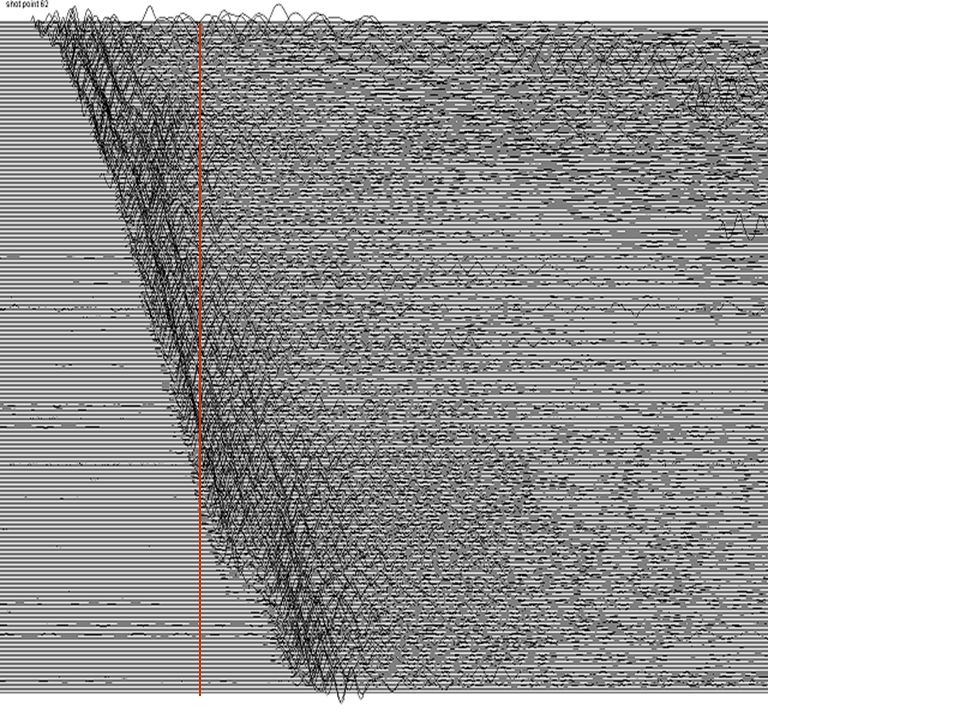
Note this event continuity showing a really low NMO. Remember this is uncorrected data. We are only looking at 1.2 seconds of data so, if we are to believe this event (and others like it) is real, it has to be a fairly high velocity refraction. In any case it is still noise, and we have yet to see real reflections.
 is real, it has to be a fairly high velocity refraction. In any case it is still noise, and we have yet to see real reflections..")
5
The higher ambient noise level moving down is caused by increased amplitude recovery multipliers. Of course the fact is that this is pretty lousy data. Recognizing this noise isn’t easy. I’ve spent hours studying this data and undoubtedly will spend many more. Although a most powerful statistical tool, there is a limit to what the stack can resolve. Noise more than ten times stronger than the better reflections can’t be ignored. Advanced resolution tools depend on wavelet statistics. If noise distortion is present, one should question the accuracy of the results, particularly if they’re from rigid linear algorithms. Just the facts please! We are not pushing solutions here. This extensive series of slides was built to study the noise problem. In the perfect technical world all professionals who rely on good seismic would make the effort to understand what is going on. Instead my conclusion has the blind leading the blind. (Pieter Bruegel)
.")
6
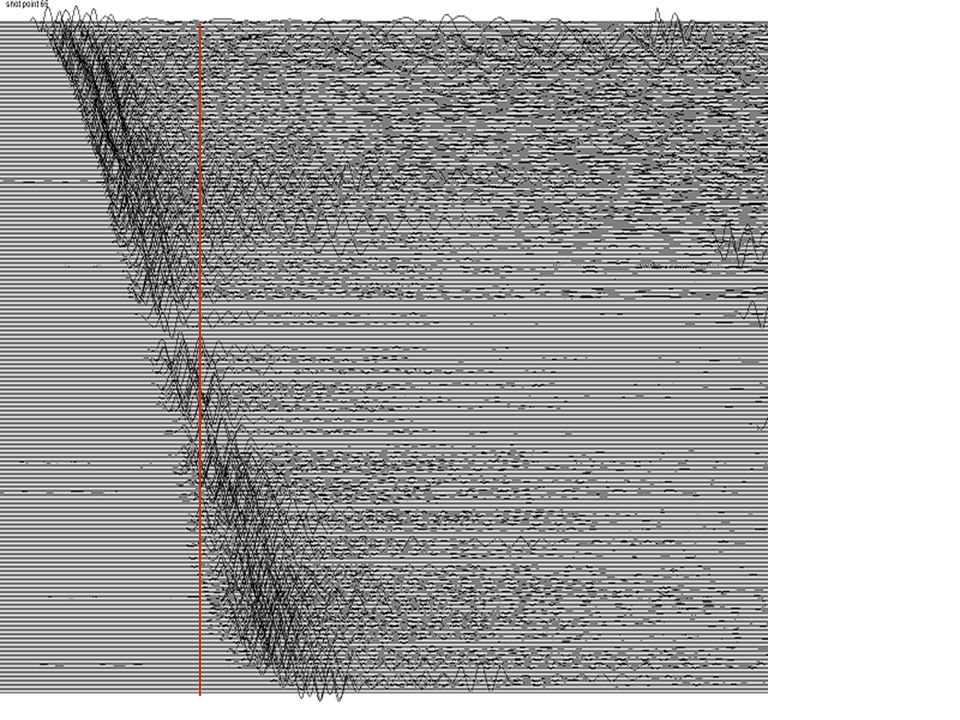
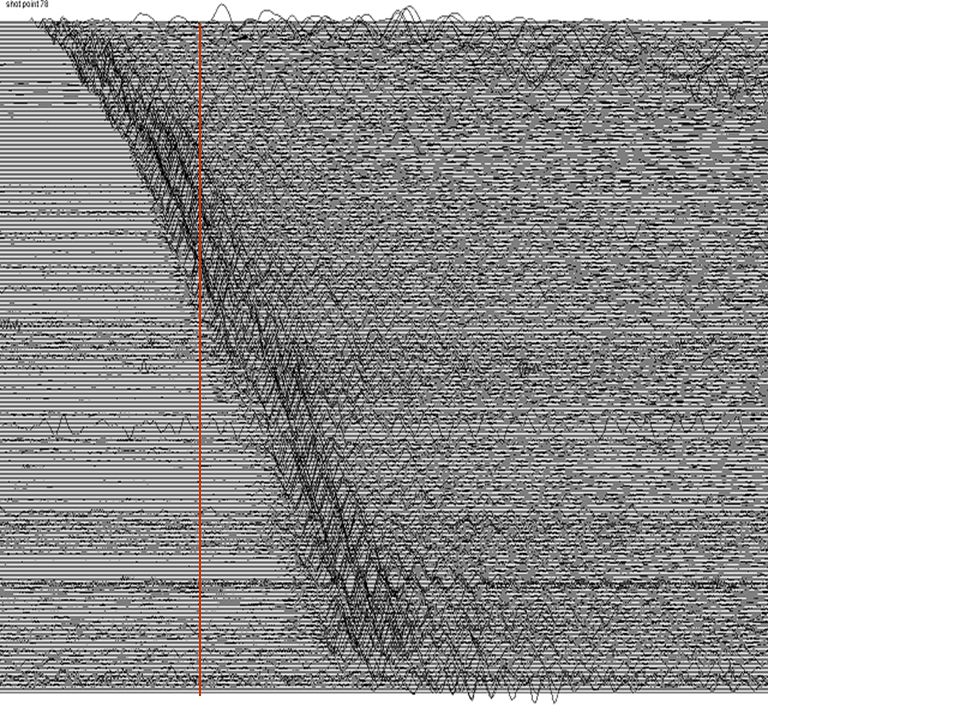
Note the strong, low frequency noise in this upper wedge “I know reflections are buried somewhere!” What’s fascinating below is that the leading refractions may be arriving ahead of any real reflected event. Again we note that the overall zone probably overlaps the target zone. The important point is that, while the nature of the refracted noise is unique to the shot-point, within this spread it is extremely regular and continuous. In the pattern recognition logic used by ADAPS, noise continuity is key. Ground roll myth busted! There is a lot we don’t know, but refraction nesting seems to be patently obvious. As you move through the shot points you’ll notice a drastic difference in the “bend” that occurs in the vicinity of our “toggle please” arrow. We could compute bed velocities from the refraction slopes if we had a more compressed spread So what happens to energy from the shallower refractions when they’re overtaken? If you have an answer, let me know.

16
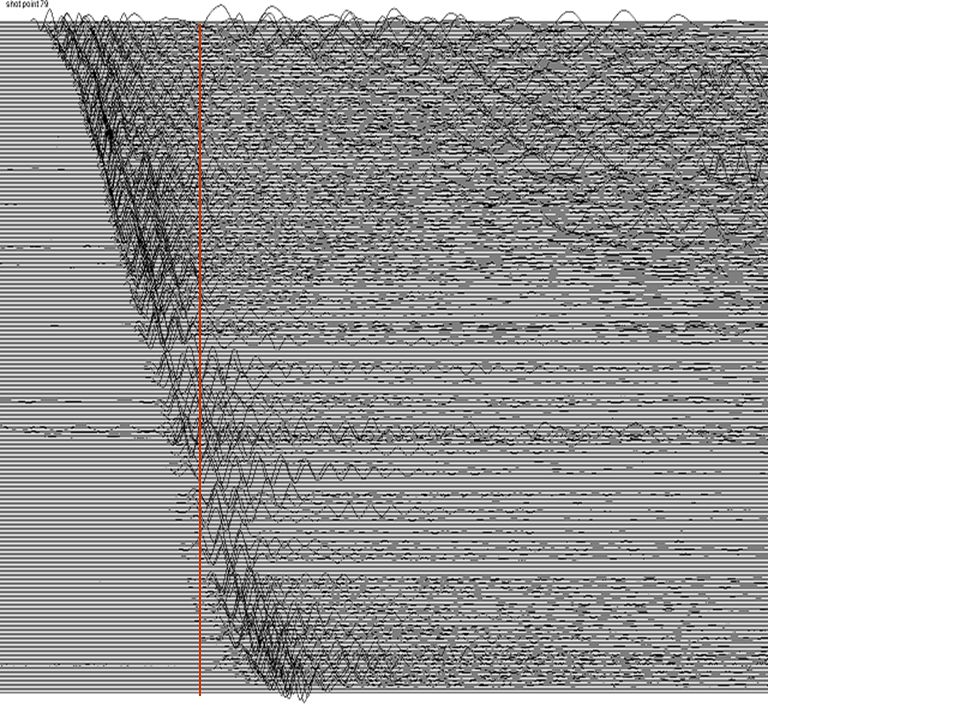
This overlapped series of strong refractions is sitting on top of the target zone. Who knows how much of this energy is getting through the stack?

32
Just another example – If I had not been virtually certain I would find what you have seen I not have spent my dwindling resources on reprocessing this data. In fact I believe that if I made a wild throw at a dart board covered with land projects the odds would be very good that I could hit one where the problem would be just as apparent. I certainly had no way of knowing whether any reef structures would be found, and, at this stage, I still don’t. What I do know now is that one cannot trust the previous processing of this data, and that reef evidence could well appear.I also know that understanding the data problems is an end in itself when it comes to final decision making! My favorite industry icon expresses my feelings after many years of pushing non-linear solutions. Click on this oval to repeat timed series. Or on this one to start at beginning. Or here to go to other shows (allow plenty of time for PowerPoint loading). Or here to join the ADAPS inversion/integration discussion group via email. So – I was around when time series math was conceived. It introduced the beauty of mathematical proof to the seismic world. It was not long before belief became religious in nature, and that has been a tough world for non-linear approaches to challenge. The problem is this rigid mathematical approach does not work in real life situations. Certain basic assumptions are not met because the data matrix is generally far from pure. The primary requirement for linear systems is accurate knowledge of the shape of the down wave as it creates primary reflections. When such routines are pushed too far in a contorted data matrix they become unstable. This is where non-linear tools become necessary. However, because their logic lacks the pretty mathematical proof the industry has become addicted to, they are rejected. This show is an attempt (possibly my last) to show that the existing mathematical theory does not go far enough. As far as I know mine is the only attempt to point out the problems in this area, which goes to my point. This is the kind of topic I would like to see on LinkedIn. Sadly most questions (and answers) I have seen seem trivial compared to the problems I have tried to point out. Most deal with minor variations in results I would not accept.
. Or here to join the ADAPS inversion/integration discussion group via . So – I was around when time series math was conceived. It introduced the beauty of mathematical proof to the seismic world. It was not long before belief became religious in nature, and that has been a tough world for non-linear approaches to challenge. The problem is this rigid mathematical approach does not work in real life situations. Certain basic assumptions are not met because the data matrix is generally far from pure. The primary requirement for linear systems is accurate knowledge of the shape of the down wave as it creates primary reflections. When such routines are pushed too far in a contorted data matrix they become unstable. This is where non-linear tools become necessary. However, because their logic lacks the pretty mathematical proof the industry has become addicted to, they are rejected. This show is an attempt (possibly my last) to show that the existing mathematical theory does not go far enough. As far as I know mine is the only attempt to point out the problems in this area, which goes to my point. This is the kind of topic I would like to see on LinkedIn. Sadly most questions (and answers) I have seen seem trivial compared to the problems I have tried to point out. Most deal with minor variations in results I would not accept..")
Similar presentations


 is a mess of overlapping coherent noise and signal,>")

: Outliers Fall, 2008.>")

. I start with.>")


