Download presentation
Presentation is loading. Please wait.

1
GETTING STARTED !! TA: May Al Mousa Networking and Communication Systems Faculty of computer and information science

2
What is Arena software? Arena software enables you to bring the power of modeling and simulation to your business. It is designed for analyzing the impact of changes involving significant and complex redesigns associated with supply chain, manufacturing, processes, logistics, distribution and warehousing, and service systems. Arena software provides the maximum flexibility and breadth of application coverage to model any desired level of detail and complexity.

3
With Arena, you can: Model your processes to define, document, and communicate. Simulate the future performance of your system to understand complex relationships and identify opportunities for improvement. Visualize your operations with dynamic animation graphics. Analyze how your system will perform in its “as-is” configuration and under a myriad of possible “to-be” alternatives so that you can confidently choose the best way to run your business.

4
Arena Modeling Environment Project Bar Model window (flowchart view) Model window (spreadsheet view)
 Model window (spreadsheet view)")
5
Arena Modeling Environment Project Bar Hosts panels with the primary types of objects that you will work with: Basic Process : Contain the modeling shapes, called modules, that you’ll use to define your process. Reports panel: Contains the reports that are available for displaying results of simulation runs. Navigate panel: Allows you to display different views of your model, including navigating through hierarchical sub models and displaying a model thumbnail view.

6
Arena Modeling Environment Flowchart view: Contain all of your model graphics, including the process flowchart, animation, and other drawing elements. Spreadsheet view: Displays model data, such as times, costs, and other parameters.

7
Our task: Analyze a home mortgage application process

8
Map your process in a flowchart What exactly is it that will flow through the chart? These mortgage applications are the items, referred to as entities, that will move through the process steps in our model. They are the data, whether on paper or in electronic form, that are associated with our client’s request for a mortgage.

9
What are entities? Entities are the items—customers, documents, parts—that are being served, produced, or otherwise acted on by your process. In business processes, they often are documents or electronic records (checks, contracts, applications, purchase orders). In service systems, entities usually are people (the customers being served in a restaurant, hospital, airport, etc.).
. In service systems, entities usually are people (the customers being served in a restaurant, hospital, airport, etc.)..")
10
Create the mortgage application entities:

11
Create module: Every process flow starts with a Create module. When simulating the flowchart, individual entities will be created according to timing information you supply in the Create module properties. After it’s created, each entity moves from the Create module to the next shape in the process flow.

12
Process the applications

14
Decide whether applications are complete

16
1) Initiate mortgage application (Create module)
 Initiate mortgage application (Create module)")
17
Define model data Create module Named Initiate Mortgage Application Data (Entities) Application. Average between applicants as a starting point 2 hours Natural variation random activity to represent the natural variation in the timing of mortgage applications being submitted.

18
Arena & Statistical Distributions Arena contains a set of built-in functions for generating random numbers from the commonly used probability distributions. These distributions appear on pull-down menus in many Arena modules where they’re likely to be used. Each of the distributions in Arena has one or more parameter values associated with it. You must specify these parameter values to define the distribution fully

19
Summary of Arena’s Probability Distributions & Distribution Parameter Values Beta BETA Beta, Alpha Continuous CONT CumP1,Val1,... CumPn,Valn Discrete DISC CumP1,Val1,... CumPn,Valn Erlang ERLA ExpoMean, k Exponential EXPO Mean Gamma GAMM Beta, Alpha Johnson JOHN Gamma, Delta, Lambda, Xi Lognormal LOGN LogMean, LogStd Normal NORM Mean, StdDev Poisson POIS Mean Triangular TRIA Min, Mode, Max Uniform UNIFMin, Max

21
2) Review application (Process module) During the simulation run, each time an entity enters the process, Arena will calculate a sample from the distribution information you’ve provided—in our case, a triangular distribution. Over the course of a long simulation run where thousands of individual samples are taken

25
3) Complete? (Decide module)
 Complete (Decide module)")
26
4) Accepted, Returned (Dispose module)
 Accepted, Returned (Dispose module)")
28
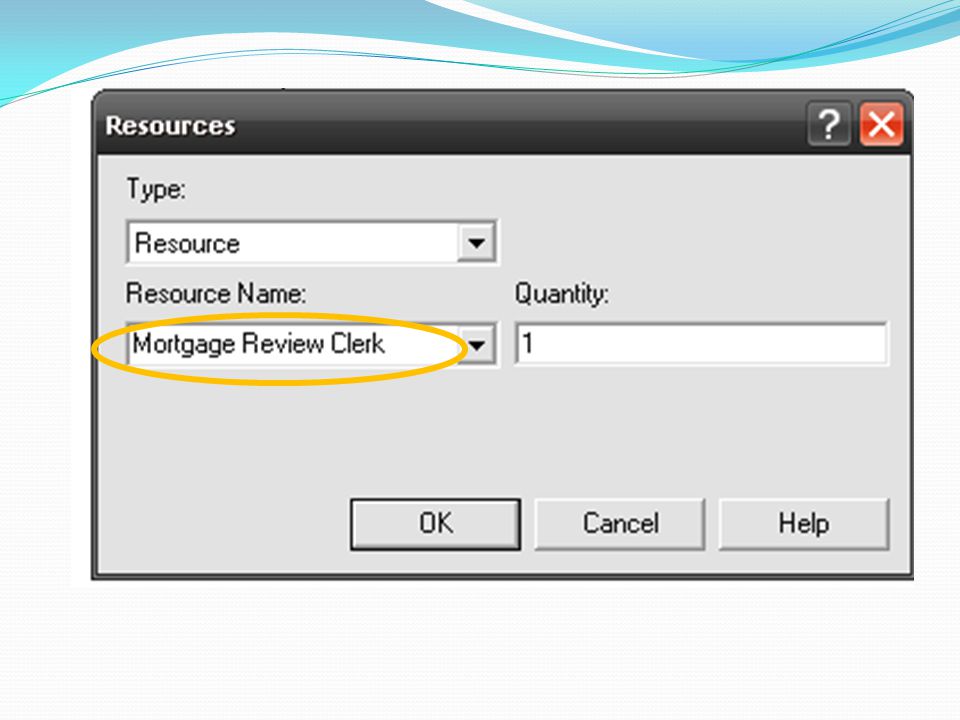
Mortgage review clerk (Resource module) Along with our flowchart, we can define parameters associated with other elements of our model, such as resources, entities, queues.
 Along with our flowchart, we can define parameters associated with other elements of our model, such as resources, entities, queues.")
29
For the mortgage process, we’ll define the cost rate for the Mortgage Review Clerk so that our simulation results will report the cost associated with performing this process Busy/Hour cell // cost rate when the clerk is busy Idle/Hour cell //and assign the idle cost rate

30
Prepare for the simulation To make the model ready for simulation, we’ll specify general project information and the duration of the simulation run. Since we’re just testing our first-cut model, we’ll perform a short, 20-day run Run Setup

33
Save the simulation model File Save

Similar presentations


>")


