Download presentation
Presentation is loading. Please wait.

1
Map Projections and How they are Made
Cartography

2
Additional Study Map Projections: Round Earth, Flat Maps: Page 1

4
Map Projection: From Globe to Map
A map projection is used to portray all or part of the round Earth on a flat surface. This cannot be done without some distortion.

5
Map Projection: From Globe to Map
Every flat map misrepresents the surface of the Earth in some way. No map can rival a globe in truly representing the surface of the entire Earth. However, a map or parts of a map can show one or more—but never all—of the following: True directions True distances True areas True shapes

6
Types of Map Projections
Map Properties . Useful map properties: preserving distances (equidistance) preserving directions preserving shape (conformality) preserving area (equal area) Page 2
 preserving directions. preserving shape (conformality) preserving area (equal area) Page 2.")
7
Types of Map Projections
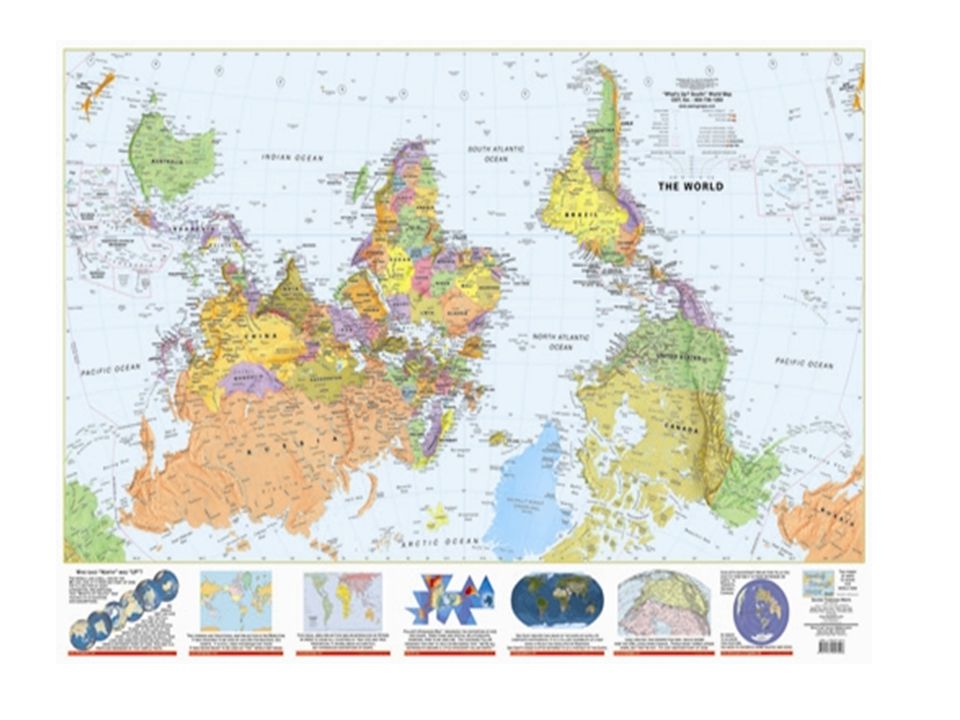
Map Properties What is the largest continent? Most people would say Antarctica. But is it? See Continents by Land Area.

8
Equal-Area Projection Preserving area Mapped areas have the same proportional relationship to the areas on Earth Equal Area Eckert IV and Eckert VI,

9
Equal-Area Projection Preserving area Mapped areas have the same proportional relationship to the areas on Earth Different map projections result in different spatial relationships between regions.

10
Equal-Area Projection Preserving area Mapped areas have the same proportional relationship to the areas on Earth

11
Map Projection: From Globe to Map
A map projection is used to portray all or part of the round Earth on a flat surface. This cannot be done without some distortion.

12
Equidistant Map An equidistant map projection correctly represents distances. Distance between two points are preserved. Distances and directions to all places are true only from the center point of projection. Distances are correct between points along straight lines through the center. All other distances are incorrect. Distortion of areas and shapes increases dramatically, the further away one gets from center point.

13
Equidistant Map Distances are true only from the center point of the projection
Azimuthal Map, Miller’s Cylindrical Projection, Equidistant Conic Projections

14
In this class we will study the Equidistant Azimuthal Map
Equidistant Map Distances are true only from the center point of the projection In this class we will study the Equidistant Azimuthal Map

15
Equidistant Cylindrical Map
Equidistant Map Distances are true only from the center point of the projection Equidistant Cylindrical Map

16
Equidistant Map Distances are true only from the center point of the projection
Equidistant: Equidistant Conic Projections

17
Flat-plane Projection Azimuthal
Another map projection called an Azimuthal Map, is a flat-plane projection. It is very accurate where the 'paper touches the Earth‘. There are no distortions, here. But the further the 'paper' is away from the surface of the Earth the greater distortions.

18
Flat-plane Projection Azimuthal
Math:

19
Flat-plane Projection Azimuthal
Some widely used azimuthal projections are Equidistant azimuthal projection Gnomonic projection Lambert equal-area azimuthal projection Orthographic projection Stereographic projection Universal polar stereographic projection

20
Azimuthal Projections
Azimuthal orthographic map with great circle passing through Campinas, Brazil and Tokyo, Japan

21
Equidistant Map Distances are true only from the center point of the projection
Equidistant: Equidistant Azimuthal Projection Distances and directions to all places are true only from the center point of projection. Distances are correct between points along straight lines through the center. All other distances are incorrect. Distortion of areas and shapes increases dramatically, the further away one gets from center point. This is a great projection for preserving area but get outside the center and shapes become badly distorted.

22
Azimuthal Equidistant
In the north polar aspect, the azimuthal equidistant is familiar as part of both flag and emblem of the United Nations Organization, with olive branches replacing Antarctica. Equal-area – no Equidistant – yes Conformal - no

23
Azimuthal Equidistant
Projection Equidistant Center of map is most accurate Benefits: Shows great circle Distances & direction to all places are true from center point Disadvantages Distortion increase as move away from center Can only show one hemisphere at a time Uses Show water currents and wind pattern Airplane navigation North and South Pole projections

24
Map Projection: From Globe to Map
Preserving area Map Projection: From Globe to Map The earth is round. The challenge of any world map is to represent a round earth on a flat surface. There are literally thousands of map projections. Each has certain strengths and corresponding weaknesses Choosing among them is an exercise in values clarification: you have to decide what's important to you. That is generally determined by the way you intend to use the map.

25
Countries Arguing Over Maps
Mercator Shapes Conformal vs Peters Size Equal-Area vs vs

26
Conformal Maps Preserving shape Meridians and Parallels intersect at right angle
When the scale of a map at any point on the map is the same in any direction, the projection is conformal. Meridians (lines of longitude) and parallels (lines of latitude) intersect at right angles. Shape is preserved locally on conformal maps.
 and parallels (lines of latitude) intersect at right angles. Shape is preserved locally on conformal maps.")
27
Conformal Maps Preserving shape Meridians and Parallels intersect at right angle
Famous Conformal Maps Mercator, Transverse, Oblique Mercator

28
Distorting Circles in all Projection
Page 3. Document Camera

29
Conformal Projections
A conformal map projection preserves the shape but distorts their size. Cylindrical Projection Mercator Projection Mercator’s Projection Cylindrical Conformal- preserves shapes Parallels and meridians are straight lines intersecting at right angles Compass directions are maintained Meridians are equally spaced Parallel spacing increases with distance from Equator Benefits: Preserves angles and shapes One square inch on the map represents an equal number of square miles anywhere in the world. Disadvantages Sizes are increasing distorted (at high latitudes, especially) Uses Navigation , air and marine See the math
 Uses. Navigation , air and marine. See the math.")
30
Conformal Projections
A conformal map projection preserves the shape but distorts their size. Gerardus Mercator ( ). Frontispiece to Mercator's Atlas sive Cosmographicae, Courtesy of the Library of Congress, Rare Book Division, Lessing J. Rosenwald Collection. In the 16th-century Mercator made a map to help navigators . His conformal map desired to preserve shapes of land. This Mercator map is a famous conformal projection. Notice the longitude and latitude lines are straight and at right angles.
. Frontispiece to Mercator s Atlas sive Cosmographicae, Courtesy of the Library of Congress, Rare Book Division, Lessing J. Rosenwald Collection. In the 16th-century Mercator made a map to help navigators . His conformal map desired to preserve shapes of land. This Mercator map is a famous conformal projection. Notice the longitude and latitude lines are straight and at right angles.")
31
Conformal Projections
A conformal map projection preserves the shape but distorts their size. Conformal map projections - each parallel must cross every meridian at right angles.

32
Conformal Projections
A conformal map projection preserves the shape but distorts their size. Many conformal maps are cylindrical projections.

33
Conformal Projections
A conformal map projection preserves the shape of small areas but distorts their size. Because longitudes and latitudes are curved on a globe, converting them to straight lines will cause distortion in size and shape. What are some benefits of this type of map? What are some distortions of this type of map?

34
Conformal Projections
A conformal map projection preserves the shape of small areas but distorts their size.

35
Conformal Projections
A conformal map projection preserves the shape of small areas but distorts their size. The Mercator projection portrays Greenland as larger than Australia; in actuality, Australia is more than three and a half times larger than Greenland. The mapmaker's dilemma is that you cannot show both shape and size accurately. If you want a true shape for the land masses you will necessarily sacrifice proportionality, i.e., the relative sizes will be distorted.

36
Conformal Projections
A conformal map projection preserves the shape but distorts their size. Greenland is much larger than actual size Greenland appears to be the same size as Africa, yet Africa’s land mass is actually 14x larger.

37
Conformal Projections
A conformal map projection preserves the shape but distorts their size. The Mercator projection creates increasing distortions of size as you move away from the equator.

38
Conformal Projections
A conformal map projection preserves the shape but distorts their size. Equator When the Mercator projection was created, the custom among map-makers was to place the map-maker’s country—in this case, Germany—at the center of the map.

39
Conformal Projections
A conformal map projection preserves the shape but distorts their size. Equator It is common to have Antarctica cropped off, resulting in Equator not being in the middle of the map The Equator is placed 2/3 of the way down the map rather than halfway down. This arrangement depicts Europe as being larger than South America. In reality, South America is almost twice the size of Europe. Europe is 3.8 million square miles. South America is 6.9 million square miles.

40
Conformal Projections
A conformal map projection preserves the shape but distorts their size. Alaska is appears to be three times larger than Mexico, although Mexico actually is larger than Alaska. On a Mercator map, Greenland looks larger than China, even though China actually is four times larger than Greenland.

41
Conformal Projections
A conformal map projection preserves the shape but distorts their size. Antarctica is enormously stretched, if it is shown at all. It is common to have Antarctica cropped off, resulting in Equator not being in the middle of the map When Antarctica is not on the map, the equator is not in the center. This places the United States, Europe and Russia as prominent countries.

42
Conformal Projections
A conformal map projection preserves the shape but distorts their size. Northern Hemisphere appears larger than it is Mercator maps seldom extend above the 80°N parallel or below 75°S. Both this apparent shift of the Equator southwards and the areal exaggeration of higher latitudes, which mostly coincide with developed nations, have repeatedly incited disapproval about its supposed bias against the Third World (it was even claimed to aid racial discrimination by promoting a supposed superiority of Europe, the U.S.S.R. or the U.S.A.)
")
43
Conformal Projections
A conformal map projection preserves the shape but distorts their size. Mercator Shapes Conformal vs. Peters Size Equal-Area vs. vs. What do each of these map convey about developed countries vs. developing countries?

44
Conformal Projections
A conformal map projection preserves the shape but distorts their size. The North is 18.9 million square miles. The South is 38.6 million square miles. The former Soviet Union is 8.7 million square miles. Africa is 11.6 million square miles.

45
Conformal Projections
A conformal map projection preserves the shape but distorts their size. Peters Map supporters contend: This was convenient, psychologically and practically, through the eras of colonial domination when most of the world powers were European. It suited them to maintain an image of the world with Europe at the center and looking much larger than it really was. Was this conscious or deliberate? Probably not, as most map users probably never realized the Eurocentric bias inherent in their world view.

46
Conformal Projections
A conformal map projection preserves the shape but distorts their size. These distortions pose significant limitations for any use other than navigation. Mercator projections present a surrealistic view of the world that makes them inappropriate choices for use in classrooms or in any application that compares separate regions of the world.

47
Conformal Projections
A conformal map projection preserves the shape but distorts their size. However, in order to keep shapes undistorted… area of land became distorted. But Mercator did not care. His map was to help navigators get from one place to another. He did not intend for this map to be used for anything else. But because some people did not really know their geography they used this map for education. This created generations of misinformed students! This also led to political pride and arguing between countries. Why?

48
Conformal Projections
A conformal map projection preserves the shape but distorts their size. Benefits: This map is useful for ship and air navigators because it shows true direction and shape. Navigators need to know the shortest route across Earth’s surface between two points. Such a path is called a great circle on the globe’s surface. Distortions: size of land and distances near poles

49
Conformal Projections
Preserving shape locally A conformal map projection preserves the shape but distorts their size. Mercator's projection (created at a time when navigators were sailing on the oceans in wooden ships, powered by the wind, and navigating by the stars) was particularly useful because straight lines on his projection were lines of constant compass bearing. Today the Mercator projection still remains useful for navigational purposes and is referred to by seafarers and airline pilots. Rarely used in world maps nowadays, except by navigators. Rarely used in teaching geography. But Google Maps needs to be informed! They better learn geography and history!
 was particularly useful because straight lines on his projection were lines of constant compass bearing. Today the Mercator projection still remains useful for navigational purposes and is referred to by seafarers and airline pilots. Rarely used in world maps nowadays, except by navigators. Rarely used in teaching geography. But Google Maps needs to be informed! They better learn geography and history!")
50
Map Projection: From Globe to Map
Preserving area Map Projection: From Globe to Map The earth is round. The challenge of any world map is to represent a round earth on a flat surface. There are literally thousands of map projections. Each has certain strengths and corresponding weaknesses Choosing among them is an exercise in values clarification: you have to decide what's important to you. That is generally determined by the way you intend to use the map.

51
ECylindrical Projection Homolosine Projection “Interrupted Map”

52
Equal-Area Projection
Preserving area Equal-Area Projection Dr. Arno Peters sought to create a new world map that dramatically improved the accuracy of how we see the Earth. The Peters Map is a famous equal-area map.

53
Equal-Area Projection
Preserving area Equal-Area Projection A map projection in which quadrilaterals formed by meridians and parallels have an area on the map proportional to their area on the globe. This results in showing area of countries, continents, and oceans – according to their actual area.

54
Equal-Area Projection
Preserving area Equal-Area Projection The Peters projection map was first introduced in Europe in 1974 by Dr. Arno Peters, a German historian and cartographer. Dr. Peters created his projection to aid in developing a realistic perception of the world. His equal-area projection corrects the Northern Hemisphere size bias of the Mercator map. All areas, both land and water, are of relatively proportional size: one square inch anywhere on the map represents 158,000 square miles on the Earth’s surface. Some cartographers contend that the Peters projection wall map is a valuable educational tool because of its realistic portrayal of proportion.

55
Equal-Area Projection
Preserving area Equal-Area Projection Peters said the Mercator projections unfairly shows some countries larger than they are. By making an equal-area map, Peters said his new projection would give poorer, less powerful nations their rightful proportions on a map.

56
Equal-Area Projection
Preserving area Equal-Area Projection However, because the Peters map is cylindrical, just like the Mercator map, it also has distortion in the polar regions. Also, there is considerable distortion along the equator. The midlatitude region is less distorted. Lacks distance accuracy.

57
Conformal Projections
A conformal map projection preserves the shape of small areas but distorts their size.

58
Equal-Area Projection
Preserving area Equal-Area Projection Several scholars have noted the irony of the accuracy on the mid latitudes, including Peters Germany, at the expense of the low latitudes, which is where most of the undeveloped countries are located. Remember… no flat map can be both conformal and equal-area

59
Equal-Area Projection
Preserving area Equal-Area Projection The distances along the 45th parallels north and south are really off. (No world projection is good at preserving distances everywhere.)
")
60
Equal-Area Projection
Preserving area Equal-Area Projection Peters said there should be one map for the world and it should be his. The unscholarly conduct, of Peters, and his refusal to engage cartographers in thoughtful discussion contributed to the polarization and impasse.

61
Equal-Area Projection
Preserving area Equal-Area Projection World mission and aid-giving agencies use the Peters map because it serves to represent the developing countries at their true proportion. The Peters map has been widely adopted elsewhere, but remains a curiosity in the United States. Why is this? Among related factors are these: (1) our resistance to join the rest of the world on the metric system (even the British have changed from inches and Fahrenheit to centimeters and Celsius), (2) national surveys showing U.S. schoolchildren have among the lowest levels of geography awareness of all developed nations, and (3) many professional cartographers have resented the "politicization" of their field. Arno Peters was one of the first to assert that maps are unavoidably political.
 our resistance to join the rest of the world on the metric system (even the British have changed from inches and Fahrenheit to centimeters and Celsius), (2) national surveys showing U.S. schoolchildren have among the lowest levels of geography awareness of all developed nations, and (3) many professional cartographers have resented the politicization of their field. Arno Peters was one of the first to assert that maps are unavoidably political.")
62
Equal-Area Projection
Preserving area Equal-Area Projection In the 1980’s the American Cartographic Association produces a series of booklet (including Which Map is Best) sought to educate the public about map projections and distortion of maps. In 1989 and 1990, after very much debate, seven North American geographic organizations adopted a resolution: They rejected all rectangular world maps, and this included both the Mercator and Peters projections. Other cartographers said these seven North American geographic organization were being reactionary and demonstrated immaturity in the profession, given all maps were political. They said there is good use for both maps.
 sought to educate the public about map projections and distortion of maps. In 1989 and 1990, after very much debate, seven North American geographic organizations adopted a resolution: They rejected all rectangular world maps, and this included both the Mercator and Peters projections. Other cartographers said these seven North American geographic organization were being reactionary and demonstrated immaturity in the profession, given all maps were political. They said there is good use for both maps.")
63
Equal-Area Projection
Preserving area Equal-Area Projection The Peters projection map was featured in the United States television drama The West Wing (season 2, episode 16), where an actor explained to the president (actor) why the Peters map was a proper map for schools. He said it correctly represents the size of the countries and give due prominence to countries in less developed parts of the world their place on the map.
, where an actor explained to the president (actor) why the Peters map was a proper map for schools. He said it correctly represents the size of the countries and give due prominence to countries in less developed parts of the world their place on the map.")
64
Equal-Area Projection
Preserving area Equal-Area Projection The map is also a favorite of military strategist Thomas Barnett, who has included it in his presentations of The Brief, which have aired on C-SPAN in the United States.

65
Equal-Area Projection
Preserving area Equal-Area Projection Is the map used today in other places? Yes, it is the primary map when showing “special purposes” of the world. Equal-area map projections are generally used in studies of large areas to show relative distributions. It is best to have correct area when wanting to compare things like literacy rate, income, pollution, etc, around the world. For example, imagine a display of population density: if each million people are represented by a small dot, then it becomes important that each country appears in relative size to other countries, so that a dense collection of dots means a relatively dense population.

66
Equal-Area Projection
Preserving area Equal-Area Projection Cylindrical Projection Peter’s Projection Cylindrical Equal-Area Benefits: Shows all countries in their true size and proportion One square inch on the map represents an equal number of square miles anywhere in the world. Disadvantages Shapes of countries are distorted. For example, Africa looks as long and thin as South America Uses

67
Countries Arguing Over Maps
The Mercator vs. Peters controversy is truly a moot point. Both maps are rectangular projections and are poor representations of the planet. Ignorant statements like "Only now are the first non-chauvinistic maps being produced without bias to any one region of the earth. They are 'Peters Maps' from Peters Atlas of the World" inflame geographers and cartographers alike because they're lies - all maps show a certain degree of bias but professional map makers have not promoted a politically incorrect map such as Mercator's - it's a silly "debate." Matt Rosenberg

68
Map Projection: From Globe to Map
Preserving area Map Projection: From Globe to Map Is there another equal-area map that may be an option?

69
Map Projection: From Globe to Map
Preserving area Map Projection: From Globe to Map The earth is round. The challenge of any world map is to represent a round earth on a flat surface. There are literally thousands of map projections. Each has certain strengths and corresponding weaknesses Choosing among them is an exercise in values clarification: you have to decide what's important to you. That is generally determined by the way you intend to use the map.

70
Map Projections – How They are Made

71
Map Projections – How They are Made

72
Map Projections – How They are Made
Azimuthal Projections Azimuthal projections result from projecting a spherical surface onto a plane. • Azimuthal equidistant projections are sometimes used to show air-route distances. Distances measured from the center are true. Distortion of other properties increases away from the center point. • The Lambert azimuthal equal-area projection is sometimes used to map large ocean areas. The central meridian is a straight line, others are curved. A straight line drawn through the center point is on a great circle.

Similar presentations


 to carry – Can have special purposes – Scales allow.>")