Download presentation
Presentation is loading. Please wait.

1
Food Price Inflation: Markets, Households and Policy Implications Paul Dorosh (World Bank) Spatial and Local Development Team World Bank February 2008
 Spatial and Local Development Team World Bank February 2008")
2
Summary Cause and likely duration of shocks have implications for policy response Maize and fuel: medium-term price increase? Rice and wheat: short-term price increase? Domestic trade policies can worsen or mitigate effects of world price changes Methodology Where there is general inflation, prices of non-food and nominal incomes are also likely to rise Assuming no change in nominal incomes may overstate effects of food price changes Household effects Demand changes in response to price changes Substantial variation in net food sales among poor farmers Not all poor farmers are food deficit; not all deficit households are poor

5
Outline I.Determination of Market Prices I.Domestic and international prices II.Accounting for macro-economic inflation II.Household Analysis I.Net surplus / net deficit: budget share analysis III.Implications of supply and demand response I.Multi-market analysis II.CGE analysis IV.Policy Implications

6
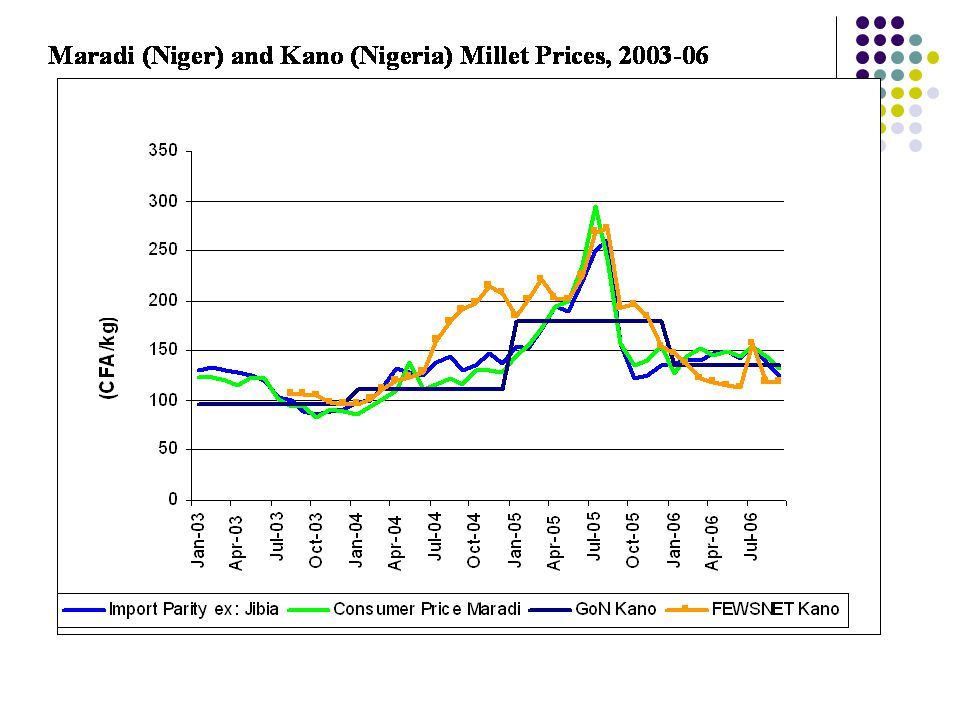
Markets: What Determines the Domestic Price? Comparisons of monthly domestic wholesale prices with import parity (inclusive of taxes and marketing costs) Indicate incentives for private sector trade Provide an indication of whether border prices determine domestic prices (e.g. Bangladesh 1998-99) In some cases, it is not possible to prevent pass-through of border prices to domestic markets (Niger-Nigeria) Domestic prices above import parity border prices in periods of substantial imports suggests the presence of binding quotas (e.g. El Salvador 2007) Domestic prices within import-export band indicate domestic prices not directly affected by world prices In this case, changes in domestic supply and demand determine movements in domestic market prices (Ethiopia maize 2007)
 Indicate incentives for private sector trade Provide an indication of whether border prices determine domestic prices (e.g. Bangladesh ) In some cases, it is not possible to prevent pass-through of border prices to domestic markets (Niger-Nigeria) Domestic prices above import parity border prices in periods of substantial imports suggests the presence of binding quotas (e.g. El Salvador 2007) Domestic prices within import-export band indicate domestic prices not directly affected by world prices In this case, changes in domestic supply and demand determine movements in domestic market prices (Ethiopia maize 2007).")
7
Rice Prices and Quantity of Private Rice Imports in Bangladesh, 1993-2000

9
Quotas can be an important determinant of market prices In Central America, there are substantial imports of cereals from outside the region, but prices are not always at import parity quantitative restrictions (quotas) are important Since start of DR CAFTA (e.g. March 2006 for El Salvador, others later), zero tariff on white maize imports for quantities up to DR CAFTA quota Divergences between import parity and domestic prices indicate quotas are binding: (quotas volumes are less than import demand in absence of quota)
, zero tariff on white maize imports for quantities up to DR CAFTA quota Divergences between import parity and domestic prices indicate quotas are binding: (quotas volumes are less than import demand in absence of quota).")
10
El Salvador: White maize prices and international trade El Salvador: DR CAFTA zero tariff import quota of 35,700 tons; 2006-07 imports: 134,000 tons – “shortfall quotas allow further duty-free imports; otherwise 20% import tariff) March 2006 – April 2007, domestic prices close to import parity (large shortfall quotas – non-binding?) May 2007- September 2007: prices higher than import parity… “shortfall quota was increased but may still be binding Implication: market actors expect supply shortfall (production shortfall with insufficient “shortfall quota” imports)?
 March 2006 – April 2007, domestic prices close to import parity (large shortfall quotas – non-binding ) May September 2007: prices higher than import parity… shortfall quota was increased but may still be binding Implication: market actors expect supply shortfall (production shortfall with insufficient shortfall quota imports)")
11
El Salvador: precios de maiz, 2001-07

12
Madagascar: Rice Prices and Imports, 1995-2004

13
Ethiopia: Maize Border Prices (with Kenya) Notes: Import and export parity ($/ton) estimated using transport and marketing cost of $100/ton between Nairobi, Kenya and Addis. Import parity is calculated without taxes. Source: FEWSNET data and World Bank staff

14
Separating Out Effects of Macro- Inflation Macro-economic inflation caused by increases in money supply in excess of real GDP growth and other factors), by definition, implies an increase in the average price of all goods and services in the economy Food prices will also rise (unless controlled by the government or determined by border prices (with fixed world prices and nominal exchange rates) In the context of macro-economic inflation, understanding what drives domestic prices requires analysis of real prices of food (the nominal price of food relative to a measure of overall inflation)
, by definition, implies an increase in the average price of all goods and services in the economy Food prices will also rise (unless controlled by the government or determined by border prices (with fixed world prices and nominal exchange rates) In the context of macro-economic inflation, understanding what drives domestic prices requires analysis of real prices of food (the nominal price of food relative to a measure of overall inflation)")
15
Nominal and Real Prices Overall price inflation confounds interpretation of nominal market prices; since most or all prices and incomes are rising: Increases in nominal prices do not necessarily indicate increases in demand relative to supply Increases in nominal incomes do not necessarily indicate increases in purchasing power or welfare Difficulty in interpreting price signals are one of the costs of inflation; other costs include loss of welfare to those with incomes in nominal terms and to those who are holding cash

16
Nominal and Real Prices (2) Standard neo-classical micro-economic theory: only relative prices matter Consumer demand: if all prices and incomes are doubled, quantity of consumed of each good and service is unchanged (homogeneity of degree zero in prices and income) Production: prices of all outputs and factor inputs double than profit-maximizing levels of output are unchanged (homogeneity of degree zero in input and output prices) Appropriate deflator for demand analysis is the overall consumer price index: Pi / CPI
 Standard neo-classical micro-economic theory: only relative prices matter Consumer demand: if all prices and incomes are doubled, quantity of consumed of each good and service is unchanged (homogeneity of degree zero in prices and income) Production: prices of all outputs and factor inputs double than profit-maximizing levels of output are unchanged (homogeneity of degree zero in input and output prices) Appropriate deflator for demand analysis is the overall consumer price index: Pi / CPI")
17
Ethiopia Food Price Inflation The Ethiopian context High overall inflation Large increases in food prices Substantial increases in food production Are markets working well? How would we know? Nominal vs real food prices Time frame for the analysis: annual price changes vs monthly price fluctuations

18
Are Markets Performing Well? The food price puzzle: production increases with price increases Step 1: Analyze real prices (nominal prices divided by an appropriate price index) to remove the effects of overall inflation Step 2: Compute total supply, shifts in demand, and expected changes in real prices Step 3: Compare with actual real price movements Time frame for analysis: 1 crop marketing year
 to remove the effects of overall inflation Step 2: Compute total supply, shifts in demand, and expected changes in real prices Step 3: Compare with actual real price movements Time frame for analysis: 1 crop marketing year.")
19
Real price trends, 2000 - 2007 Notes: EGTE wholesale cereal prices (Addis) deflated using CSA Consumer Price Index.
 deflated using CSA Consumer Price Index.")
20
Basic Model Equations Demand (Consumption): D i = α0 i * C0 i *(P i /P0 i )**ED ii * (P j /P0 j )**ED ij * (Y/Y0)**EDY i Production: X i = X i (Exogenous Production) Supply: S i = X i – LOSS i + ChGovStk i + M i - E i Market Clearing: S i = D i
: D i = α0 i * C0 i *(P i /P0 i )**ED ii * (P j /P0 j )**ED ij * (Y/Y0)**EDY i Production: X i = X i (Exogenous Production) Supply: S i = X i – LOSS i + ChGovStk i + M i - E i Market Clearing: S i = D i")
21
Medium-term Cereal Supply, Demand and Real Prices Production of teff, wheat and maize increased by 14, 17 and 15 percent, respectively between 2003/04 and 2005/06 (trend growth rates). Net supply of wheat grew by an average of 11 percent since net imports declined over this period Estimated demand for these foods rose by about 9 percent per year due to population growth and per capita income growth

22
Medium-term Cereal Supply, Demand and Real Prices With supply increasing faster than demand, model simulations show real price declines of all three cereals of magnitudes similar to those actually observed More refined simulations are needed to take into account effects of differential income growth across households (especially urban and rural)
")
23
Trend Growth in Supply, Demand and Real Prices of Major Cereals, 2003/04 to 2005/06 Note: Simulations do not include cross-price effects or effects of rural- urban income growth differentials * Denotes simulated variable. Source: Model simulations.

24
S0S1 D0 Quantity1,015 812 1,985 1,136 1,263 973 61100 Price (kw/kg) Zambia Maize Market: Short-run Impacts of Drought (with Food Aid) Pm P1 P0
 Zambia Maize Market: Short-run Impacts of Drought (with Food Aid) Pm P1 P0")
25
Zambia: Simulated Effects of Drought on Poor Households BaseSimulation 1 1a. No Imports 1b. Cassava 1c. Private Imports Production (‘000 tons) 1,015 - 20% P (maize)(K/kg) 1,136 +75% +11% Consumption of Poor Households (‘000 tons, maize equivalents) Maize507384 481 Cassava119 151124 Total687503535606 Shortfall01239120
 1, % P (maize)(K/kg) 1, % +11% Consumption of Poor Households (‘000 tons, maize equivalents) Maize Cassava Total Shortfall")
26
Madagascar: Net consumers and poor are not synonymous Source: Coady, Dorosh and Minten, 2008

27
Other Analyses Household survey analyses Vulnerability analyses Multi-market model Multiple regions, households, commodities Computable General Equilibrium Major data and analytical requirements Best where shocks are large relative to overall economy

28
Summary Cause and likely duration of shocks have implications for policy response Maize and fuel: medium-term price increase? Rice and wheat: short-term price increase? Domestic trade policies can worsen or mitigate effects of world price changes Methodology Where there is general inflation, prices of non-food and nominal incomes are also likely to rise Assuming no change in nominal incomes may overstate effects of food price changes Household effects Demand changes in response to price changes Substantial variation in net food sales among poor farmers Not all poor farmers are food deficit; not all deficit households are poor

Similar presentations


 Food and Agriculture Organization of the United Nations How did international price movements affect.>")


 By Gregory Mankiw 6th edition.>")


