Download presentation
Presentation is loading. Please wait.

1
Understanding heap data Using Windows Performance Analyzer

3
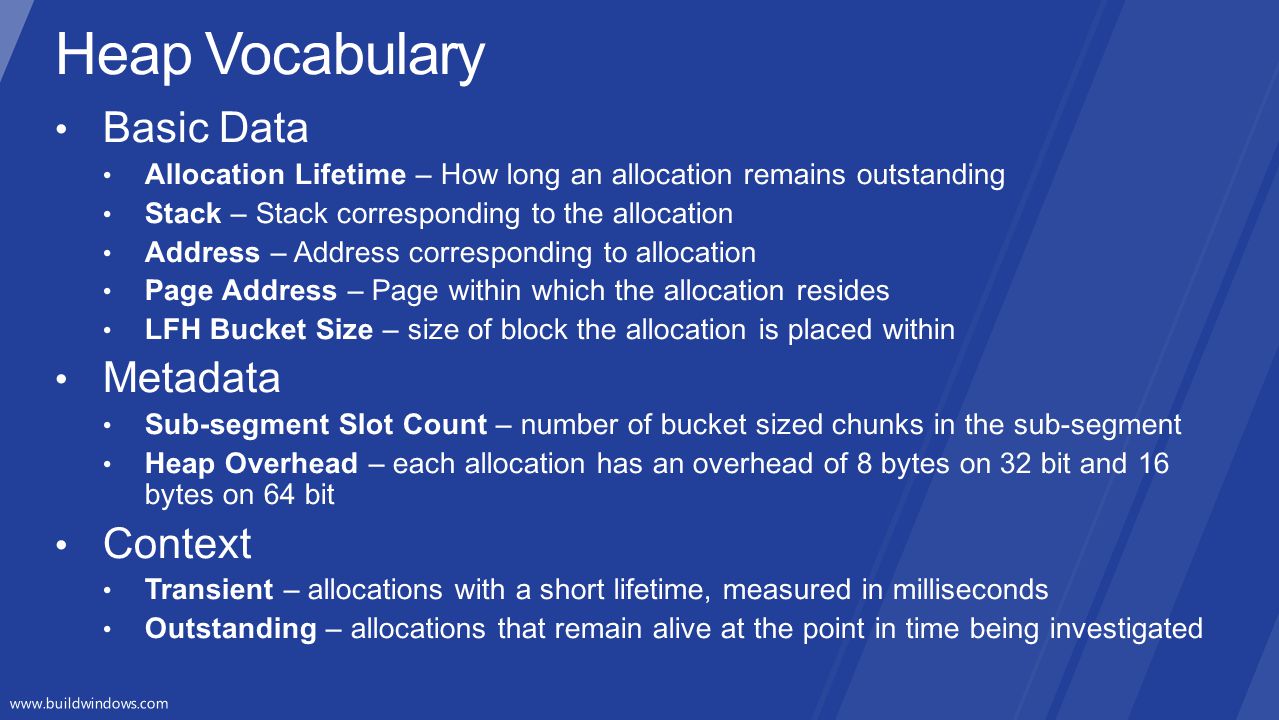
Heap Overview

4
Services allocation requests of all sizes < 64 KB, until allocation thresholds are reached Mainline (NT Heap) Composed of sub-segments that service allocation requests using fixed size blocks once allocation thresholds are met Low Fragmentation Heap (LFH) All allocation requests above 64 KB are serviced using VirtualAlloc VirtualAlloc
 Composed of sub-segments that service allocation requests using fixed size blocks once allocation thresholds are met Low Fragmentation Heap (LFH) All allocation requests above 64 KB are serviced using VirtualAlloc VirtualAlloc")
6
Heap Data Collection and Analysis

8
Windows Performance Recorder UI

12
Demo

13
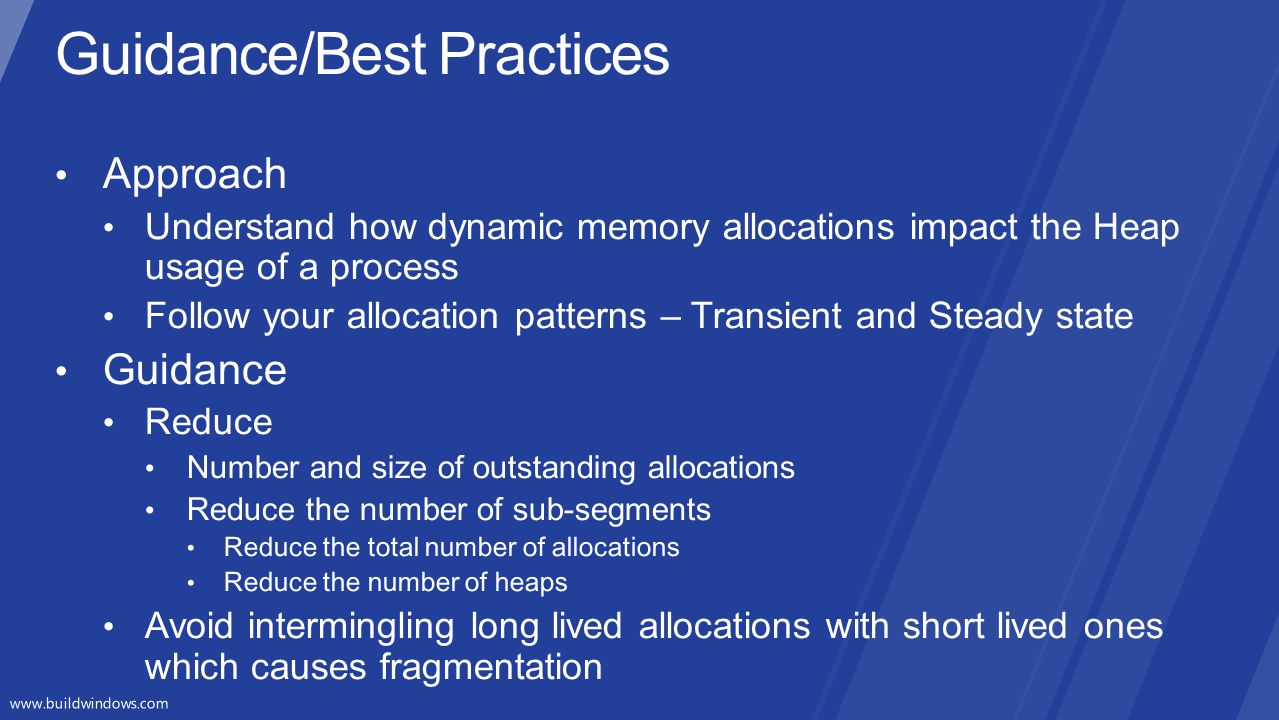
Guidelines and Best Practices

16
RELATED SESSIONS HW-59T Improving performance with the Windows Performance Toolkit HW-141T Reducing the memory footprint of drivers and apps HW-927P Understanding pool usage using Windows Performance Analyzer HW-977P Understanding VirtualAlloc usage using Windows Performance Analyzer HW-925P Customizing WPA Trace Views HW-926P Introduction to the new WPA Uuser interface

Similar presentations


>")

 –less processing power than desktop PCs –quick turnaround expected –limited.>")


 Memory problems are one of.>")


