Download presentation
Presentation is loading. Please wait.

1
Calculus Lesson 1.1 Part 3 of 3

2
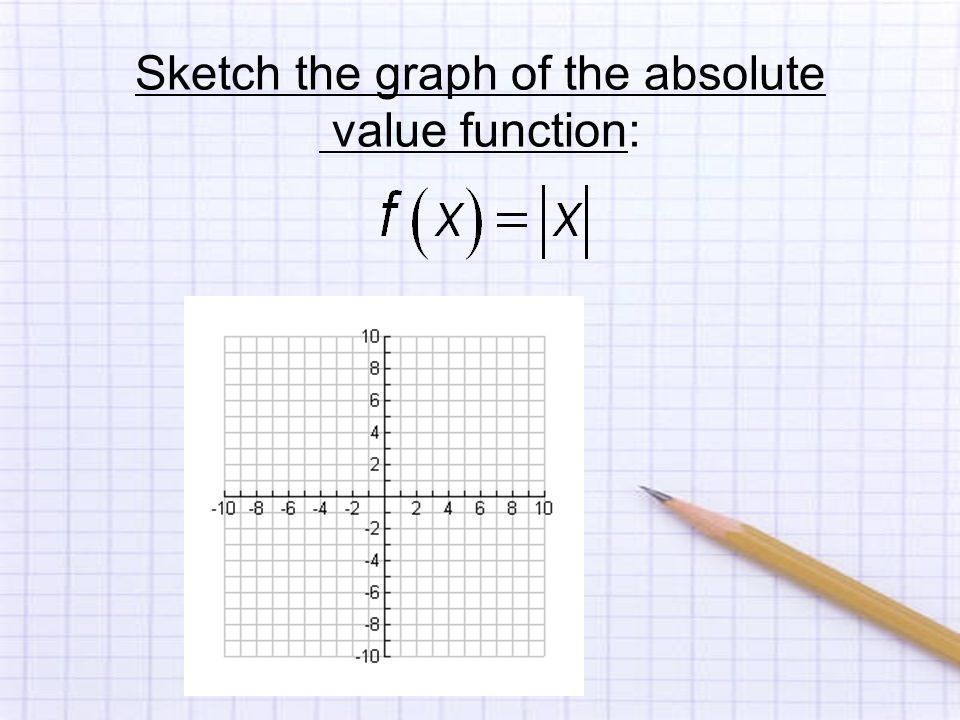
Sketch the graph of the absolute value function:

4
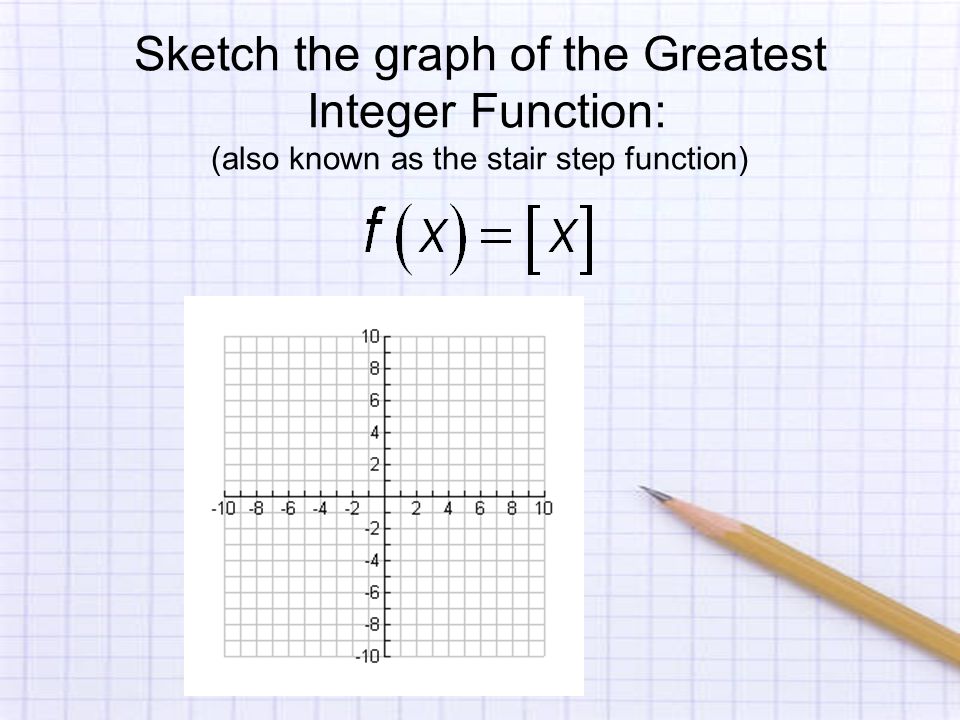
Sketch the graph of the Greatest Integer Function: (also known as the stair step function)
")
7
If a function f satisfies the rule f(-x) = f(x) for every member of x in its domain, then f is called an even function. (Figure 19)
.")
8
The geometric significance is that an even function is symmetric with respect to the y-axis.

9
If f satisfies f(-x) = -f(x), then f is called an odd function. (Figure 20)
 = -f(x), then f is called an odd function. (Figure 20)")
10
If f satisfies f(-x) = -f(x), then f is called an odd function. (Figure 20) The graph of an odd function is symmetric about the origin.
 The graph of an odd function is symmetric about the origin..")
11
Determine whether each of the following functions is even, odd, or neither.

13
The graph in figure 22 rises from A to B, falls from B to C, and rises again from C to D. The function f is said to be increasing on the interval [a,b], decreases from [b,c], and increases again from [c,d].

14
Assignment: Pg. 22 #41, 43, 44, 49, 50, 51, 57, 61, 65, 67

Similar presentations


 = f(x) Graph is symmetric with respect to the y-axis.>")


 A function is continuous.>")


 1.>")
 on the graph, the point (-x, y) is also on the graph.>")


, 47, 49, 51.>")


![Section 1.3 – More on Functions. On the interval [-10, -5]: The maximum value is 9. The minimum value is –9. -10 and –6 are zeroes of the function.](/25/8027872/big_thumb.jpg "Section 1.3 – More on Functions. On the interval [-10, -5]: The maximum value is 9. The minimum value is –9. -10 and –6 are zeroes of the function.>")
, (2,4), (1,-3) Function- For each x-value,>")
