Download presentation
Presentation is loading. Please wait.

1
Chapter 20 Testing Hypotheses about Proportions

2
Hypothesis Testing: used to assess the evidence provided by data in favor of some claim about the population. We are trying to prove something (H a ) has changed compared to what it was before (H o )
 has changed compared to what it was before (H o ).")
4
H a can be one sided or two sided. If H a is one sided, then we test to see if the true proportion is either larger or smaller than the claim.. This is also referred to as a one-tailed test. If H a is two sided, then we test to see if the true proportion is different than the claim. This is also referred to as a two-tailed test.

6
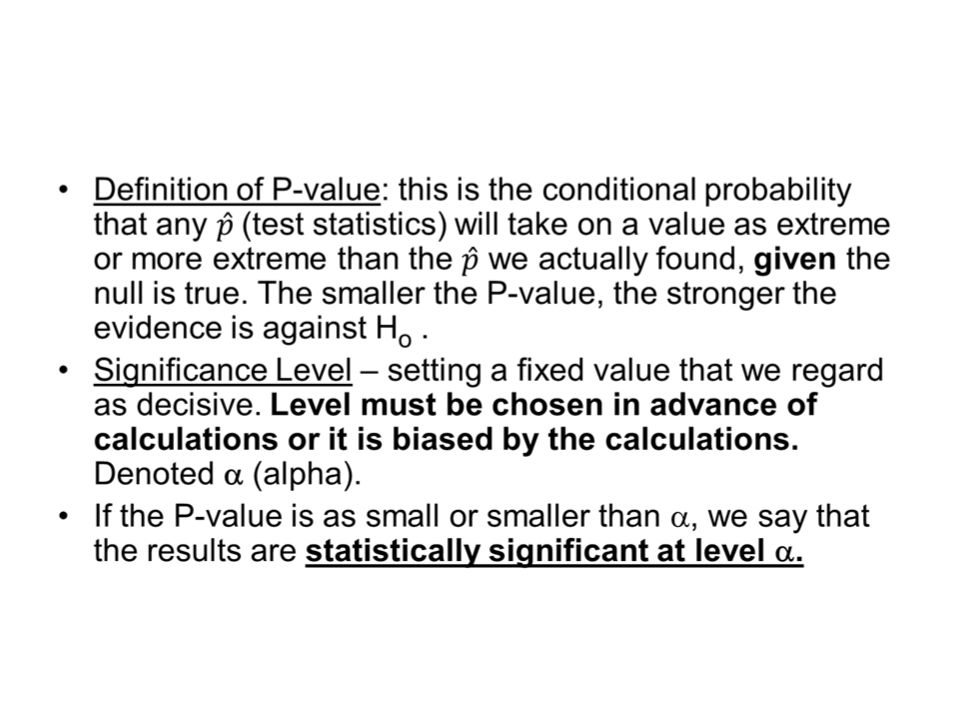
Common Steps to all Significance Tests: 1) State Ho and Ha. 2) Specify significance level, . 3) Identify correct test and conditions. 4) Calculate the value of the test statistic 5) Find the P-value for the observed data (If the P-value is less than or = to , the test result is “statistically significant at level .) 6) Answer the question in context.
 Specify significance level, . 3) Identify correct test and conditions. 4) Calculate the value of the test statistic 5) Find the P-value for the observed data (If the P-value is less than or = to , the test result is statistically significant at level .) 6) Answer the question in context..")
7
In general for Hypothesis Testing: Standardized test statistic: statistic – parameter______ standard deviation of statistic (look familiar? It should, it’s just z!)
.")
8
Specific Formula for a proportion Test Statistic for a proportion:

9
Conditions again… Conditions are the same as those for confidence intervals of proportions and for all categorical data. I am not typing them again.

10
To write a set of hypotheses, Ho: p = p o (the pop. proportion is the true center) and one of the following: Ha : p > p o (seeks evidence that the pop. prop is larger) Ha: p < p o (seeks evidence that the pop. prop is smaller) Ha: p p o (seeks evidence that the pop. prop is different) (p o is replaced with a numerical value of interest)
 and one of the following: Ha : p > p o (seeks evidence that the pop. prop is larger) Ha: p < p o (seeks evidence that the pop. prop is smaller) Ha: p p o (seeks evidence that the pop. prop is different) (p o is replaced with a numerical value of interest).")
11
A few things to remember… *Don’t base your null hypotheses on what you see in the data. You must always think about the situation you are investigating and make your null hypothesis describe the “nothing interesting” or “nothing has changed” scenario. No peeking at the data! * Don’t base your alternative hypotheses on what you see in the data either. You must again think about the situation you are investigating and decide on your alternative based on what results would be of interest to you, not what you might see in the data. * Don’t make your null hypothesis what you want to show to be true. Remember, the null is the status quo, the “nothing is strange here” position. You wonder whether the data casts doubt on that.

12
And when you write your conclusion… You can reject the null hypothesis, but you can never “accept” or “prove” the null. (Proving the null was never your intention. We take for granted it is true from the start but we never prove it.)
.")
13
Example 1 The manufacturer of a particular brand of microwave popcorn claims that only 2% of its kernels of corn fail to pop. A competitor, believing that the actual percentage is larger, tests 2000 kernels and finds that 44 failed to pop. Do these results provide sufficient evidence to support the competitor’s belief?

14
Example 2 Shaquille O’Neal of the Los Angeles Lakers, the NBA’s most valuable player for the 2000 season, showed a significant weakness in free throw shooting, shooting only 53.3% from the free throw line. During the off season after 2000, Shaq worked with assistant coach Tex Winter on his free throw technique. During the first two games of the next season, Shaq made 26 out of 39 free throws. Do these results provide evidence that Shaq has improved his free throw shooting?

15
Example 3 About 10% of the adult population is left handed. Suppose that a researcher speculates that artists are more likely to be left handed than are other people in the general population. The researcher surveys 150 artists and finds that 18 of them are left handed. Is this sufficient evidence to support the researchers claim?

16
Example 4 Harley Davidson motorcycles make up 14% of all motorcycles registered in the United States. In 1995, 9224 motorcycles were reported stolen and 2490 of those were Harleys. If we consider the 9224 stolen motorcycles a random sample of all motorcycles ever stolen, is there evidence that Harley Davidson motorcycles are more likely to be stolen than other motorcycles?

17
Example 5 The American Scientist (Sept/Oct 1998) reported that a survey indicated that nearly half of American adults did not know that the sun is a star. Suppose that 1000 adults were sampled and 52.5 percent know that the sun is a star. Would this constitute sufficient evidence at the 0.05 level to conclude that more than 50% of American adults are aware of this fact?

Similar presentations


 © 2006 Prentice-Hall, Inc. Chap 9-1 Chapter 9 Fundamentals of Hypothesis Testing: One-Sample Tests Business Statistics,>")


