Download presentation
Presentation is loading. Please wait.

1
Behavioral Economics and Aging David Laibson Harvard University and NBER July 8, 2009 RAND

2
1. Motivating Experiments A Thought Experiment Would you like to have A)15 minute massage now or B) 20 minute massage in an hour Would you like to have C) 15 minute massage in a week or D) 20 minute massage in a week and an hour
15 minute massage now or B) 20 minute massage in an hour Would you like to have C) 15 minute massage in a week or D) 20 minute massage in a week and an hour.")
3
Read and van Leeuwen (1998) Time Choosing TodayEating Next Week If you were deciding today, would you choose fruit or chocolate for next week?
 Time Choosing TodayEating Next Week If you were deciding today, would you choose fruit or chocolate for next week")
4
Patient choices for the future: Time Choosing TodayEating Next Week Today, subjects typically choose fruit for next week. 74% choose fruit

5
Impatient choices for today: Time Choosing and Eating Simultaneously If you were deciding today, would you choose fruit or chocolate for today?

6
Time Inconsistent Preferences: Time Choosing and Eating Simultaneously 70% choose chocolate

7
Read, Loewenstein & Kalyanaraman (1999) Choose among 24 movie videos Some are “low brow”: Four Weddings and a Funeral Some are “high brow”: Schindler’s List Picking for tonight: 66% of subjects choose low brow. Picking for next Wednesday: 37% choose low brow. Picking for second Wednesday: 29% choose low brow. Tonight I want to have fun… next week I want things that are good for me.

8
Extremely thirsty subjects McClure, Ericson, Laibson, Loewenstein and Cohen (2007) Choosing between, juice now or 2x juice in 5 minutes 60% of subjects choose first option. Choosing between juice in 20 minutes or 2x juice in 25 minutes 30% of subjects choose first option. We estimate that the 5-minute discount rate is 50% and the “long-run” discount rate is 0%. Ramsey (1930s), Strotz (1950s), & Herrnstein (1960s) were the first to understand that discount rates are higher in the short run than in the long run.
, Strotz (1950s), & Herrnstein (1960s) were the first to understand that discount rates are higher in the short run than in the long run..")
9
Conceptual Outline People are not internally consistent decision-makers Internal conflicts can be modeled and measured Early understanding of the neural foundations Scalable, inexpensive policies can transform behavior

10
Outline 1.Motivating experimental evidence 2.Theoretical framework 3.Field evidence 4.Neuroscience foundations 5.Neuroimaging evidence 6.Policy discussion 7. The age of reason A copy of these slides will soon be available on my Harvard website.

11
2. Theoretical Framework Classical functional form: exponential functions. D(t) = t D(t) = 1, U t = u t + u t+1 u t+2 u t+3 But exponential function does not show instant gratification effect. Discount function declines at a constant rate. Discount function does not decline more quickly in the short-run than in the long-run.
 = t D(t) = 1, U t = u t + u t+1 u t+2 u t+3 But exponential function does not show instant gratification effect. Discount function declines at a constant rate. Discount function does not decline more quickly in the short-run than in the long-run..")
12
Constant rate of decline -D'(t)/D(t) = rate of decline of a discount function
/D(t) = rate of decline of a discount function")
13
Rapid rate of decline in short run Slow rate of decline in long run

14
An exponential discounting paradox. Suppose people discount at least 1% between today and tomorrow. Suppose their discount functions were exponential. Then 100 utils in t years are worth 100*e (-0.01)*365*t utils today. What is 100 today worth today? 100.00 What is 100 in a year worth today? 2.55 What is 100 in two years worth today? 0.07 What is 100 in three years worth today? 0.00
*365*t utils today. What is 100 today worth today What is 100 in a year worth today What is 100 in two years worth today What is 100 in three years worth today")
15
An Alternative Functional Form Quasi-hyperbolic discounting (Phelps and Pollak 1968, Laibson 1997) D(t) = 1, U t = u t + u t+1 u t+2 u t+3 U t = u t + u t+1 u t+2 u t+3 uniformly discounts all future periods. exponentially discounts all future periods. For continuous time: see Barro (2001), Luttmer and Marriotti (2003), and Harris and Laibson (2009)
, Luttmer and Marriotti (2003), and Harris and Laibson (2009).")
16
Building intuition To build intuition, assume that = ½ and = 1. Discounted utility function becomes U t = u t + ½ u t+1 u t+2 u t+3 Discounted utility from the perspective of time t+1. U t+1 = u t+1 + ½ u t+2 u t+3 Discount function reflects dynamic inconsistency: preferences held at date t do not agree with preferences held at date t+1.

17
Application to massages = ½ and = 1 A 15 minutes now B 20 minutes in 1 hour C 15 minutes in 1 week D 20 minutes in 1 week plus 1 hour NPV in current minutes 15 minutes now 10 minutes now 7.5 minutes now 10 minutes now

18
Application to massages = ½ and = 1 A 15 minutes now B 20 minutes in 1 hour C 15 minutes in 1 week D 20 minutes in 1 week plus 1 hour NPV in current minutes 15 minutes now 10 minutes now 7.5 minutes now 10 minutes now

19
Exercise Assume that = ½ and = 1. Suppose exercise (current effort 6) generates delayed benefits (health improvement 8). Will you exercise? Exercise Today: -6 + ½ [8] = -2 Exercise Tomorrow: 0 + ½ [-6 + 8] = +1 Agent would like to relax today and exercise tomorrow. Agent won’t follow through without commitment.
 generates delayed benefits (health improvement 8). Will you exercise. Exercise Today: -6 + ½ [8] = -2 Exercise Tomorrow: 0 + ½ [-6 + 8] = +1 Agent would like to relax today and exercise tomorrow. Agent won’t follow through without commitment..")
20
3. Field Evidence Della Vigna and Malmendier (2004, 2006) Average cost of gym membership: $75 per month Average number of visits: 4 Average cost per vist: $19 Cost of “pay per visit”: $10
 Average cost of gym membership: $75 per month Average number of visits: 4 Average cost per vist: $19 Cost of pay per visit : $10.")
21
Choi, Laibson, Madrian, Metrick (2002) Self-reports about undersaving. Survey Mailed to 590 employees (random sample) Matched to administrative data on actual savings behavior
 Matched to administrative data on actual savings behavior.")
22
22 Typical breakdown among 100 employees Out of every 100 surveyed employees 68 self-report saving too little 24 plan to raise savings rate in next 2 months 3 actually follow through

23
Laibson, Repetto, and Tobacman (2007) Use MSM to estimate discounting parameters: –Substantial illiquid retirement wealth: W/Y = 3.9. –Extensive credit card borrowing: 68% didn’t pay their credit card in full last month Average credit card interest rate is 14% Credit card debt averages 13% of annual income –Consumption-income comovement: Marginal Propensity to Consume = 0.23 (i.e. consumption tracks income)
.")
24
LRT Simulation Model Stochastic Income Lifecycle variation in labor supply (e.g. retirement) Social Security system Life-cycle variation in household dependents Bequests Illiquid asset Liquid asset Credit card debt Numerical solution (backwards induction) of 90 period lifecycle problem.
 Social Security system Life-cycle variation in household dependents Bequests Illiquid asset Liquid asset Credit card debt Numerical solution (backwards induction) of 90 period lifecycle problem..")
25
LRT Results: U t = u t + u t+1 u t+2 u t+3 = 0.70 (s.e. 0.11) = 0.96 (s.e. 0.01) Null hypothesis of = 1 rejected (t-stat of 3). Specification test accepted. Moments: Empirical Simulated (Hyperbolic) %Visa: 68%63% Visa/Y: 13%17% MPC: 23%31% f(W/Y): 2.62.7
 = 0.96 (s.e. 0.01) Null hypothesis of = 1 rejected (t-stat of 3). Specification test accepted. Moments: Empirical Simulated (Hyperbolic) %Visa: 68%63% Visa/Y: 13%17% MPC: 23%31% f(W/Y):")
26
Kaur, Kremer, and Mullainathan (2009): Compare two piece-rate contracts: 1.Linear piece-rate contract (“Control contract”) –Earn w per unit produced 2.Linear piece-rate contract with penalty if worker does not achieve production target T (“Commitment contract”) –Earn w for each unit produced if production>=T, earn w/2 for each unit produced if production<T T Earnings Production Never earn more under commitment contract May earn much less
: Compare two piece-rate contracts: 1.Linear piece-rate contract ( Control contract ) –Earn w per unit produced 2.Linear piece-rate contract with penalty if worker does not achieve production target T ( Commitment contract ) –Earn w for each unit produced if production>=T, earn w/2 for each unit produced if production<T T Earnings Production Never earn more under commitment contract May earn much less")
27
Kaur, Kremer, and Mullainathan (2009): Demand for Commitment (non-paydays) –Commitment contract (Target>0) chosen 39% of the time –Workers are 11 percentage points more likely to choose commitment contract the evening before Effect on Production (non-paydays) –Being offered contract choice increases average production by 5 percentage points relative to control –Implies 13 percentage point productivity increase for those that actually take up commitment contract –No effects on quality of output (accuracy) Payday Effects (behavior on paydays) –Workers 21 percentage points more likely to choose commitment (Target>0) morning of payday –Production is 5 percentage points higher on paydays
: Demand for Commitment (non-paydays) –Commitment contract (Target>0) chosen 39% of the time –Workers are 11 percentage points more likely to choose commitment contract the evening before Effect on Production (non-paydays) –Being offered contract choice increases average production by 5 percentage points relative to control –Implies 13 percentage point productivity increase for those that actually take up commitment contract –No effects on quality of output (accuracy) Payday Effects (behavior on paydays) –Workers 21 percentage points more likely to choose commitment (Target>0) morning of payday –Production is 5 percentage points higher on paydays")
28
Some other field evidence Ashraf and Karlan (2004): commitment savings Della Vigna and Paserman (2005): job search Duflo (2009): immunization Duflo, Kremer, Robinson (2009): commitment fertilizer Karlan and Zinman (2009): commitment to stop smoking Milkman et al (2008): video rentals return sequencing Oster and Scott-Morton (2005): magazine marketing/sales Sapienza and Zingales (2008,2009): procrastination Thornton (2005): HIV testing Trope & Fischbach (2000): commitment to medical adherence Wertenbroch (1998): individual packaging
: commitment savings Della Vigna and Paserman (2005): job search Duflo (2009): immunization Duflo, Kremer, Robinson (2009): commitment fertilizer Karlan and Zinman (2009): commitment to stop smoking Milkman et al (2008): video rentals return sequencing Oster and Scott-Morton (2005): magazine marketing/sales Sapienza and Zingales (2008,2009): procrastination Thornton (2005): HIV testing Trope & Fischbach (2000): commitment to medical adherence Wertenbroch (1998): individual packaging")
29
Small immediate rewards: Thornton (2005) Dollar reward for picking up results
 Dollar reward for picking up results")
30
Small immediate costs: Thornton (2005) Randomized distance (miles) to pick up info Fraction picking up info on HIV status
 Randomized distance (miles) to pick up info Fraction picking up info on HIV status")
31
4. Neuroscience Foundations What is the underlying mechanism? Why are our preferences inconsistent? Is it adaptive? How should it be modeled? Does it arise from a single time preference mechanism (e.g., Herrnstein’s reward per unit time)? Or is it the resulting of multiple systems interacting (Shefrin and Thaler 1981, Bernheim and Rangel 2004, O’Donoghue and Loewenstein 2004, Fudenberg and Levine 2004)?
. Or is it the resulting of multiple systems interacting (Shefrin and Thaler 1981, Bernheim and Rangel 2004, O’Donoghue and Loewenstein 2004, Fudenberg and Levine 2004) .")
32
Shiv and Fedorikhin (1999) Cognitive burden/load is manipulated by having subjects keep a 2-digit or 7-digit number in mind as they walk from one room to another On the way, subjects are given a choice between a piece of cake or a fruit-salad Processing burden% choosing cake Low (remember only 2 digits)41% High (remember 7 digits)63%
 Cognitive burden/load is manipulated by having subjects keep a 2-digit or 7-digit number in mind as they walk from one room to another On the way, subjects are given a choice between a piece of cake or a fruit-salad Processing burden% choosing cake Low (remember only 2 digits)41% High (remember 7 digits)63%")
33
Mesolimbic dopamine reward system Frontal cortex Parietal cortex Affective vs. Analytic Cognition mPFC mOFC vmPFC

34
Hypothesize that the fronto-parietal system is patient Hypothesize that mesolimbic system is impatient. Then integrated preferences are quasi-hyperbolic Relationship to quasi-hyperbolic model nowt+1t+2t+3 PFC1111… Mesolimbic1000… Total2111… Total normed11/2 …

35
Relationship to quasi-hyperbolic model Hypothesize that the fronto-parietal system is patient Hypothesize that mesolimbic system is impatient. Then integrated preferences are quasi-hyperbolic U t = u t + u t+1 u t+2 u t+3 (1/ )U t = (1/ )u t + u t+1 u t+2 u t+3 (1/ )U t =(1/ )u t + [ u t + u t+1 u t+2 u t+3 limbic fronto-parietal cortex
U t = (1/ )u t + u t+1 u t+2 u t+3 (1/ )U t =(1/ )u t + [ u t + u t+1 u t+2 u t+3 limbic fronto-parietal cortex.")
36
Hypothesis: Limbic system discounts reward at a higher rate than does the prefrontal cortex. time discount value prefrontal cortex mesolimbic system 0.0 1.0

37
5. Neuroimaging Evidence McClure, Laibson, Loewenstein, and Cohen Science (2004) Do agents think differently about immediate rewards and delayed rewards? Does immediacy have a special emotional drive/reward component? Does emotional (mesolimbic) brain discount delayed rewards more rapidly than the analytic (fronto-parietal cortex) brain?
 Do agents think differently about immediate rewards and delayed rewards. Does immediacy have a special emotional drive/reward component. Does emotional (mesolimbic) brain discount delayed rewards more rapidly than the analytic (fronto-parietal cortex) brain .")
38
Choices involving Amazon gift certificates: delay d>0 d’ Reward R R’ Hypothesis: fronto-parietal cortex. delay d=0 d’ Reward R R’ Hypothesis: fronto-parietal cortex and limbic. Time

39
Emotional system responds only to immediate rewards y = 8mmx = -4mmz = -4mm 0 7 T 13 Earliest reward available today Earliest reward available in 2 weeks Earliest reward available in 1 month VStr MOFCMPFC PCC Neural activity Seconds McClure, Laibson, Loewenstein, and Cohen Science (2004) 0.4% 2s
 0.4% 2s")
40
x = 44mm x = 0mm 0 15 T 13 VCtx 0.4% 2s RPar DLPFCVLPFCLOFC Analytic brain responds equally to all rewards PMA Earliest reward available in 2 weeks Earliest reward available in 1 month Earliest reward available today

41
0.0 -0.05 0.05 Choose Smaller Immediate Reward Choose Larger Delayed Reward Emotional System Frontal system Brain Activity Brain Activity in the Frontal System and Emotional System Predict Behavior (Data for choices with an immediate option.)
")
42
Conclusions of Amazon study Time discounting results from the combined influence of two neural systems: Mesolimbic dopamine system is impatient. Fronto-parietal system is patient. These two systems are separately implicated in ‘emotional’ and ‘analytic’ brain processes. When subjects select delayed rewards over immediately available alternatives, analytic cortical areas show enhanced changes in activity.

43
Open questions New experiment on primary rewards: Juice McClure, Ericson, Laibson, Loewenstein, Cohen (Journal of Neuroscience, 2007) 1.What is now and what is later? Our “immediate” option (Amazon gift certificate) did not generate immediate “consumption.” Also, we did not control the time of consumption. 2.How does the limbic signal decay as rewards are delayed? 3.Would our results replicate with a different reward domain? 4.Would our results replicate over a different time horizon?
 did not generate immediate consumption. Also, we did not control the time of consumption. 2.How does the limbic signal decay as rewards are delayed. 3.Would our results replicate with a different reward domain. 4.Would our results replicate over a different time horizon .")
44
Subjects water deprived for 3hr prior to experiment (subject scheduled for 6:00)
")
45
Free (10s max.)2sFree (1.5s Max) Variable Duration 15s (i) Decision Period(ii) Choice Made(iii) Pause(iv) Reward Delivery 15s10s5s iv. Juice/Water squirt (1s ) … Time iiiiii A B Figure 1
 … Time iiiiii A B Figure 1.")
46
d d'-d (R,R') { This minute, 10 minutes, 20 minutes } { 1 minute, 5 minutes } {(1ml, 2ml), (1ml, 3ml), (2ml, 3ml)} Experiment Design d = This minute d'-d = 5 minutes (R,R') = (2ml, 3ml)
 { This minute, 10 minutes, 20 minutes } { 1 minute, 5 minutes } {(1ml, 2ml), (1ml, 3ml), (2ml, 3ml)} Experiment Design d = This minute d -d = 5 minutes (R,R ) = (2ml, 3ml)")
47
This minute 10 minutes 20 Minutes P(choose early) Delay to early reward (d) Behavioral evidence for non-exponential discounting 0 0.2 0.4 0.6 0.8
 Delay to early reward (d) Behavioral evidence for non-exponential discounting")
48
This minute 10 minutes 20 Minutes P(choose early) 0 0.2 0.4 0.6 0.8 d’-d = 5 min d’-d = 1 min Delay to early reward (d) Behavioral evidence for non-exponential discounting 0 0.2 0.4 0.6 0.8 This minute 10 minutes 20 minutes Delay to early reward (d)
 d’-d = 5 min d’-d = 1 min Delay to early reward (d) Behavioral evidence for non-exponential discounting This minute 10 minutes 20 minutes Delay to early reward (d)")
49
Discount functions fit to behavioral data LimbicCortical β = 0.53 (se = 0.041) δ = 0.98 (se = 0.014) = 0.47 (se = 0.101) = 1.02 (se = 0.018) Evidence for two-system model Can reject restriction to a single exponential: t-stat > 5 Double exponential generalization fits data best
 δ = 0.98 (se = 0.014) = 0.47 (se = 0.101) = 1.02 (se = 0.018) Evidence for two-system model Can reject restriction to a single exponential: t-stat > 5 Double exponential generalization fits data best")
50
Figure 4 x = -12mmx = -2mmx = -8mm z = -10mm NAcc MOFC/SGC ACCPCu PCC NAcc ACC SGC PCu x = 0mm x = 40mmx = -48mm PCC SMA/PMA Vis Ctx PPar BA10 Ant Ins BA9/44 BA46 0 11 T Areas that respond primarily to immediate rewards Areas that show little discounting Neuroimaging data

51
Figure 5 x = 0mmx = -48mm x = 0mmy = 8mm Juice only Amazon only Both Patient areas (p<0.001) Impatient areas (p<0.001) x = 0mmx = -48mmx = -4mmy = 12mm Patient areas (p<0.01) Impatient areas (p<0.01) Comparison with Amazon experiment:
 Impatient areas (p<0.001) x = 0mmx = -48mmx = -4mmy = 12mm Patient areas (p<0.01) Impatient areas (p<0.01) Comparison with Amazon experiment:")
52
Measuring discount functions using neuroimaging data Impatient voxels are in the emotional (mesolimbic) reward system Patient voxels are in the analytic (prefrontal and parietal) cortex Average (exponential) discount rate in the impatient regions is 4% per minute. Average (exponential) discount rate in the patient regions is 1% per minute.
 discount rate in the patient regions is 1% per minute..")
55
Hare, Camerer, and Rangel (2009) + 4s food item presentation ?-?s fixation Rate Health + Rate Taste + Decide Health SessionTaste SessionDecision Session
 + 4s food item presentation - s fixation Rate Health + Rate Taste + Decide Health SessionTaste SessionDecision Session")
56
Rating Details Taste and health ratings made on five point scale: -2,-1,0,1,2 Decisions also reported on a five point scale: SN,N,0,Y,SY “strong no” to “strong yes”

57
What is self-control? Rejecting a good tasting food that is not healthy Accepting a bad tasting food that is healthy

58
Subjects SC (self-control) group = 19 dieting subjects who showed self-control during the decision phase NSC (no self-control) group = 18 comparison subjects who did not exhibit self-control during the decision phase
 group = 19 dieting subjects who showed self-control during the decision phase NSC (no self-control) group = 18 comparison subjects who did not exhibit self-control during the decision phase")
59
Who is classified as a self- controller: SC? (must meet all criteria below) 1)Use self-control on > %50 of trials in which self-control is required (decline Liked- Unhealthy items or choose Disliked-Healthy ones) 2)Decision = 1 HR + 2 LR + 1 > 2 3)R 2 for HR > R 2 for LR
 1)Use self-control on > %50 of trials in which self-control is required (decline Liked- Unhealthy items or choose Disliked-Healthy ones) 2)Decision = 1 HR + 2 LR + 1 > 2 3)R 2 for HR > R 2 for LR.")
60
Examples of individual behavioral fits Self-controller Non- self-controller

61
Disliked Healthy Disliked Unhealthy Liked Unhealthy Liked Healthy Percent Yes Result: NSC group chose based on taste

62
** Disliked Healthy Disliked Unhealthy Liked Unhealthy Liked Healthy Percent Yes Result: SC group chose based on taste and health

63
** Disliked Healthy Disliked Unhealthy Liked Unhealthy Liked Healthy Percent Yes SC group versus NSC group

64
Question: Is there evidence for a single valuation system? Neuroimaging Results

65
Activity in vmPFC is correlated with a behavioral measure of decision value (regardless of SC) L p <.001 p <.005
 L p <.001 p <.005")
66
* * * Taste RatingHealth Rating Beta vmPFC BOLD signal reflects both taste and health ratings

67
BOLD Health Rating Beta Decision Health Rating Beta The effect of Health Rating in the vmPFC is correlated with its effect on behavior Robust reg Coef =.847

68
Neuroimaging Results Question: Does self-control involve DLPFC modulation of the vmPFC valuation network?

69
More activity in DLPFC in trials with successful self control than in trials with unsuccessful self-control L p <.001 p <.005

70
Summary of neuroimaging evidence One system associated with midbrain dopamine neurons (mesolimbic dopamine system) discounts at a high rate. Second system associated with lateral prefrontal and posterior parietal cortex responsible for self- regulation (and shows relatively little discounting) Combined function of these two systems accounts for decision making across choice domains, including non-exponential discounting regularities.
 Combined function of these two systems accounts for decision making across choice domains, including non-exponential discounting regularities..")
71
Outline 1.Experimental evidence for dynamic inconsistency. 2.Theoretical framework: quasi-hyperbolic discounting. 3.Field evidence: dynamic decisions. 4.Neuroscience: –Mesolimbic Dopamine System (emotional, impatient) –Fronto-Parietal Cortex (analytic, patient) 5.Neuroimaging evidence –Study 1: Amazon gift certificates –Study 2: juice squirts –Study 3: choice of snack foods 6. Policy
 –Fronto-Parietal Cortex (analytic, patient) 5.Neuroimaging evidence –Study 1: Amazon gift certificates –Study 2: juice squirts –Study 3: choice of snack foods 6. Policy.")
72
6. Policy Defaults in the savings domain Welcome to the company If you don’t do anything – You are automatically enrolled in the 401(k) – You save 2% of your pay – Your contributions go into a default fund Call this phone number to opt out of enrollment or change your investment allocations
 – You save 2% of your pay – Your contributions go into a default fund Call this phone number to opt out of enrollment or change your investment allocations.")
73
Madrian and Shea (2001) Choi, Laibson, Madrian, Metrick (2004) Automatic enrollment Standard enrollment
 Choi, Laibson, Madrian, Metrick (2004) Automatic enrollment Standard enrollment")
74
Employees enrolled under automatic enrollment cluster at default contribution rate. Fraction of Participants at different contribution rates: Default contribution rate under automatic enrollment

75
Participants stay at the automatic enrollment defaults for a long time. Fraction of Participants Hired Under Automatic Enrollment who are still at both Default Contribution Rate and Asset Allocation Company B Company C Company D Fraction of Participants Tenure at Company (Months)
.")
76
Survey given to workers who were subject to automatic enrollment: “You are glad your company offers automatic enrollment.” Agree? Disagree? Enrolled employees: 98% agree Non-enrolled employees:79% agree All employees:97% agree Do people like a little paternalism? Source: Harris Interactive Inc.

77
The power of deadlines: Active decisions Carroll, Choi, Laibson, Madrian, Metrick (2004) Active decision mechanisms require employees to make an active choice about 401(k) participation. Welcome to the company You are required to submit this form within 30 days of hire, regardless of your 401(k) participation choice If you don’t want to participate, indicate that decision If you want to participate, indicate your contribution rate and asset allocation Being passive is not an option
 participation choice If you don’t want to participate, indicate that decision If you want to participate, indicate your contribution rate and asset allocation Being passive is not an option.")
78
Active Decision Cohort Standard enrollment cohort

79
2003 2004 2005 Simplified enrollment raises participation Beshears, Choi, Laibson, Madrian (2006)
")
80
Use automaticity and deadlines to nudge people to make better health decisions One early example: Home delivery of chronic meds (e.g. maintenance drugs for diabetes and CVD) Pharmaceutical adherence is about 50% One problem: need to pick up your meds Idea: use active decision intervention to encourage workers on chronic meds to consider home delivery Early results: HD take up rises from 14% to 38% Extensions to health domain
 Pharmaceutical adherence is about 50% One problem: need to pick up your meds Idea: use active decision intervention to encourage workers on chronic meds to consider home delivery Early results: HD take up rises from 14% to 38% Extensions to health domain.")
81
Cost saving at test company (preliminary estimates) 81 Annualized Savings Plan $2,413,641 Members $1,872,263 Total Savings $4,285,904 Rxs at Mail (annualized) Now need to measure effects on health.
 81 Annualized Savings Plan $2,413,641 Members $1,872,263 Total Savings $4,285,904 Rxs at Mail (annualized) Now need to measure effects on health.")
82
Policy Debates Pension Protection Act (2006) Federal Thrift Savings Plan adopts autoenrollment (2009) Auto-IRA mandate (2009?) Consumer Financial Protection Agency (2009?) –Default/privileged plain vanilla financial products –Disclosure –Simplicity –Transparency –Education
 Federal Thrift Savings Plan adopts autoenrollment (2009) Auto-IRA mandate (2009 ) Consumer Financial Protection Agency (2009 ) –Default/privileged plain vanilla financial products –Disclosure –Simplicity –Transparency –Education")
83
$100 bills on the sidewalk Choi, Laibson, Madrian (2004) Employer 401(k) match is an instantaneous, riskless return Particularly appealing if you are over 59½ years old – Can withdraw money from 401(k) without penalty On average, half of employees over 59½ years old are not fully exploiting their employer match Educational intervention has no effect
 Employer 401(k) match is an instantaneous, riskless return Particularly appealing if you are over 59½ years old – Can withdraw money from 401(k) without penalty On average, half of employees over 59½ years old are not fully exploiting their employer match Educational intervention has no effect")
84
84 Education and Disclosure Choi, Laibson, Madrian (2007) Experimental study with 400 subjects Subjects are Harvard staff members Subjects read prospectuses of four S&P 500 index funds Subjects allocate $10,000 across the four index funds Subjects get to keep their gains net of fees
 Experimental study with 400 subjects Subjects are Harvard staff members Subjects read prospectuses of four S&P 500 index funds Subjects allocate $10,000 across the four index funds Subjects get to keep their gains net of fees")
85
85 Data from Harvard Staff Control Treatment Fees salient 3% of Harvard staff in Control Treatment put all $$$ in low-cost fund $494 $518 Fees from random allocation $431

86
86 Data from Harvard Staff Control Treatment Fees salient 3% of Harvard staff in Control Treatment put all $$$ in low-cost fund 9% of Harvard staff in Fee Treatment put all $$$ in low-cost fund $494 $518 Fees from random allocation $431

87
7. The Age of Reason Agarwal, Driscoll, Gabaix, Laibson (2008)
")
88
(1,2) Home Equity Loans and Home Equity Credit Lines Proprietary data from large financial institutions 75,000 contracts for home equity loans and lines of credit, from March-December 2002 (all prime borrowers) We observe: –Contract terms: APR and loan amount –Borrower demographic information: age, employment status, years on the job, home tenure, home state location –Borrower financial information: income, debt-to-income ratio –Borrower risk characteristics: FICO (credit) score, loan-to- value (LTV) ratio
 Home Equity Loans and Home Equity Credit Lines Proprietary data from large financial institutions 75,000 contracts for home equity loans and lines of credit, from March-December 2002 (all prime borrowers) We observe: –Contract terms: APR and loan amount –Borrower demographic information: age, employment status, years on the job, home tenure, home state location –Borrower financial information: income, debt-to-income ratio –Borrower risk characteristics: FICO (credit) score, loan-to- value (LTV) ratio")
89
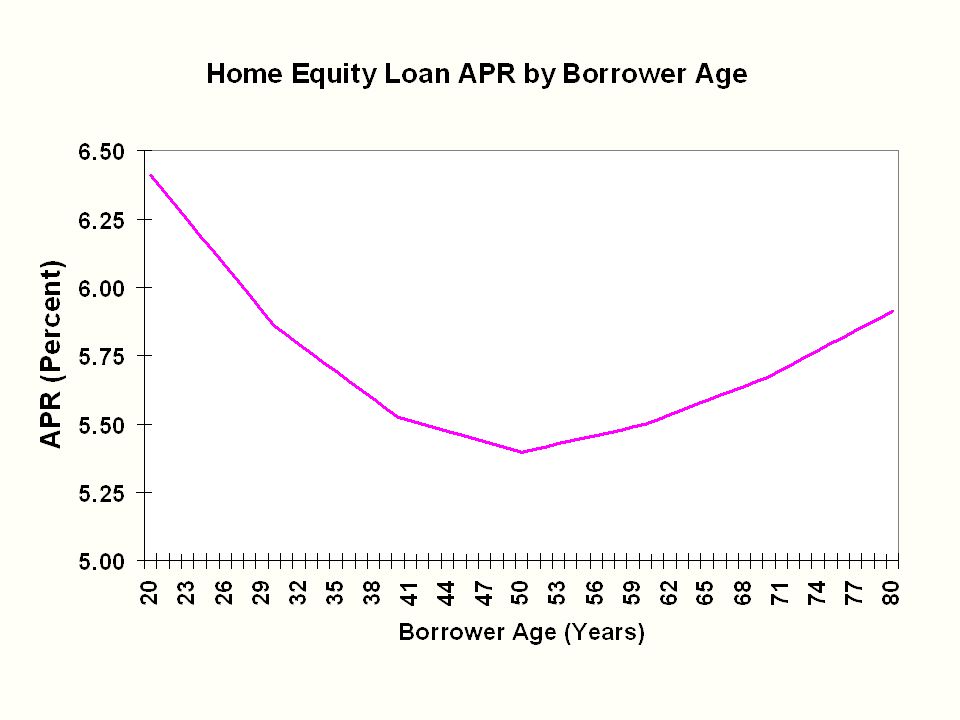
Home Equity Regressions We regress APRs for home equity loans and credit lines on: –Risk controls: FICO score and Loan to Value (LTV) –Financial controls: Income and debt-to-income ratio –Demographic controls: state dummies, home tenure, employment status –Age spline: piecewise linear function of borrower age with knots at age 30, 40, 50, 60 and 70. Next slide plots fitted values on age splines

92
What is the Channel for the Age Effect? Banks offer different APRs when the loan-to- value (LTV) ratio is: –less than 80 percent –between 80 and 90 percent –over 90 percent Borrowers estimate their LTV by estimating their house value Banks form their own LTV estimates “Rate-Changing Mistake”: when borrower and bank LTVs straddle two of these categories –E.g., borrower LTV 80.
 ratio is: –less than 80 percent –between 80 and 90 percent –over 90 percent Borrowers estimate their LTV by estimating their house value Banks form their own LTV estimates Rate-Changing Mistake : when borrower and bank LTVs straddle two of these categories –E.g., borrower LTV 80..")
93
Rate Changing Mistakes generate two sources of disadvantage for the customer: –If I underestimate my LTV (Loan-to-Value ratio), the bank can penalize me by deviating from its normal offer sheet. –If I overestimate my LTV (i.e., underestimate the value of my house), the bank will penalize me by not correcting my mistake and allowing me to borrow at too high a rate.
, the bank will penalize me by not correcting my mistake and allowing me to borrow at too high a rate..")
94
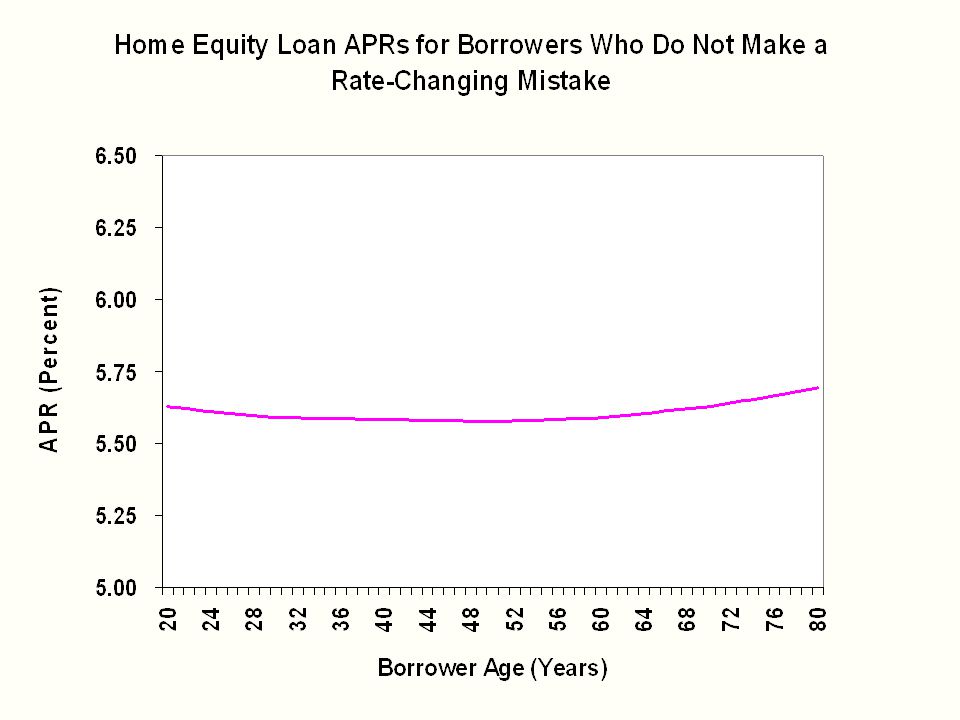
A Rate-Changing Mistake costs 125 to 150 basis points. Next slides plot: –Rate-Changing Mistakes by age –APRs for borrowers who do NOT make a Rate-Changing Mistake

98
For consumers who don’t make a Rate- Changing Mistake, age effect is small All the action is due to consumers who make a Rate-Changing Mistake –That is, consumers who over- or under-estimate their house values (relative to bank model) The propensity to make the mistake is U- shaped with age Hence, the final APR is U-shaped with age
 The propensity to make the mistake is U- shaped with age Hence, the final APR is U-shaped with age")
99
Two channels by which RCM raise interest payments Direct channel: old and young borrowers may have a higher ex-ante likelihood of making a RCM Indirect channel: old and young borrowers may have a higher ex-poste likelihood of accepting the high interest rates they receive after they make a RCM (instead of shopping around)
")
100
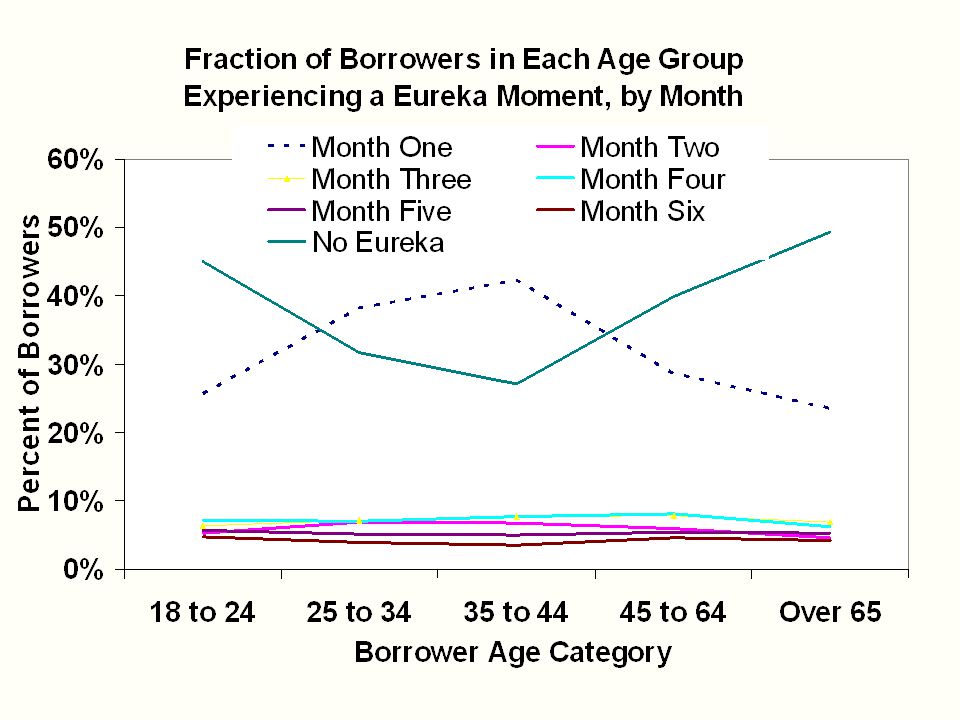
(3) “Eureka”: Learning to Avoid Interest Charges on Balance Transfer Offers Balance transfer offers: borrowers pay lower APRs on balances transferred from other cards for a six-to- nine-month period New purchases on card have higher APRs Payments go towards balance transferred first, then towards new purchases Optimal strategy: make no new purchases on card to which balance has been transferred
 Eureka : Learning to Avoid Interest Charges on Balance Transfer Offers Balance transfer offers: borrowers pay lower APRs on balances transferred from other cards for a six-to- nine-month period New purchases on card have higher APRs Payments go towards balance transferred first, then towards new purchases Optimal strategy: make no new purchases on card to which balance has been transferred")
101
Eureka: Predictions Borrowers may not initially understand / be informed about card terms Borrowers may learn about terms by observing interest charges on purchases, or talking to friends –We should see “eureka” moments: new purchases on balance-transfer cards should drop to zero (in the month after borrowers “figure out” the card terms) Study: 14,798 accounts which accepted such offers over the period January 2000 to December 2002
 Study: 14,798 accounts which accepted such offers over the period January 2000 to December 2002")
104
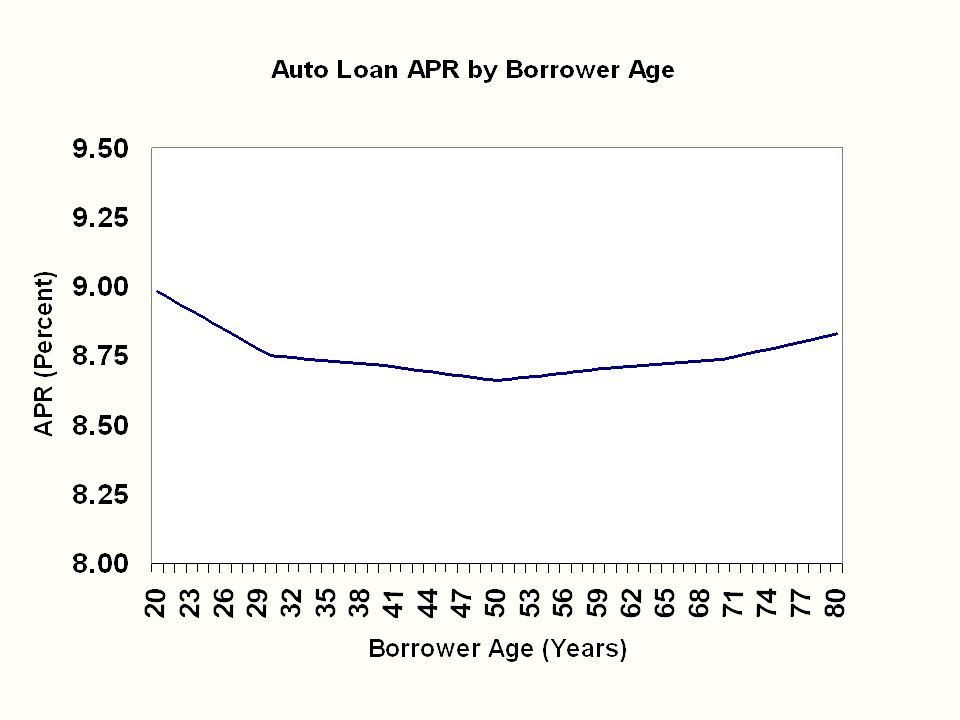
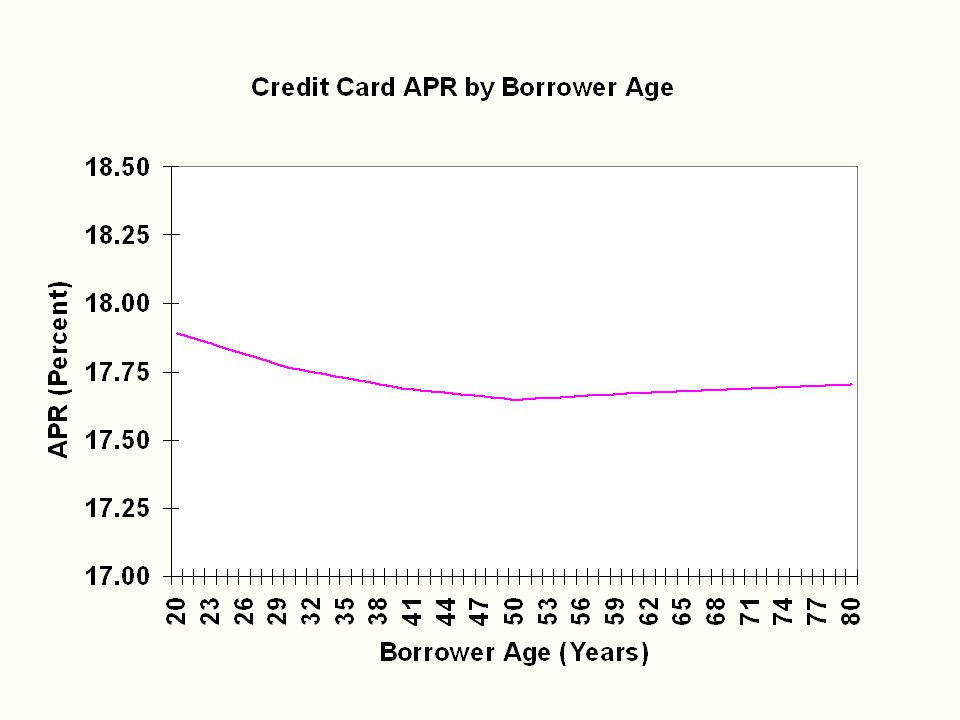
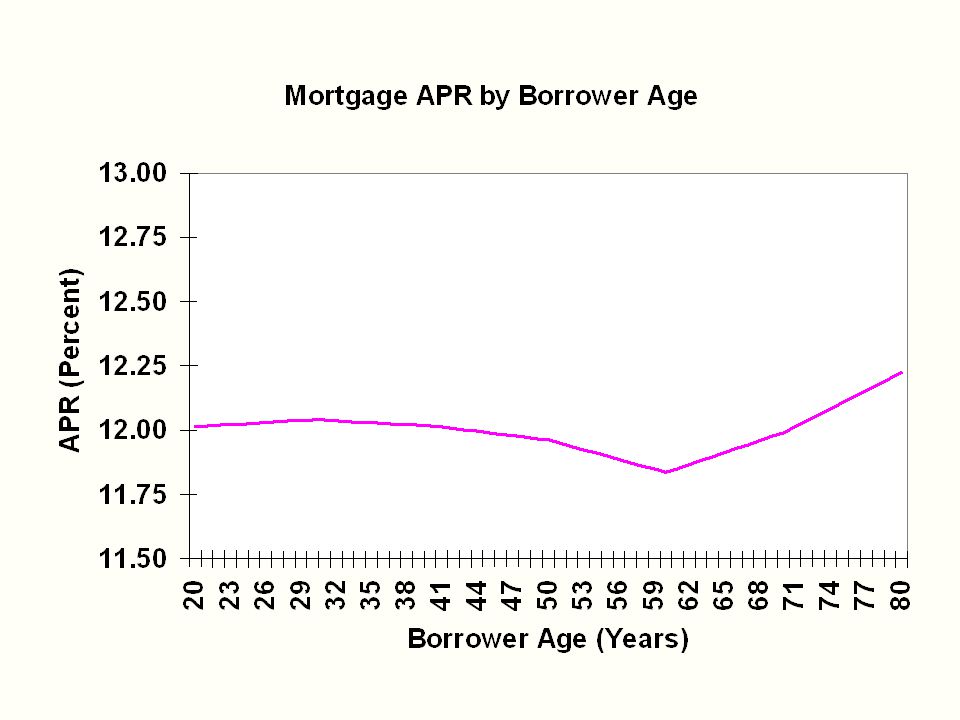
Seven other examples Three kinds of credit card fees: –Late payment –Over limit –Cash advance Credit card APRs Mortgage APRs Auto loan APRs Small business credit card APRs

110
U-shape for prices paid in 10 examples –Home equity loans –Home equity lines of credit –Eureka moments for balance transfers –Late payment fees –Over credit limit fees –Cash advance fees –Auto loans –Credit cards –Small business credit cards –Mortgages

111
Salthouse Studies – Memory and Analytic Tasks Source: Salthouse (forth.)
")
112
Dementia Ferri et al 2005 Prevalence of dementia: 60-64:0.8% 65-69:1.7% 70-74:3.3% 75-79:6.5% 80-84: 12.8% 85+: 30.1%

113
Cognitive Impairment w/o Dementia (Plassman et al 2008) Prevalence: 71–79: 16.0% 80–89: 29.2% 90+: 39.0%
 Prevalence: 71–79: 16.0% 80–89: 29.2% 90+: 39.0%")
114
Regulation? Regulator creates a very broad safe harbor for financial services (e.g., caps on mutual fund fees, plain vanilla credit cards, mortgages without prepayment penalties, etc…). An investor may conduct a financial transaction that is outside the safe harbor if the investor is advised by a fiduciary (with legal liability).
. An investor may conduct a financial transaction that is outside the safe harbor if the investor is advised by a fiduciary (with legal liability)..")
115
Outline 1.Motivating experimental evidence 2.Theoretical framework 3.Field evidence 4.Neuroscience foundations 5.Neuroimaging evidence 6.Policy applications 7. The age of reason A copy of these slides will soon be available on my Harvard website.

Similar presentations


 1.Time inconsistency problem 2.Riskiness measures and gambling wealth Riskiness measures – the idea and.>")


 Analyze the various sources of borrowing available to a client and.>")


