Download presentation
Presentation is loading. Please wait.

1
Towards a scientific basis for determining En Route capacity Alex Bayen Charles Roblin Dengfeng Sun Guoyuan Wu University of California, Berkeley Department of Civil Engineering Systems Engineering March16 th, 2006, Pacific Grove, CA Work funded by NASA Ames under Task Order TO.048.0.BS.AF

2
Motivation for this work Importance of en-route capacity (analysis) Safety, quality of service, delays, efficiency, performance metrics,… Establishing a scientific base for the envelope of operations Question 1: reachability in terms of delays Question 2: reachability in terms of counts or similar metrics Provide input data for estimating storage capacity Question 1: how much aircraft / delay can one portion of airspace absorb Question 2: what is the relation to WITI? Question 2: space / time definition of capacity

3
Outline Building blocks towards scientific capacity analysis 1.Systematic identification of the topological features of the National Airspace System (graph theoretic) 2.Automated model building (aggregation procedure) 3.Parameter identification (travel time) 4.Model Analysis (storage) 5.Model validation 6.Capacity assessment (in progress) 1.Delays that can be absorbed 2.Aircraft that can be stored 3.Stability of the storage (backpropagation)
 2.Automated model building (aggregation procedure) 3.Parameter identification (travel time) 4.Model Analysis (storage) 5.Model validation 6.Capacity assessment (in progress) 1.Delays that can be absorbed 2.Aircraft that can be stored 3.Stability of the storage (backpropagation)")
4
The National Airspace System (NAS)
")
5
Air Route Traffic Control Centers in the US [Menon, Sweriduk, Bilimoria 2004] [Sridhar, Soni, Sheth, Chatterji 2004] [Roy, Sridhar, Verghese 2003], [Devasia, Meyer 2002]
![Air Route Traffic Control Centers in the US [Menon, Sweriduk, Bilimoria 2004] [Sridhar, Soni, Sheth, Chatterji 2004] [Roy, Sridhar, Verghese 2003], [Devasia, Meyer 2002]](http://images.slideplayer.com/14/4238893/slides/slide_5.jpg "Air Route Traffic Control Centers in the US [Menon, Sweriduk, Bilimoria 2004] [Sridhar, Soni, Sheth, Chatterji 2004] [Roy, Sridhar, Verghese 2003], [Devasia, Meyer 2002]")
6
Air Route Traffic Control Center (Oakland)
")
7
Flight trajectories

8
Conceptual goal: graph building [Histon, Hansman, 2000]
![Conceptual goal: graph building [Histon, Hansman, 2000]](http://images.slideplayer.com/14/4238893/slides/slide_8.jpg "Conceptual goal: graph building [Histon, Hansman, 2000]")
9
A state of the art clustering algorithm

11
Outline Building blocks towards scientific capacity analysis 1.Systematic identification of the topological features of the National Airspace System (graph theoretic) 2.Automated model building (aggregation procedure) 3.Parameter identification (travel time) 4.Model Analysis (storage) 5.Model validation 6.Capacity assessment (in progress) 1.Delays that can be absorbed 2.Aircraft that can be stored 3.Stability of the storage (backpropagation)
 2.Automated model building (aggregation procedure) 3.Parameter identification (travel time) 4.Model Analysis (storage) 5.Model validation 6.Capacity assessment (in progress) 1.Delays that can be absorbed 2.Aircraft that can be stored 3.Stability of the storage (backpropagation)")
12
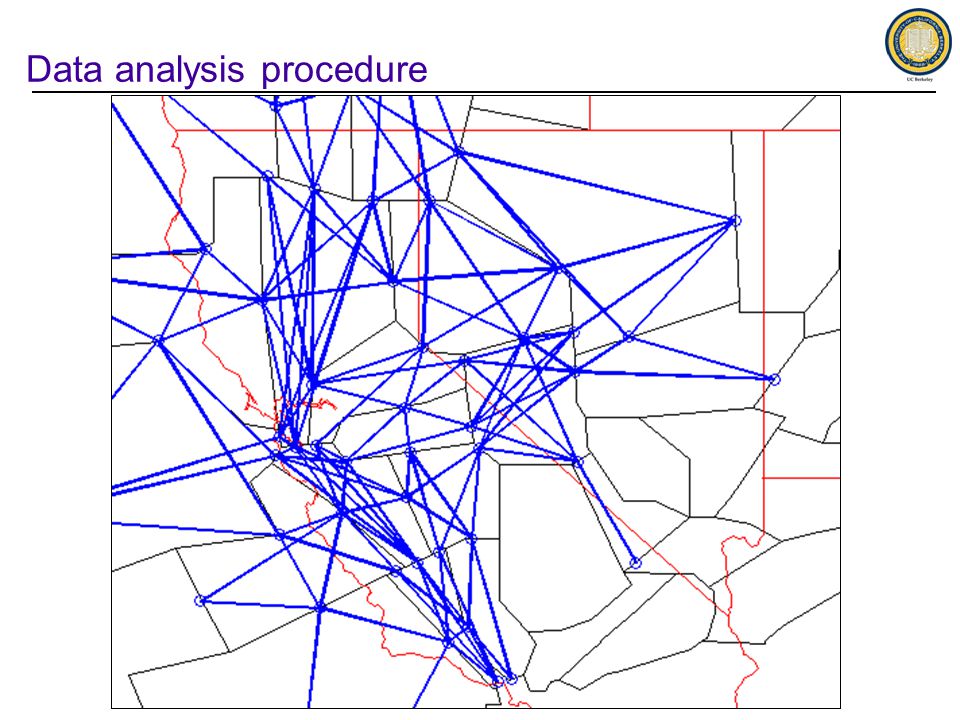
Data analysis procedure 1.Airspace segmentation using sector boundaries 2.Link building using clustering techniques 3.Data aggregation using ASDI/ETMS information (flight plan information) 4.Filtering using LOAs, and observed flow patterns 5.Computation of the aggregate flow pattern features Sequential (automated) algorithm Output: topology of the flows
 4.Filtering using LOAs, and observed flow patterns 5.Computation of the aggregate flow pattern features Sequential (automated) algorithm Output: topology of the flows")
13
Data analysis procedure

17
Main question: what is the aggregate dynamics? How to relate inflow to outflow (MIMO)? What is the internal dynamics? How to use these models to assess capacity?

18
Outline Building blocks towards scientific capacity analysis 1.Systematic identification of the topological features of the National Airspace System (graph theoretic) 2.Automated model building (aggregation procedure) 3.Parameter identification (travel time) 4.Model Analysis (storage) 5.Model validation 6.Capacity assessment (in progress) 1.Delays that can be absorbed 2.Aircraft that can be stored 3.Stability of the storage (backpropagation)
 2.Automated model building (aggregation procedure) 3.Parameter identification (travel time) 4.Model Analysis (storage) 5.Model validation 6.Capacity assessment (in progress) 1.Delays that can be absorbed 2.Aircraft that can be stored 3.Stability of the storage (backpropagation)")
19
System identification (example: one link)
")
22
Travel time/Link length Travel Time (min) Frequency (number of occurences per day)
 Frequency (number of occurences per day)")
23
Outline Building blocks towards systematic capacity analysis 1.Systematic identification of the topological features of the National Airspace System (graph theoretic) 2.Automated model building (aggregation procedure) 3.Parameter identification (travel time) 4.Model Analysis (storage) 5.Model validation 6.Capacity assessment (in progress) 1.Delays that can be absorbed 2.Aircraft that can be stored 3.Stability of the storage (backpropagation)
 2.Automated model building (aggregation procedure) 3.Parameter identification (travel time) 4.Model Analysis (storage) 5.Model validation 6.Capacity assessment (in progress) 1.Delays that can be absorbed 2.Aircraft that can be stored 3.Stability of the storage (backpropagation)")
24
Delay system: Link level Link level model Cell

25
Illustration of the model: state vector delay system at the link level time step 1 state: cell counts

26
Illustration of the model: states transition time step 2 delay system at the link level state: cell counts

27
Illustration of the model: states transition time step 3 delay system at the link level

28
Illustration of the model: states transition time step 4 delay system at the link level

29
Illustration of the model: entry input time step 5 delay system at the link level input to the link (forcing)
")
30
Illustration of the model: entry input time step 6 delay system at the link level

31
Illustration of the model: delay control time step 7 delay system at the link level one aircraft about to be held

32
Illustration of the model: delay control time step 8 delay system at the link level control input

33
Illustration of the model: delay control time step 9 delay system at the link level two aircraft about to be held

34
Illustration of the model: delay control time step 10 delay system at the link level

35
Delay system: Link level

36
Sector level Delay system: Sector level [Robelin, Sun, Wu, Bayen 2006]
![Sector level Delay system: Sector level [Robelin, Sun, Wu, Bayen 2006]](http://images.slideplayer.com/14/4238893/slides/slide_36.jpg "Sector level Delay system: Sector level [Robelin, Sun, Wu, Bayen 2006]")
37
Center level: Delay system: Center (ARTCC) level [Robelin, Sun, Wu, Bayen 2006]
![Center level: Delay system: Center (ARTCC) level [Robelin, Sun, Wu, Bayen 2006]](http://images.slideplayer.com/14/4238893/slides/slide_37.jpg "Center level: Delay system: Center (ARTCC) level [Robelin, Sun, Wu, Bayen 2006]")
38
Outline Building blocks towards systematic capacity analysis 1.Systematic identification of the topological features of the National Airspace System (graph theoretic) 2.Automated model building (aggregation procedure) 3.Parameter identification (travel time) 4.Model Analysis (storage) 5.Model validation 6.Capacity assessment (in progress) 1.Delays that can be absorbed 2.Aircraft that can be stored 3.Stability of the storage (backpropagation)
 2.Automated model building (aggregation procedure) 3.Parameter identification (travel time) 4.Model Analysis (storage) 5.Model validation 6.Capacity assessment (in progress) 1.Delays that can be absorbed 2.Aircraft that can be stored 3.Stability of the storage (backpropagation)")
39
Model Validation Cumulative entry count onto ZOA33 Comparison of sector count in ZOA33 ASDI data: 8am Jan 24, 2005 – 8am Jan 25, 2005 [Robelin, Sun, Wu, Bayen 2006]
![Model Validation Cumulative entry count onto ZOA33 Comparison of sector count in ZOA33 ASDI data: 8am Jan 24, 2005 – 8am Jan 25, 2005 [Robelin, Sun, Wu, Bayen 2006]](http://images.slideplayer.com/14/4238893/slides/slide_39.jpg "Model Validation Cumulative entry count onto ZOA33 Comparison of sector count in ZOA33 ASDI data: 8am Jan 24, 2005 – 8am Jan 25, 2005 [Robelin, Sun, Wu, Bayen 2006]")
40
Aggregate model validation

41
Outline Building blocks towards systematic capacity analysis 1.Systematic identification of the topological features of the National Airspace System (graph theoretic) 2.Automated model building (aggregation procedure) 3.Parameter identification (travel time) 4.Model Analysis (storage) 5.Model validation 6.Capacity assessment and control (in progress) 1.Delays that can be absorbed 2.Aircraft that can be stored 3.Stability of the storage (backpropagation)
 2.Automated model building (aggregation procedure) 3.Parameter identification (travel time) 4.Model Analysis (storage) 5.Model validation 6.Capacity assessment and control (in progress) 1.Delays that can be absorbed 2.Aircraft that can be stored 3.Stability of the storage (backpropagation)")
42
IP: Formulation Challenges >1M variables, >1M constrains. CPLEX: <6 minute running time (LP) [Borelli 2003, Feron 2000, Bertsimas 1997][Robelin, Sun, Wu, Bayen 2006]
 [Borelli 2003, Feron 2000, Bertsimas 1997][Robelin, Sun, Wu, Bayen 2006].")
43
LP relaxation Proportion of runs Running time 0 1 2 3 4 5 6 0 Number of variables Average running time (min) Running Time Integrality gap (1000 runs) 0% 20% 40% 60% 80% 100% 11.00051.0011.0015 MILP: solve a linear problem with some integer variables LP relaxation: solve MILP by dropping the integrality restrictions
 Running Time Integrality gap (1000 runs) 0% 20% 40% 60% 80% 100% MILP: solve a linear problem with some integer variables LP relaxation: solve MILP by dropping the integrality restrictions")
44
Overload control

45
Eulerian models 1.Eulerian models scale well: complexity is independent of number of aircraft 2.Control volume based: appropriate for capacity analysis 3.Linear features make them suitable for analysis 4.Can rely on control theory for controllability, observability 5.Combinatorial optimization algorithms can be applied Generic features of Eulerian models Features of the current model 1.Can take any set of ETMS/ASDI data as input 2.Eulerian model, validated against ETMS/ASDI data 3.Compared to 2 other existing models (AIAA GNC 2006) 4.Interface with FACET
 4.Interface with FACET")
46
Acknowledgments UC Berkeley: Mark Hansen NASA Ames: Banavar Sridhar, Kapil Sheth, Shon Grabbe, George Meyer FAA: Dave KnorrCNA: Doug Williamson

Similar presentations


 1 Virtual Topology Wavelength routed network >")
