Download presentation
Presentation is loading. Please wait.

4
12-1 Multiple Linear Regression Models
Introduction Many applications of regression analysis involve situations in which there are more than one regressor variable. A regression model that contains more than one regressor variable is called a multiple regression model.

5
12-1 Multiple Linear Regression Models
Introduction For example, suppose that the effective life of a cutting tool depends on the cutting speed and the tool angle. A possible multiple regression model could be where Y – tool life x1 – cutting speed x2 – tool angle

6
12-1 Multiple Linear Regression Models
Introduction Figure 12-1 (a) The regression plane for the model E(Y) = x1 + 7x2. (b) The contour plot
 The regression plane for the model E(Y) = x1 + 7x2. (b) The contour plot.")
7
12-1 Multiple Linear Regression Models
Introduction

8
12-1 Multiple Linear Regression Models
Introduction Figure 12-2 (a) Three-dimensional plot of the regression model E(Y) = x1 + 7x2 + 5x1x2. (b) The contour plot
 Three-dimensional plot of the regression model E(Y) = x1 + 7x2 + 5x1x2. (b) The contour plot.")
9
12-1 Multiple Linear Regression Models
Introduction Figure 12-3 (a) Three-dimensional plot of the regression model E(Y) = x1 + 7x2 – 8.5x12 – 5x22 + 4x1x2. (b) The contour plot
 Three-dimensional plot of the regression model E(Y) = x1 + 7x2 – 8.5x12 – 5x22 + 4x1x2. (b) The contour plot.")
10
12-1 Multiple Linear Regression Models
Least Squares Estimation of the Parameters

11
12-1 Multiple Linear Regression Models
Least Squares Estimation of the Parameters The least squares function is given by The least squares estimates must satisfy

12
12-1 Multiple Linear Regression Models
Least Squares Estimation of the Parameters The least squares normal Equations are The solution to the normal Equations are the least squares estimators of the regression coefficients.

13
12-1 Multiple Linear Regression Models
Example 12-1

14
12-1 Multiple Linear Regression Models
Example 12-1

15
12-1 Multiple Linear Regression Models
Figure 12-4 Matrix of scatter plots (from Minitab) for the wire bond pull strength data in Table 12-2.
 for the wire bond pull strength data in Table")
16
12-1 Multiple Linear Regression Models
Example 12-1

17
12-1 Multiple Linear Regression Models
Example 12-1

18
12-1 Multiple Linear Regression Models
Example 12-1

19
12-1 Multiple Linear Regression Models
Matrix Approach to Multiple Linear Regression Suppose the model relating the regressors to the response is In matrix notation this model can be written as

20
12-1 Multiple Linear Regression Models
Matrix Approach to Multiple Linear Regression where

21
12-1 Multiple Linear Regression Models
Matrix Approach to Multiple Linear Regression We wish to find the vector of least squares estimators that minimizes: The resulting least squares estimate is

22
12-1 Multiple Linear Regression Models
Matrix Approach to Multiple Linear Regression

23
12-1 Multiple Linear Regression Models
Example 12-2

24
Example 12-2

25
12-1 Multiple Linear Regression Models
Example 12-2

26
12-1 Multiple Linear Regression Models
Example 12-2

27
12-1 Multiple Linear Regression Models
Example 12-2

28
12-1 Multiple Linear Regression Models
Example 12-2

30
12-1 Multiple Linear Regression Models
Estimating 2 An unbiased estimator of 2 is

31
12-1 Multiple Linear Regression Models
Properties of the Least Squares Estimators Unbiased estimators: Covariance Matrix:

32
12-1 Multiple Linear Regression Models
Properties of the Least Squares Estimators Individual variances and covariances: In general,

33
12-2 Hypothesis Tests in Multiple Linear Regression
Test for Significance of Regression The appropriate hypotheses are The test statistic is

34
12-2 Hypothesis Tests in Multiple Linear Regression
Test for Significance of Regression

35
12-2 Hypothesis Tests in Multiple Linear Regression
Example 12-3

36
12-2 Hypothesis Tests in Multiple Linear Regression
Example 12-3

37
12-2 Hypothesis Tests in Multiple Linear Regression
Example 12-3

38
12-2 Hypothesis Tests in Multiple Linear Regression
Example 12-3

39
12-2 Hypothesis Tests in Multiple Linear Regression
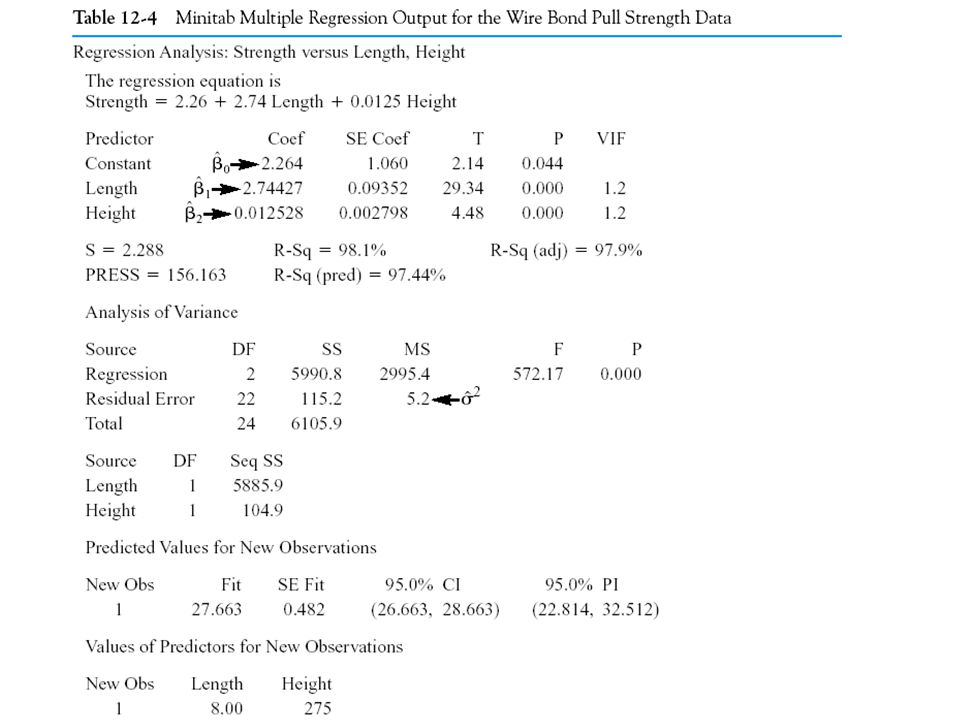
R2 and Adjusted R2 The coefficient of multiple determination For the wire bond pull strength data, we find that R2 = SSR/SST = / = Thus, the model accounts for about 98% of the variability in the pull strength response.

40
12-2 Hypothesis Tests in Multiple Linear Regression
R2 and Adjusted R2 The adjusted R2 is The adjusted R2 statistic penalizes the analyst for adding terms to the model. It can help guard against overfitting (including regressors that are not really useful)
")
41
12-2 Hypothesis Tests in Multiple Linear Regression
Tests on Individual Regression Coefficients and Subsets of Coefficients The hypotheses for testing the significance of any individual regression coefficient:

42
12-2 Hypothesis Tests in Multiple Linear Regression
Tests on Individual Regression Coefficients and Subsets of Coefficients The test statistic is Reject H0 if |t0| > t/2,n-p. This is called a partial or marginal test

43
12-2 Hypothesis Tests in Multiple Linear Regression
Example 12-4

44
12-2 Hypothesis Tests in Multiple Linear Regression
Example 12-4

45
12-2 Hypothesis Tests in Multiple Linear Regression
The general regression significance test or the extra sum of squares method: We wish to test the hypotheses:

46
12-2 Hypothesis Tests in Multiple Linear Regression
A general form of the model can be written: where X1 represents the columns of X associated with 1 and X2 represents the columns of X associated with 2

47
12-2 Hypothesis Tests in Multiple Linear Regression
For the full model: If H0 is true, the reduced model is

48
12-2 Hypothesis Tests in Multiple Linear Regression
The test statistic is: Reject H0 if f0 > f,r,n-p The test in Equation (12-32) is often referred to as a partial F-test
 is often referred to as a partial F-test.")
49
12-2 Hypothesis Tests in Multiple Linear Regression
Example 12-5

50
12-2 Hypothesis Tests in Multiple Linear Regression
Example 12-5

51
12-2 Hypothesis Tests in Multiple Linear Regression
Example 12-5

52
12-3 Confidence Intervals in Multiple Linear Regression
Confidence Intervals on Individual Regression Coefficients Definition

53
12-3 Confidence Intervals in Multiple Linear Regression
Example 12-6

54
12-3 Confidence Intervals in Multiple Linear Regression
Confidence Interval on the Mean Response The mean response at a point x0 is estimated by The variance of the estimated mean response is

55
12-3 Confidence Intervals in Multiple Linear Regression
Confidence Interval on the Mean Response Definition

56
12-3 Confidence Intervals in Multiple Linear Regression
Example 12-7

57
12-3 Confidence Intervals in Multiple Linear Regression
Example 12-7

58
12-4 Prediction of New Observations
A point estimate of the future observation Y0 is A 100(1-)% prediction interval for this future observation is
% prediction interval for this future observation is.")
59
12-4 Prediction of New Observations
Figure 12-5 An example of extrapolation in multiple regression

60
12-4 Prediction of New Observations
Example 12-8

61
12-5 Model Adequacy Checking
Residual Analysis Example 12-9 Figure 12-6 Normal probability plot of residuals

62
12-5 Model Adequacy Checking
Residual Analysis Example 12-9

63
12-5 Model Adequacy Checking
Residual Analysis Example 12-9 Figure 12-7 Plot of residuals against ŷi.

64
12-5 Model Adequacy Checking
Residual Analysis Example 12-9 Figure 12-8 Plot of residuals against x1.

65
12-5 Model Adequacy Checking
Residual Analysis Example 12-9 Figure 12-9 Plot of residuals against x2.

66
12-5 Model Adequacy Checking
Residual Analysis

67
12-5 Model Adequacy Checking
Residual Analysis The variance of the ith residual is

68
12-5 Model Adequacy Checking
Residual Analysis

69
12-5 Model Adequacy Checking
Influential Observations Figure A point that is remote in x-space.

70
12-5 Model Adequacy Checking
Influential Observations Cook’s distance measure

71
12-5 Model Adequacy Checking
Example 12-10

72
12-5 Model Adequacy Checking
Example 12-10

73
12-6 Aspects of Multiple Regression Modeling
Polynomial Regression Models

74
12-6 Aspects of Multiple Regression Modeling
Example 12-11

75
12-6 Aspects of Multiple Regression Modeling
Example 12-11 Figure Data for Example

76
Example 12-11

77
12-6 Aspects of Multiple Regression Modeling
Example 12-11

78
12-6 Aspects of Multiple Regression Modeling
Categorical Regressors and Indicator Variables Many problems may involve qualitative or categorical variables. The usual method for the different levels of a qualitative variable is to use indicator variables. For example, to introduce the effect of two different operators into a regression model, we could define an indicator variable as follows:

79
12-6 Aspects of Multiple Regression Modeling
Example 12-12

80
12-6 Aspects of Multiple Regression Modeling
Example 12-12

81
12-6 Aspects of Multiple Regression Modeling
Example 12-12

82
Example 12-12

83
12-6 Aspects of Multiple Regression Modeling
Example 12-12

84
12-6 Aspects of Multiple Regression Modeling
Example 12-12

85
12-6 Aspects of Multiple Regression Modeling
Selection of Variables and Model Building

86
12-6 Aspects of Multiple Regression Modeling
Selection of Variables and Model Building All Possible Regressions – Example 12-13

87
12-6 Aspects of Multiple Regression Modeling
Selection of Variables and Model Building All Possible Regressions – Example 12-13

88
12-6 Aspects of Multiple Regression Modeling
Selection of Variables and Model Building All Possible Regressions – Example 12-13 Figure A matrix of Scatter plots from Minitab for the Wine Quality Data.

90
12-6.3 Selection of Variables and Model Building
Stepwise Regression Example 12-13

91
12-6.3 Selection of Variables and Model Building
Backward Regression Example 12-13

92
12-6 Aspects of Multiple Regression Modeling
Multicollinearity Variance Inflation Factor (VIF)
")
93
12-6 Aspects of Multiple Regression Modeling
Multicollinearity The presence of multicollinearity can be detected in several ways. Two of the more easily understood of these are:

Similar presentations


. Introduction Multiple regression is an extension of bivariate regression to take into account more than.>")


2000 South-Western College Publishing.>")

 R-squared statistic (10.4.1) Residual plots (11.2) Influential observations (11.3, 11.4.3.>")