Download presentation
Presentation is loading. Please wait.

1
Luke Erickson, Extension Educator Jim Schaffer, Extension Educator 1

2
See notes

4
4

5
Participant Outcomes Increase understanding of: Dollar cost averaging Risks and rewards of short and long term investing Effects of taxes and shelter opportunities Diversification and asset allocation Why rebalancing is useful

6
Investing To commit (money or capital) in order to gain a financial return Implies that there will be some risk associated with the choice Reward does not come without risk in the financial world Expectations of greater returns (or rewards) imply an expectation of greater risk Investing is not saving!
 in order to gain a financial return Implies that there will be some risk associated with the choice Reward does not come without risk in the financial world Expectations of greater returns (or rewards) imply an expectation of greater risk Investing is not saving!")
7
Albert Einstein "The most powerful force in the universe is compound interest."

8
http://illuminations.nctm.org/ActivityD etail.aspx?ID=172http://illuminations.nctm.org/ActivityD etail.aspx?ID=172 http://www.youtube.com/watch?v=vtPl x_bFc8whttp://www.youtube.com/watch?v=vtPl x_bFc8w

9
What is inflation? Inflation is commonly defined as the rise in prices for goods and services over time Average inflation rate from 1913 – present = 3.22%

10
Inflation Significantly Erodes Purchasing Power Over Time Effects of 3% inflation on purchasing power $ 100k 80 60 40 20 0 0 Years 5 1015202530 $73,742 $63,325 $54,379 $46,697 $40,101 $85,873

15
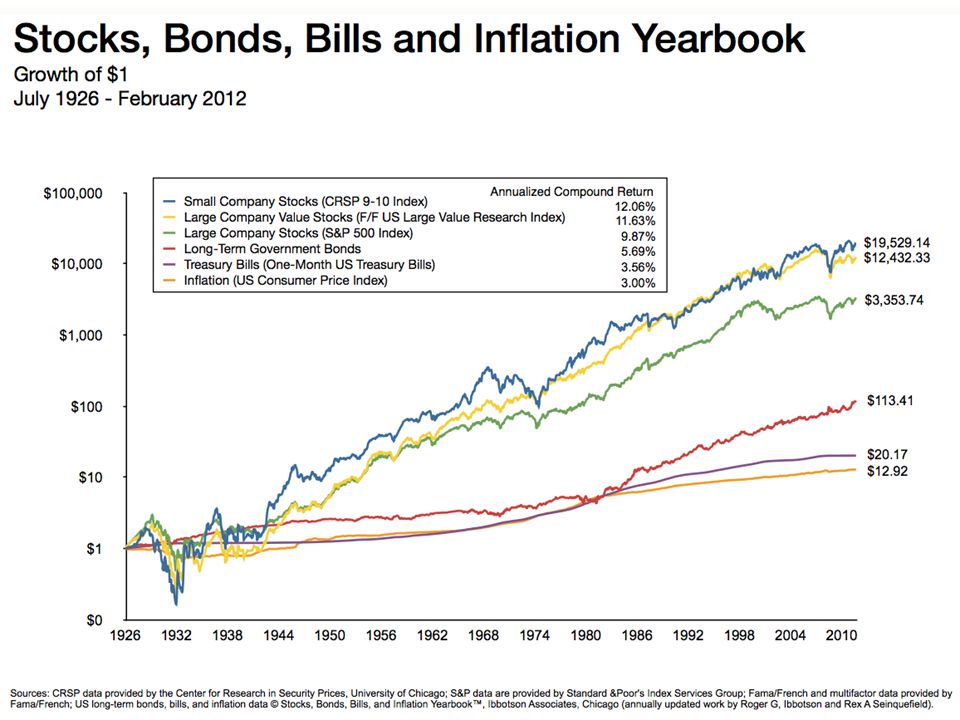
Stocks, Bonds, Bills and Inflation After Taxes 1926–2007 $1,000 100 10 1 0.10 192619361946195619661976198619962006 $11.72 $6.43 $16.33 $33.48 $644.22 Compound annual return Stocks8.2 % Municipal bonds Government bonds Treasury bills Inflation 4.4 3.5 3.0 2.3

16
What Happens When We Combine the Effect of Taxes and Inflation?

17
Stocks, Bonds, Bills After Taxes and Inflation 1926–2007.10 1 10 $100 192619361946195619661976198619962006 $0.55 $1.39 $2.86 $54.98 Compound annual return Stocks5.0 % Municipal bonds Government bonds Treasury bills 1.3 0.4 0.7

18
Inflation and Taxes Reduce Returns Compound annual returns 1926–2007 10.4% 7.1% 5.0% 5.5% 2.4% 0.4% 3.7% 0.7% –0.7% CashBondsStocks –2 0 2 4 6 8 10 12% ReturnAfter inflation After taxes & inflation ReturnAfter inflation After taxes & inflation ReturnAfter inflation After taxes & inflation

19
Examples of Tax Deferred Investments (Pay taxes later) Salary Reduction Plans – (401(k), 403(b), 457) Traditional IRA’s SEP Plans (Simplified Employee Pensions) Simple IRA or 401(k) (Savings Incentive Match PLan for Employees)
 Salary Reduction Plans – (401(k), 403(b), 457) Traditional IRA’s SEP Plans (Simplified Employee Pensions) Simple IRA or 401(k) (Savings Incentive Match PLan for Employees)")
20
Tax Deferred Investments Designated funds are not taxed the year they are earned and invested, thus lowering taxable income Earnings grow tax deferred until withdrawn Contributions and earnings are taxed when withdrawn

21
401(k)’s and IRA’s Are Not Investments! 401(k)s and IRAs are tax shelters that protect your investments from being taxed each year. But you still have to pick the investments that will be kept inside the 401(k) or IRA. These could be Stocks, Bonds, CD’s, even a simple savings accounts, or best of all Mutual Funds. Money kept in a 401(k), IRA or other sheltered investment cannot be used before retirement age without penalties.
s and IRAs are tax shelters that protect your investments from being taxed each year. But you still have to pick the investments that will be kept inside the 401(k) or IRA. These could be Stocks, Bonds, CD’s, even a simple savings accounts, or best of all Mutual Funds. Money kept in a 401(k), IRA or other sheltered investment cannot be used before retirement age without penalties..")
22
Nest Egg? IRA & 401(k) status are simply tax codes that determine when your investments will be taxed. Like a shell on an egg, it protects what’s inside of it - (from taxation). You can choose from a large assortment of investment vehicles (yolks and whites) for an IRA or a limited number of yolks & whites from your company sponsored 401(k). Yolks represent stock mutual funds; whites represent bond mutual funds.
 status are simply tax codes that determine when your investments will be taxed. Like a shell on an egg, it protects what’s inside of it - (from taxation). You can choose from a large assortment of investment vehicles (yolks and whites) for an IRA or a limited number of yolks & whites from your company sponsored 401(k). Yolks represent stock mutual funds; whites represent bond mutual funds..")
23
Investments That Grow Tax-Free Pay taxes upfront Roth IRA Roth 401k Municipal bonds (no federal taxes paid on interest income)
")
24
Roth IRA* A modified individual retirement account in which a person can set aside after-tax income. Earnings on the account are tax-free, and tax- free withdrawals may be made after age 59 and a half. *Roth 401k works in same fashion as Roth IRA

25
If you expect or know that your tax rate will be lower when withdrawn (normally at retirement), you should consider tax-deferred investing. If you expect or know it will be higher when withdrawn, you should consider a Roth. How Do You Choose - Roth or Tax Deferred?

26
( Illustration: 9% Annual Return $2000 Annual Contribution) Roth IRA Returns (taxable at investment @15%) Tax-Deferred Returns (taxable at withdrawal @ x% rate)
 Roth IRA Returns (taxable at Tax-Deferred Returns (taxable at x% rate)")
27
Higher Taxes Impact Investment Growth Over Time Growth of $1 for various taxable income levels 1926–2007 Taxable income in 2005 dollars $50,000$75,000$100,000$125,000$150,000 0 $250 200 150 100 50 Ending wealth after tax

28
What if you can’t decide? Choosing either a Roth IRA or a traditional IRA is better than choosing nothing at all. BUT if your employer offers 401(k) matching that is by far the best choice. The money that the company uses to match your contribution is free money!
 matching that is by far the best choice. The money that the company uses to match your contribution is free money!.")
29
Enhancing Your Wealth: Employer Match Hypothetical value of $100 invested each month 1988–2007 $74,595 $111,892 0 20 40 60 80 100 $120k 1988199119941997200020032006 Stocks with 50% employer match Stocks

31
Risk of Stock Market Loss Over Time 1926–2007 One-year returns 5-year annualized returns 15-year annualized returns Each bar represents the average return for the preceding 5-year time period. Each bar represents the average return for the preceding 15-year time period. 50% 0 0 0 192619361946195619661976198619962006 Periods with gain Periods with loss 72% 28% 87% 13% 100%

32
Timeless advice Imagine that you invested $5,000 in the Standard and Poor’s 500 every year from 1988 to 1997. If your timing was perfect and you always invested on the one day of the year that the market was at its lowest, your $50,000 would have grown to $129, 134. What if your timing was less than perfect? What if it was downright aweful? Even if you invested on the worst day of each year, your $50,000 would still have grown to $105, 903. It’s time in the market, not timing the market that counts.

33
Dollar Cost Averaging The technique of buying a fixed dollar amount of a particular investment on a regular schedule, regardless of the share price. More shares are purchased when prices are low, and fewer shares are bought when prices are high.

34
Dollar-Cost-Averaging Month Amount Invested Share Price Shares Purchased Cumulative Value January$150 $30 5 $150.00 February$150 $30 5 $300.00 March $150 $25 6 $400.00 April$150 $25 6 $550.00 May$150 $20 7.5 $590.00 June$150$15 10 $592.50 July$150 $15 10 $742.50 August$150 $15 10 $892.50 September$150 $20 7.5 $1,340.00 October$150 $25 6 $1,825.00 November$150 $30 5 $2,340.00 December$150 $30 5 $2,490.00 TOTAL $1,800 83 $2,490.00 Average Cost $21.69 per share Average Price $23.33

35
High Withdrawal Rates Will Quickly Deplete Your Assets Simulated portfolio values (90% confidence level) Withdrawal rate: 8%7%6%5%4% $1 mil 500k 100 50 10 65 years old 100959085807570
 Withdrawal rate: 8%7%6%5%4% $1 mil 500k years old")
Similar presentations


 PLAN.>")


 at a financial institution. Certificates of.>")
 Plan Annuity Defined-Benefit Plan Defined- Contribution Plan Employer- Sponsored Retirement.>")

 contribute a limited yearly.>")


