Download presentation
Presentation is loading. Please wait.

1
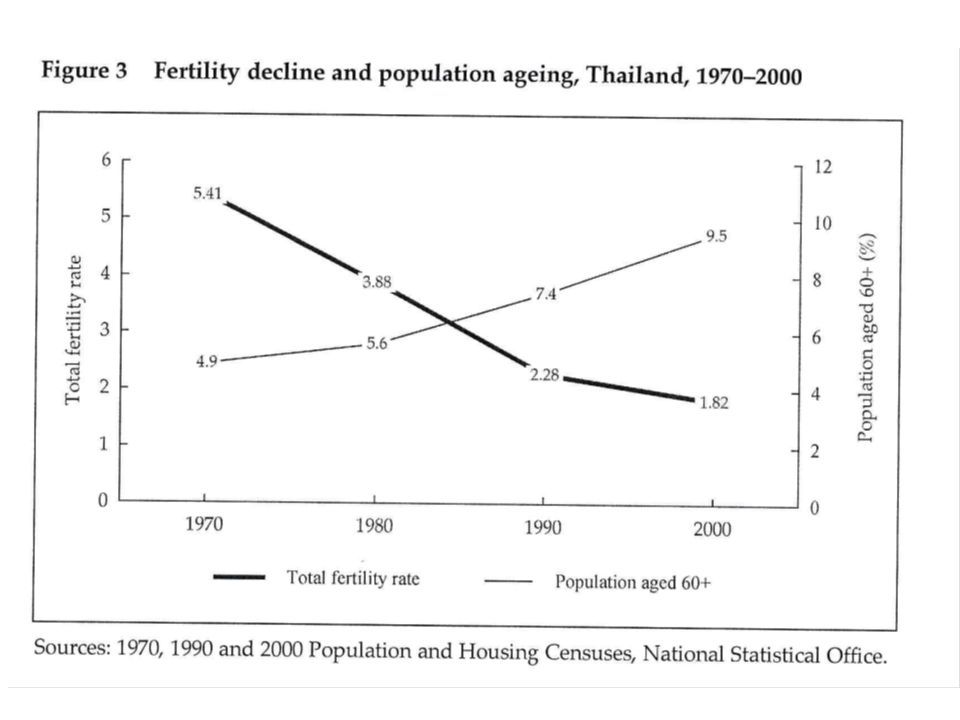
Qi Li, UCD Geary Institute Kasper Richter, World Bank Patrick Paul Walsh, UCD Geary Institute Fertility, Ageing and Socio-Economic Conditions in Thailand

3
How do Thai Firms Perceive the Investment Climate? Thai firms identify several categories of concerns: Dissatisfaction with overall economic situation (macroeconomic instability, economic policy uncertainty, insufficient demand for products, competition from imports) Inadequate supply of skills (skills and education of available workers, skilled labor shortage) Concerns with regulations and bureaucratic burden (tax administration and tax rates, bureaucratic burden, labor regulations, import regulations) Infrastructure and support services (electricity, utility prices, lack of business support services, lack of finance, inadequate supply of infrastructure)
 Inadequate supply of skills (skills and education of available workers, skilled labor shortage) Concerns with regulations and bureaucratic burden (tax administration and tax rates, bureaucratic burden, labor regulations, import regulations) Infrastructure and support services (electricity, utility prices, lack of business support services, lack of finance, inadequate supply of infrastructure).")
4
Age Structure by Urban and Rural in Year 1991, 1995 and 2000 Rural Urban

6
Ageing Index by Area

7
Fertility by Season and Urban and Rural during 1991 – 2000

8
One year Inward Migration by Region and Age Cohort during 1991 – 2000 Age 10 –20 Age 20 –30 0.0550 0.0841 Age 50 – 60 0.0142 * 1: Urban Areas; 2: Rural Areas 0.0394 0.0222

9
Under Three Years Inward Migration by Region and Age Cohort during 1991 – 2000 Age 10 –20 Age 20 – 30 0.1542 0.2696 Age 50 – 60 0.0474 * 1: Urban Areas; 2: Rural Areas 0.13410.0717

10
Waged and Unwaged Income Level in Thailand during 1991 – 2000

11
Waged and Unwaged Income Level By Urban and Rural during 1991 – 2000 Waged Unwaged

12
Waged and Unwaged Employment Share By Urban and Rural during 1991 – 2000 By Year

13
Waged and Unwaged Income Level By Urban and Rural during 1991 – 2000 * The initial levels are normalized to unit.

14
Childbearing Women Participation Rate By Urban and Rural Areas

15
Waged and Unwaged Employment Share of Childbearing Women By Urban and Rural during 1991 – 2000

16
Economic Effects on Age Structure Change through Fertility Rate Fertility Urban Rural Short Immigration 3.130* Rural > Urban Long Immigration -2.765* Rural > Urban Short Immigration -1.913* Urban > Rural Long Immigration 1.777* Urban > Rural Waged income Young/Old12.841*2.728* Unwaged income Young/Old-5.582*0.321 Waged Income (Childbearing)-1.384*-0.621* Unwaged Income (Childbearing)1.249*-0.097 Pension-1.561*1.296* Childbearing Women -1.633*-0.148* Employment Structure Waged/Unwaged Public Sector-3.025*0.241 Farm-0.2110.205* Bangkok -1.782* North -0.646*0.226 Northeast 0.1050.520* South -0.1270.435*
-1.384*-0.621* Unwaged Income (Childbearing)1.249* Pension-1.561*1.296* Childbearing Women *-0.148* Employment Structure Waged/Unwaged Public Sector-3.025*0.241 Farm * Bangkok * North *0.226 Northeast * South *")
17
Economic Effects on Age Structure through Mortality Rate (Urban) The corresponding economic variables at cohort level have been controlled, such as Waged income, Unwaged income, Pension and Education at cohort level. And we also control some cohort structure variables, such as gender structure of cohorts.

18
Economic Effects on Age Structure through Mortality Rate (Rural) The corresponding economic variables at cohort level have been controlled, such as Waged income, Unwaged income, Pension and Education at cohort level. And we also control some cohort structure variables, such as gender structure of cohorts.

19
(Sen) Economic and Human Development
 Economic and Human Development")
23
Economic Effects on Age Structure Change through Inward Migration Rate Age Cohort15 - 2020 - 3030 - 4040 - 5050 - 6060 - 70 Relative Waged Income -0.389*0.546*0.585*0.544*0.032-1.736* Relative Unwaged Income 0.051*-0.041-0.112*0.080*-0.166-0.142 Relative Pension 0.024-0.093*-0.086*0.294*0.054*-0.346* Participation Rate 1.667*-0.428*-0.3752.125*-1.999*-1.885 Education 0.064*-0.031-0.055*-0.111*0.0270.104 Overtime 0.01-0.036*-0.091*-0.154*-0.300*0.142* Public -1.052*1.021*-1.432*0.825*-2.2564.057 Private 0.480*-0.353*0.0522.413*0.887*-1.176 business-0.092*0.111*0.05-0.221*-0.487*0.209 farm-0.043*0.039*0.0210.097*-0.0710.222* Bangkok 0.361*-0.294*-0.581*-0.643*-0.837*0.625* North 0.040.008-0.0440.303*-0.075-0.794* Northeast -0.073-0.111*0.0760.353*-0.327*-0.961* South -0.161*-0.016-0.0310.088-0.327*-0.161 Urban -0.548*-0.0450.492*1.609*0.2970.233

Similar presentations


 REGION by Samir Radwan IFAD Governing Council Roundtable on Promoting.>")


