Download presentation
Presentation is loading. Please wait.

1
Presented By: Martin Friedl Jeremy Miller Michael Sawires Research in Sputtered Amorphous Silicon Thin Film Solar Cells

2
The Current State of Solar Power “Total installed [photovoltaic] capacity in the world now amounts to around 40 GW, producing some 50 terawatt- hours (TWh) of electrical power every year.” – EPIA, May 2011 Only about 0.2% of the total global generated electricity in 2010 comes from PV sources Solar will become increasingly important in the future as we begin to rely less on fossil fuels and turn to renewable energy sources for our power needs
![The Current State of Solar Power Total installed [photovoltaic] capacity in the world now amounts to around 40 GW, producing some 50 terawatt- hours (TWh) of electrical power every year. – EPIA, May 2011 Only about 0.2% of the total global generated electricity in 2010 comes from PV sources Solar will become increasingly important in the future as we begin to rely less on fossil fuels and turn to renewable energy sources for our power needs](http://images.slideplayer.com/14/4215813/slides/slide_2.jpg "The Current State of Solar Power Total installed [photovoltaic] capacity in the world now amounts to around 40 GW, producing some 50 terawatt- hours (TWh) of electrical power every year. – EPIA, May 2011 Only about 0.2% of the total global generated electricity in 2010 comes from PV sources Solar will become increasingly important in the future as we begin to rely less on fossil fuels and turn to renewable energy sources for our power needs")
3
Advantages of Silicon Solar Cells Why Silicon? Non-toxic Abundant Relatively cheap Mature infrastructure from computer industry c-Si Cell p-Si Cell a-Si Cell

4
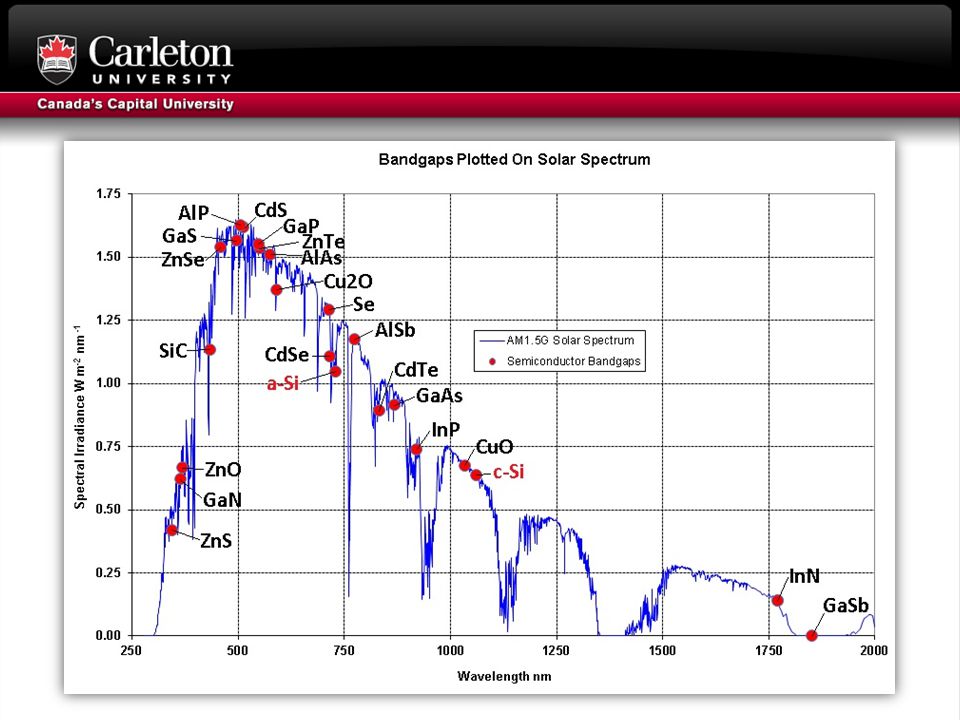
Monocrystalline Silicon Solar Cells c-Si Cell p-Si Cell Advantages of c-Si Up to 27.6% lab efficiencies Little degradation over time Disadvantages of c-Si High temperature and energy intensive manufacturing process Use a relatively large amount of Si Expensive Fragile Low band-gap (1.17 eV ≈ 1060nm) c-Si Ingot made using Czochralski process:
 c-Si Ingot made using Czochralski process:")
5
Amorphous Silicon Cells Advantages of a-Si TF Saves raw material Can be deposited on flexible substrates Higher photon absorbance than c-Si More desirable band-gap Potential roll to roll manufacturing would make it very cheap to produce Disadvantages of a-Si TF Less efficient than c-Si Currently lower % efficiency per $ cost than c-Si Degrades over time c-Si Structurea-Si Structure a-Si Atomic Model a-Si Cell

7
Principles of Operation PN Junctions PIN Junctions Schottky Junctions

8
PN Junctions Made by bringing a p and an n layer together Electrons move to p, holes to n Electric field builds up

9
PN Junctions Band diagrams: Use as a photodetector vs. solarcell

10
PIN Junctions Intrinsic region provides more carriers

11
PIN Junctions Advantages: Thicker depletion region, absorb more penetrating wavelengths As a diode, less capacitance, can be used in HF applications Disadvantage: Not practical in LF applications Power consuming due to reverse recovering time

12
Schottky Junctions Metal-Semiconductor junction Reverse Bias Forward Bias

13
Schottky Junction Advantages: Low forward voltage, responds to less intensity of light Smaller dielectric (ε) due to metal, lower capacitance, HF applications Disadvantages: Thin barrier makes it easy for charges to leak Low reverse breakdown voltage, high reverse current.
 due to metal, lower capacitance, HF applications Disadvantages: Thin barrier makes it easy for charges to leak Low reverse breakdown voltage, high reverse current.")
14
Fill Factor and Efficiency Fill Factor: Efficiency:

15
Cell Design Schottky Solar Cell P-I-N Solar Cell

16
Schottky Solar Cell

17
PIN Solar Cell

18
Manufacturing Our Cells Lab Machines and Processes Used Steps in manufacturing

19
Balzer Oven (Electron Beam Physical Vapor Deposition) Sample Goes Here Metal Filled Crucible A form of Physical Vapor Deposition (PVD), uses e-beam to vaporize metal and deposit it on a sample How It Works Operates under high vacuum, ~10 -6 Torr Heats target metal with electron beam Heated metal melts and vaporizes Metal gets deposited on wafers above
 Sample Goes Here Metal Filled Crucible A form of Physical Vapor Deposition (PVD), uses e-beam to vaporize metal and deposit it on a sample How It Works Operates under high vacuum, ~10 -6 Torr Heats target metal with electron beam Heated metal melts and vaporizes Metal gets deposited on wafers above")
20
Varian Sputtering Chamber Begins under high vacuum, ~10 -6 Torr 25%H/75%Ar gas pumped in brings pressure up to 5 millitorr (mT) RF gun creates electric field Causes Ar + ions to strike Si target Si atoms ejected from target, get deposited on sample below How It Works RF Guns + Si Targets Sample + Shutter A form of Physical Vapor Deposition (PVD), uses RF plasma sputtering to deposit Si onto sample
 RF gun creates electric field Causes Ar + ions to strike Si target Si atoms ejected from target, get deposited on sample below How It Works RF Guns + Si Targets Sample + Shutter A form of Physical Vapor Deposition (PVD), uses RF plasma sputtering to deposit Si onto sample")
21
Al 1000nm Manufacturing of the Schottky Cell c-Si Wafer Al 1000nm c-Si Wafer Al 1000nm Ti 100nm c-Si Wafer Start with a standard 4-inch Si wafer Evaporate on Al rear contact in Balzers Deposit thin layer of Ti on top in Balzers c-Si Wafer Al 1000nm a-Si ~500nm a-Si 500nm Al 100nm c-Si Wafer Ti 100nm a-Si ~500nm Pt 10nm c-Si Wafer Al 1000nm Ti 100nm Pt 10nm a-Si ~500nm Pt 10nm Sputter amorphous silicon layer in Varian Evaporate on thin Pt dots in Balzers using a mask Deposit thicker Al dots in Balzers using a slightly offset mask NOTE: Wafer thicknesses NOT to scale Ti 100nm

22
Manufacturing of the P-I-N Cell NOTE: Wafer thicknesses NOT to scale c-Si Wafer Start with a standard 4-inch Si wafer Mask off part of Ti layer to make the negative contact Pt 10nm Remove contact mask, deposit Pt dots in Balzers Al 100nm Deposit thicker Al dots in Balzers using a slightly offset mask c-Si Wafer Deposit thicker layer of Ti on top in Balzers Ti 500nm c-Si Wafer a-Si (P) ~500nm a-Si (P) 500nm Sputter amorphous P-doped silicon layer in Varian c-Si Wafer Ti 500nm Mask Ti 500nm Mask c-Si Wafer a-Si (P) ~500nm a-Si (I) 500nm Sputter amorphous undoped silicon layer in Varian Ti 500nm Mask a-Si (I) ~500nm c-Si Wafer a-Si (P) ~500nm a-Si (N) 200nm Sputter amorphous N-doped silicon layer in Varian Ti 500nm Mask a-Si (I) ~500nm a-Si (N) ~200nm c-Si Wafer a-Si (P) ~500nm Ti 500nm a-Si (I) ~500nm a-Si (N) ~200nm Pt 10nm c-Si Wafer a-Si (P) ~500nm Ti 500nm a-Si (I) ~500nm a-Si (N) ~200nm Ti 500nm Al 100nm
 ~500nm a-Si (P) 500nm Sputter amorphous P-doped silicon layer in Varian c-Si Wafer Ti 500nm Mask Ti 500nm Mask c-Si Wafer a-Si (P) ~500nm a-Si (I) 500nm Sputter amorphous undoped silicon layer in Varian Ti 500nm Mask a-Si (I) ~500nm c-Si Wafer a-Si (P) ~500nm a-Si (N) 200nm Sputter amorphous N-doped silicon layer in Varian Ti 500nm Mask a-Si (I) ~500nm a-Si (N) ~200nm c-Si Wafer a-Si (P) ~500nm Ti 500nm a-Si (I) ~500nm a-Si (N) ~200nm Pt 10nm c-Si Wafer a-Si (P) ~500nm Ti 500nm a-Si (I) ~500nm a-Si (N) ~200nm Ti 500nm Al 100nm")
23
A Few More Pictures of the Varian Si Targets Loaded Wafer Varian + Controls

24
Testing and Results Testing Methods Cell Fill Factor Cell Efficiencies

25
Testing Probe station and microscope light Tested 20 center contacts Back contact to the chuck Data recorded with HP 4155 Made use of Matlab script to analyze data Probe (+) Chuck (-)
 Chuck (-)")
26
Testing Testing for thicknesses: SEM images of cross sections of cells Schottky PIN a:Si Ti 1um Ti P-Doped a:Si Intrinsic a:Si N-Doped a:Si Schottcky Barrier PIN

27
Cell Testing The parameters of the light source at Carleton were unknown Verified testing results at OttawaU AM1.5G Conditions Carleton curve multiplied by factor of 25. Testing Challenges

28
Data from Thin Film Cell Results the of some of the best Schottky solar cells: Cell: R-21(6,7), thickness of ~500nm 25% H/Ar, 325 o C Fill Factor: 0.23 Efficiency: 0.002% (1cm 2 ) ~5m 2 to charge iPod (in California) Al 100nm c-Si Wafer Al 1000nm Ti 100nm a-Si ~500nm Pt 10nm Probe
, thickness of ~500nm 25% H/Ar, 325 o C Fill Factor: 0.23 Efficiency: 0.002% (1cm 2 ) ~5m 2 to charge iPod (in California) Al 100nm c-Si Wafer Al 1000nm Ti 100nm a-Si ~500nm Pt 10nm Probe")
29
Data from Thin Film Cell Explanations for Poor results Current travels through thick substrate ~0.5mm Multiple unintended Schottky Barriers Pt 10nm Al 100nm Al 1000nm a-Si ~500nm Ti 100nm c-Si Wafer Schottky Barriers Probe

30
Pt 10nm Solutions to Challenges Etching of a:Si layer Allow probe to make direct contact onto the Ti layer Current no longer has to go through substrate Avoids multiple Schottky Barriers Al 100nm Al 1000nm a-Si ~500nm Ti 100nm c-Si Wafer Probe

31
Solutions to Challenges Etching Results: Cells behave like resistors Mostly likely due to proximity of probes

32
PIN Cell Results Best results for PIN Cell: Wafer, S-2, (4,5) Thickness ~ 260nm Estimated Fill Factor of 0.37 Further testing required due to noise on result Results vary depending on probe proximity Al 100nm Pt 10nm c-Si Wafer a-Si (P) ~130nm Ti 500nm a-Si (I) ~130nm a-Si (N) ~200nm Probe
 Thickness ~ 260nm Estimated Fill Factor of 0.37 Further testing required due to noise on result Results vary depending on probe proximity Al 100nm Pt 10nm c-Si Wafer a-Si (P) ~130nm Ti 500nm a-Si (I) ~130nm a-Si (N) ~200nm Probe")
33
Conclusion What we’d like to achieve: Further Testing in a:Si PIN cells Efficiency values Consistent contact design Summary: a:Si thin film remains a cheap & non-toxic way to produce solar cells More desirable than c:Si Potentially cheaper to manufacture then most other cell types

34
Other Research This Summer ELEC 4703 – New Solar Cell Course (Winter 2012) Building New Photonics Testing Stage
 Building New Photonics Testing Stage")
35
Commercial Solar Cells Amorphous Monocrystalline Polycrystalline Different solar cells to be tested by students for efficiency comparison

36
Bulbs – Solar Replicator Xenon GaN Halogen

37
Vacuum Chuck + Peltier Cooler + Heat Sink Arduino Running PID Code Peltier Cooler + Arduino + PID Chuck Takes excess heat energy from vacuum chuck, transfers it to heat sink Runs on 12V DC switched by MOSFET Peltier Cooler Arduino Control Microcontroller measures temperature of chuck and heat sync Pulse width modulates MOSEFT to regulate chuck temperature to user setting PID Algorithm Proportional Integral Derivative (PID) “Learns” how chuck temperature responds to changes in duty cycle of MOSFET Calculates duty cycle of MOSFET to keep temperature to within 1 degree of set temp
 Learns how chuck temperature responds to changes in duty cycle of MOSFET Calculates duty cycle of MOSFET to keep temperature to within 1 degree of set temp")
38
Nano-Positioning Photonics Testing Stage Used to test optical devices produced in the microfab lab LUNA OBR 4600 used to characterize test devices Three NanoMax-341 3-axis stages from Thorlabs for fiber to device coupling Computer controlled stepper motors + piezo actuatorsComponents Specs 4mm of travel per axis 5nm piezo resolution 2-axis auto alignment on input and output side All positioning computer controlled through Agilent Vee Input Fiber OutputFiber DUT Stage LUNA OBR Controller Servers

39
Acknowledgements NSERC Dr. Winnie Ye Dr. Garry Tarr Dr. Karin Hinzer Nagui Mikhail Rob Vandeusen Rick Adams Angela Burns Dr. Tom Smy Blazenka Power Andrew Tam Ryan Griffin Svetlana Demtchenko Scott Ferguson Scott Bruce We would like to give special thanks to:

40
Figure References

Similar presentations