Download presentation
Presentation is loading. Please wait.

1
Unit 2 B Voltammetry and Polarography

2
Voltammetric methods of Analysis
What is Voltammetry? A time‑dependent potential is applied to an electrochemical cell, and the current flowing through the cell is measured as a function of that potential. A plot of current as a function of applied potential is called a voltammogram and is the electrochemical equivalent of a spectrum in spectroscopy, providing quantitative and qualitative information about the species involved in the oxidation or reduction reaction.

3
Voltametric Measurements
Three electrode system potentiostat mentioned earlier is used as a device that measures the current as a function of potential Working electrodes used: Hg, Pt, Au, Ag, C or others Reference electrode: SCE or Ag/ AgCl; Auxiliary electrode: Pt wire

4
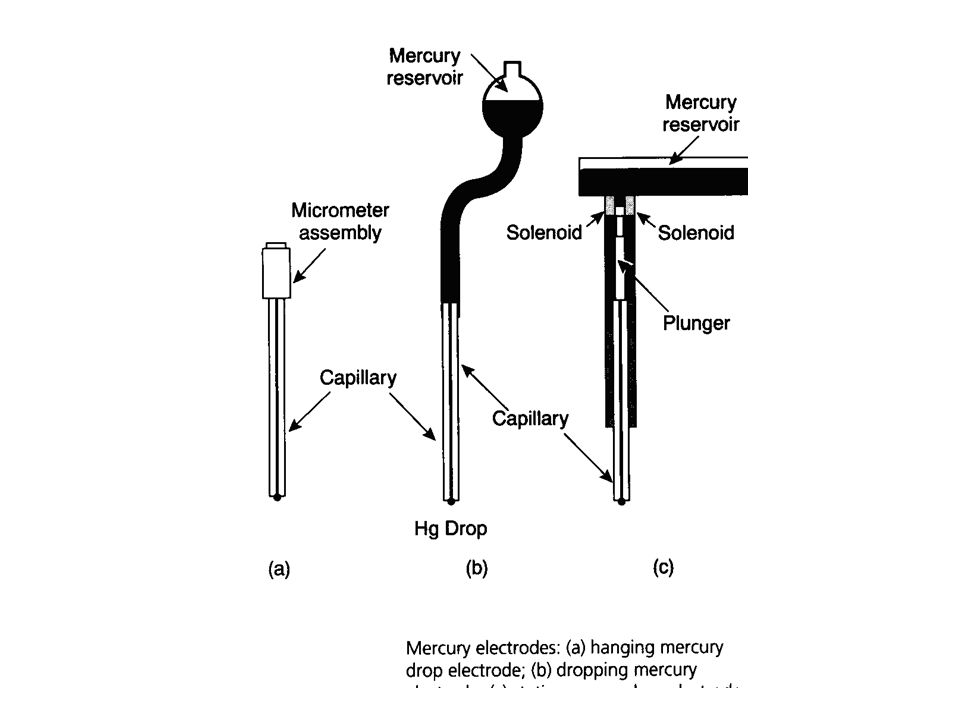
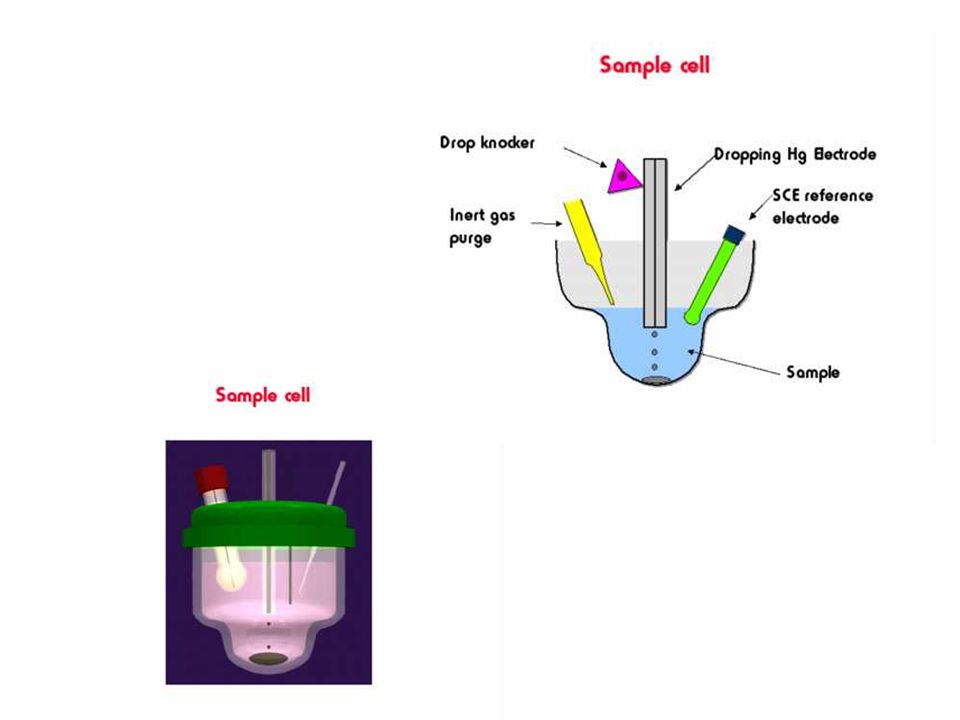
Polarography In polarography, the current flowing through the cell is measured as a function of the potential of the working electrode. Usually this current is proportional to the concentration of the analyte. Apparatus for carrying out polarography is shown below. The working electrode is a dropping mercury electrode or a mercury droplet suspended from a bottom of a glass capillary tube. Analyte is either reduced (most of the cases) or oxidized at the surface of the mercury drop. The current –carrier auxiliary electrode is a platinum wire. SCE or Ag/AgCl reference electrode is used. The potential of the mercury drop is measured with respect to the reference electrode.
 or oxidized at the surface of the mercury drop. The current –carrier auxiliary electrode is a platinum wire. SCE or Ag/AgCl reference electrode is used. The potential of the mercury drop is measured with respect to the reference electrode.")
6
Typical electrochemical
cell used in polarography

8
Why Dropping Mercury Electrode?
Hg yields reproducible current‑potential data. This reproducibility can be attributed to the continuous exposure of fresh surface on the growing mercury drop. With any other electrode (such as Pt in various forms), the potential depends on its surface condition and therefore on its previous treatment. The vast majority of reactions studied with the mercury electrode are reductions. At a Pt surface, reduction of solvent is expected to compete with reduction of many analyte species, especially in acidic solutions. The high overpotential for H+ reduction at the mercury surface. Therefore, H+ reduction does not interfere with many reductions.
, the potential depends on its surface condition and therefore on its previous treatment. The vast majority of reactions studied with the mercury electrode are reductions. At a Pt surface, reduction of solvent is expected to compete with reduction of many analyte species, especially in acidic solutions. The high overpotential for H+ reduction at the mercury surface. Therefore, H+ reduction does not interfere with many reductions.")
9
Problems with mercury electrode
A mercury electrode is not very useful for performing oxidations, because Hg is too easily oxidized. In a noncomplexing medium, Hg is oxidized near V (versus S.C.E.). For most oxidations, some other working electrode must be employed. Pt electrode Vs SCE; works for a range of to –0.2 in acidic solution +0.7 V to –1 V in basic solution. Carbon paste electrode is also used in voltammetry Mercury is toxic and slightly volatile, and spills are almost inevitable. a good vacuum cleaner. To remove residual mercury, sprinkle elemental zinc powder on the surface and dampen the powder with 5% aqueous H2S04 Mercury dissolves in the zinc. After working the paste into contaminated areas with a sponge or brush, allow the paste to dry and then sweep it up. Discard the powder appropriately as contaminated mercury waste
. For most oxidations, some other working electrode must be employed. Pt electrode Vs SCE; works for a range of +1.2 to –0.2 in acidic solution +0.7 V to –1 V in basic solution. Carbon paste electrode is also used in voltammetry. Mercury is toxic and slightly volatile, and spills are almost inevitable. a good vacuum cleaner. To remove residual mercury, sprinkle elemental zinc powder on the surface and dampen the powder with 5% aqueous H2S04. Mercury dissolves in the zinc. After working the paste into contaminated areas with a sponge or brush, allow the paste to dry and then sweep it up. Discard the powder appropriately as contaminated mercury waste.")
10
Current in Voltammetry
When an analyte is oxidized at the working electrode, a current passes electrons through the external electric circuitry to the auxiliary electrode. This current flows from the auxiliary to the working electrode, where reduction of the solvent or other components of the solution matrix occurs . The current resulting from redox reactions at the working and auxiliary electrodes is called a faradaic current. Sign Conventions A current due to the analyte's reduction is called a cathodic current and, by convention, is considered positive. Anodic currents are due to oxidation reactions and carry a negative value.

11
Influence of applied potential on the faradaic current
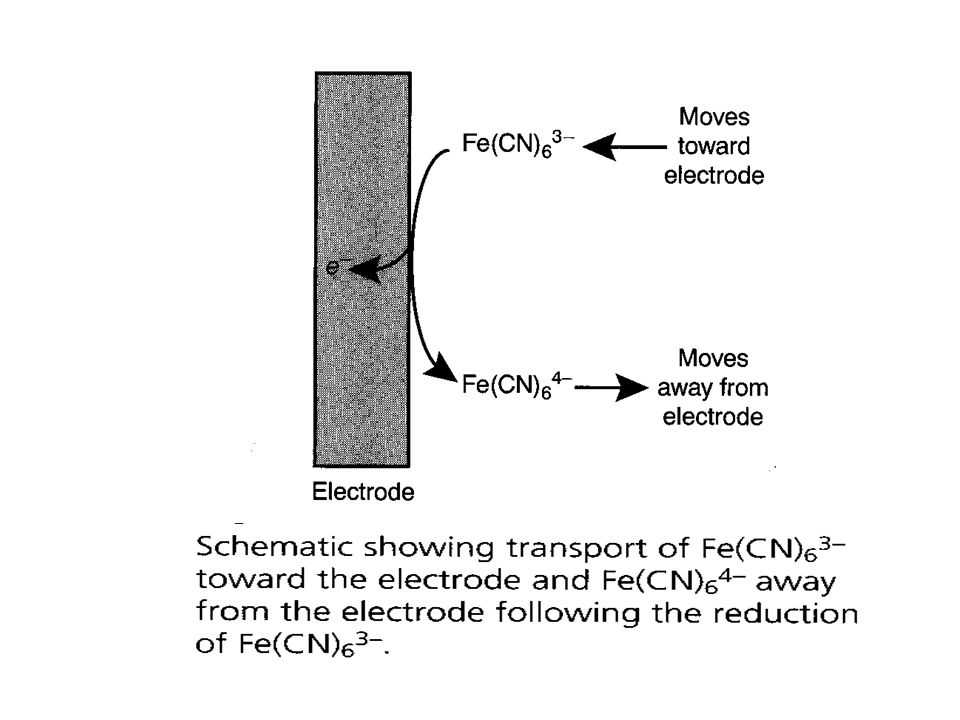
When the potential applied to the working electrode exceeds the reduction potential of the electroactive species, a reduction will take place at the electrode surface Thus, electroactive species diffuses from the bulk solution to the electrode surface and the reduction products diffuse from the electrode surface towards the bulk solution. This creates what is called the faradaic current.

13
The magnitude of the faradaic current is determined by the rate of the resulting oxidation or reduction reaction at the electrode surface. Two factors contribute to the rate of the electrochemical reaction: the rate at which the reactants and products are transported to and from the surface of the electrode (mass transport) and the rate at which electrons pass between the electrode and the reactants and products in solution. (kinetics of electron transfer at the electrode surface)
 and the rate at which electrons pass between the electrode and the reactants and products in solution. (kinetics of electron transfer at the electrode surface)")
14
Influence of Mass Transport on the Faradaic Current
There are three modes of mass transport to and from the electrode surface: diffusion, migration, and convection. Diffusion from a region of high concentration to a region of low concentration occurs whenever the concentration of an ion or molecule at the surface of the electrode is different from that in bulk solution. Convection occurs when a mechanical means is used to carry reactants toward the electrode and to remove products from the electrode. The most common means of convection is to stir the solution using a stir bar. Other methods include rotating the electrode and incorporating the electrode into a flow cell. Migration occurs when charged particles in solution are attracted or repelled from an electrode that has a positive or negative surface charge. Unlike diffusion and convection, migration only affects the mass transport of charged particles

15
The flux of material to and from the electrode surface is a complex function of all three modes of mass transport. In the limit in which diffusion is the only significant means for the mass transport of the reactants and products, the current in a voltammetric cell is given by where n is the number of electrons transferred in the redox reaction, F is Faraday's constant, A is the area of the electrode, D is the diffusion coefficient for the reactant or product, CbuIk and Cx=o are the concentration of the analyte in bulk solution and at the electrode surface, and is the thickness of the diffusion layer.

16
For the above equation to be valid, migration and convection must not interfere with formation of diffusion layer around the electrode surface. Migration is eliminated by adding a high concentration of an inert supporting electrolyte to the analytical solution. The large excess of inert ions, ensures that few reactant and product ions will move as a result of migration. Although convection may be easily eliminated by not physically agitating the solution, in some situations it is desirable either to stir the solution or to push the solution through an electrochemical flow cell. Fortunately, the dynamics of a fluid moving past an electrode results in a small diffusion layer, typically of ‑ 0.01‑cm thickness, in which the rate of mass transport by convection drops to zero.

17
Influence of the Kinetics of Electron Transfer on the Faradaic Current
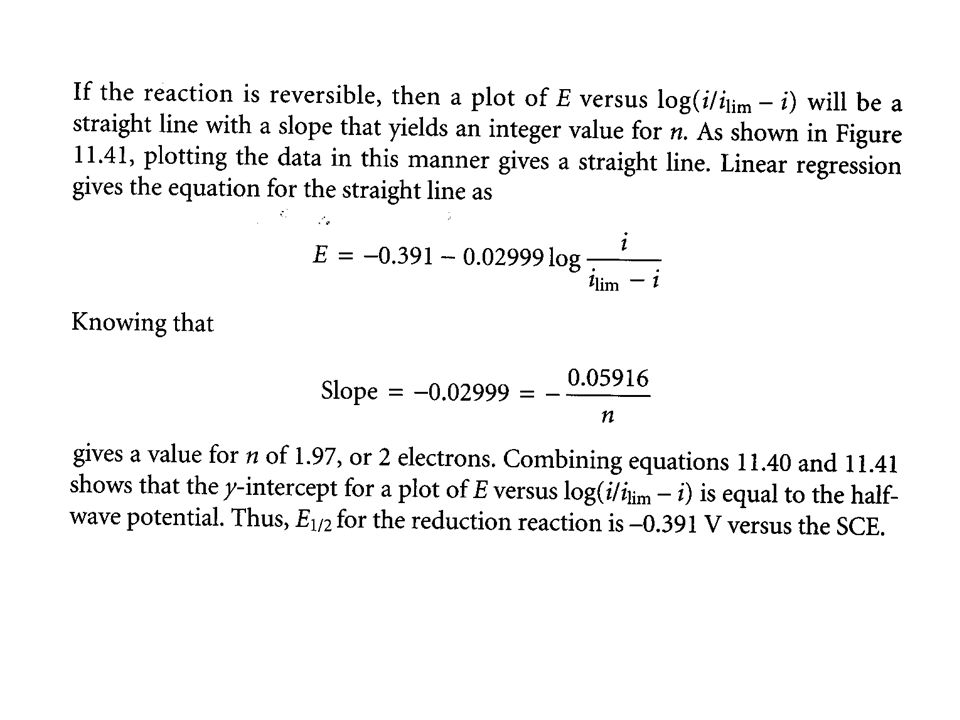
When electron transfer kinetics at the electrode surface are fast, the redox reaction is at equilibrium, and the concentrations of reactants and products at the electrode are those specified by the Nernst equation. Such systems are considered electrochemically reversible. In other systems, when electron transfer kinetics are sufficiently slow, the concentration of reactants and products at the electrode surface, and thus the current, differ from that predicted by the Nernst equation. In this case the system is electrochemically irreversible.

18
Non faradaie Currents Currents other than faradaic may also exist in an electrochemical cell that are unrelated to any redox reaction. These currents are called nonfaradaic currents The most important example of a nonfaradaic current occurs whenever the electrode's potential is changed. When mass transport takes place by migration negatively charged particles in solution migrate toward a positively charged electrode, and positively charged particles move away from the same electrode. When an inert electrolyte is responsible for migration, the result is a structured electrode‑surface interface called the electrical double layer, or EDL, The movement of charged particles in solution, gives rise to a short‑lived, nonfaradaic charging current. Changing the potential of an electrode causes a change in the structure of the EDL, producing a small charging current.

19
Residual Current Even in the absence of analyte, a small current flows through an electrochemical cell. This current, which is called the residual current, consists of two components: a faradaic current due to the oxidation or reduction of trace impurities, a charging current. it is the current needed to charge or discharge the capacitor formed by the electrode surface‑solution interface. This is called the condenser current or charging current. It is present in all voltammetric and polarographic experiments, regardless of the purity of reagents. As each drop of mercury falls, it carries its charge with it to the bottom of the cell. The new drop requires more current for charging.

20
SHAPE OF THE POLAROGRAM
A graph of current versus potential in a polarographic experiment is called a polarogram. Cd e Cd

21
When the potential is only slightly negative with respect to the calomel electrode, essentially no reduction of Cd2+ occurs. Only a small residual current flows. At a sufficiently negative potential, reduction of Cd2+ commences and the current increases. The reduced Cd dissolves in the Hg to form an amalgam. After a steep increase in current, concentration polarization sets in: The rate of electron transfer becomes limited by the rate at which Cd2+ can diffuse from bulk solution to the surface of the electrode. The magnitude of this diffusion current Id is proportional to Cd2+ concentration and is used for quantitative analysis. The upper trace in the Figure above is called a polarographic wave.

22
When the potential is sufficiently negativ around ‑1
When the potential is sufficiently negativ around ‑1.2 V, reduction of H+ begins and the curve rises steeply. At positive potentials (near the left side of the polarogram), oxidation of the Hg electrode produces a negative current. By convention, a negative current means that the working electrode is behaving as the anode with respect to the auxiliary electrode. A positive current means that the working electrode is behaving as the cathode. The oscillating current in the Figure above is due to the growth and fall of the Hg drops. As the drop grows, its area increases, more solute can reach the surface in a given time, and more current flows. The current increases as the drop grows until, finally, the drop falls off and the current decreases sharply.
, oxidation of the Hg electrode produces a negative current. By convention, a negative current means that the working electrode is behaving as the anode with respect to the auxiliary electrode. A positive current means that the working electrode is behaving as the cathode. The oscillating current in the Figure above is due to the growth and fall of the Hg drops. As the drop grows, its area increases, more solute can reach the surface in a given time, and more current flows. The current increases as the drop grows until, finally, the drop falls off and the current decreases sharply.")
23
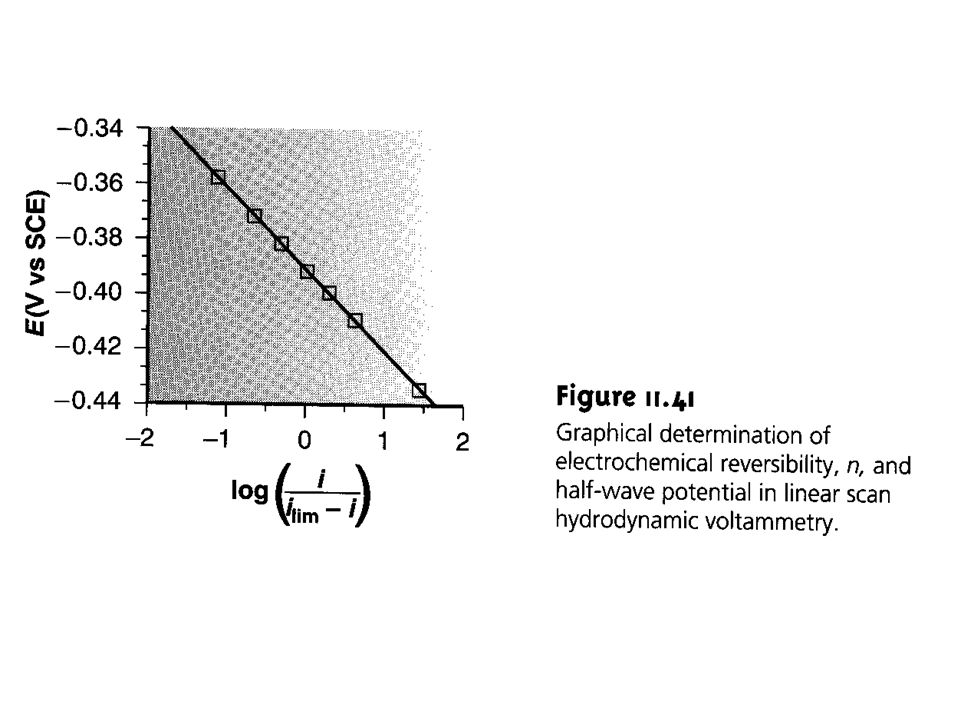
Shape of the voltammetric Wave
Eelectrode is related to the current during the scan of a voltammogram by the equation Eelectrode= Eappl = E1/2 - ( 0.059/n)log ( i /id-i ) where i is the value of the current at any applied potential. This equation holds for reversible systems. Thus, the value of n can be calculated if Eappl is plotted versus log ( i /id - i ) derived from the polarogram during the rising portion. The relationship is a straight line with a slope of ( /n) V. E1/2 in most cases is the same as the reaction’s standard state potential
log ( i /id-i ) where i is the value of the current at any applied potential. This equation holds for reversible systems. Thus, the value of n can be calculated if Eappl is plotted versus log ( i /id - i ) derived from the polarogram during the rising portion. The relationship is a straight line with a slope of ( /n) V. E1/2 in most cases is the same as the reaction’s standard state potential.")
24
Diffusion Current When the potential of the working electrode is sufficiently negative, the rate of reduction of Cd2+ ions is governed by the rate at which Cd2+ can reach the electrode. In the Figure above, this occurs at potentials more negative than ‑0.7 V. In an unstirred solution, the rate of reduction is controlled by the rate of diffusion of analyte to the electrode. In this case, the limiting current is called the diffusion current. The solution must be perfectly quiet to reach the diffusion limit in polarography. Thus, the diffusion current is the limiting current when the rate of electrolysis is controlled by the rate of diffusion of species to the electrode. Cd2+ + 2e Cd

25
Current rate of diffusion [C]o - [C]s
The [C]o and [C]s are the concentrations in the bulk solution and at the electrode surface. The greater the difference in concentrations the more rapid will be the diffusion. At a sufficiently negative potential, the reduction is so fast that the [C]s << [C]o and equation above reduces to the form Limiting current = diffusion current [C]o The ratio of the diffusion current to the bulk solute concentration is the basis for the use of voltammetry in analytical chemistry
![Current rate of diffusion [C]o - [C]s](http://slideplayer.com/slide/4214730/14/images/25/Current+%EF%81%A1+rate+of+diffusion+%EF%81%A1+%5BC%5Do+-+%5BC%5Ds.jpg "The [C]o and [C]s are the concentrations in the bulk solution and at the electrode surface. The greater the difference in concentrations the more rapid will be the diffusion. At a sufficiently negative potential, the reduction is so fast that the [C]s << [C]o and equation above reduces to the form. Limiting current = diffusion current [C]o. The ratio of the diffusion current to the bulk solute concentration is the basis for the use of voltammetry in analytical chemistry.")
26
The magnitude of the diffusion current, is given by the Ilkovic equation:
ld = (7.08 x 10⁴)nCD1/2 m 2/3 t 1/6 where Id = diffusion current, measured at the top of the oscillations in the Figure above with the units µA n = number of electrons per molecule involved in the oxidation or reduction of the electroactive species. C = concentration of electroactive species, with the units mmol/L D = diffusion coefficient of electroactive species, with the units M2/s m =rate of flow of Hg, in mg/s t = drop interval, in s The number 7.08 x 10⁴ is a combination of several constants whose dimensions are such that ld will be given in , µA
nCD1/2 m 2/3 t 1/6. where Id = diffusion current, measured at the top of the oscillations in the Figure above with the units µA. n = number of electrons per molecule involved in the oxidation or reduction of the electroactive species. C = concentration of electroactive species, with the units mmol/L. D = diffusion coefficient of electroactive species, with the units M2/s. m =rate of flow of Hg, in mg/s. t = drop interval, in s. The number 7.08 x 10⁴ is a combination of several constants whose dimensions are such that ld will be given in , µA.")
27
Thus, id is proportional to the concentration of a certain species under specific conditions and the above equation may be expressed as follows: id = kc where k is constant under the specific conditions. If k is constant for a series of standard solutions of various concentrations and an unknown, a calibration plot can be constructed and the unknown concentration can be determined. Clearly, the magnitude of the diffusion current depends on several factors in addition to analyte concentration. In quantitative polarography, it is important to control the temperature within a few tenths of a degree. The transport of solute to the electrode should be made to occur only by diffusion (no stirring).
.")
28
Supporting electrolyte
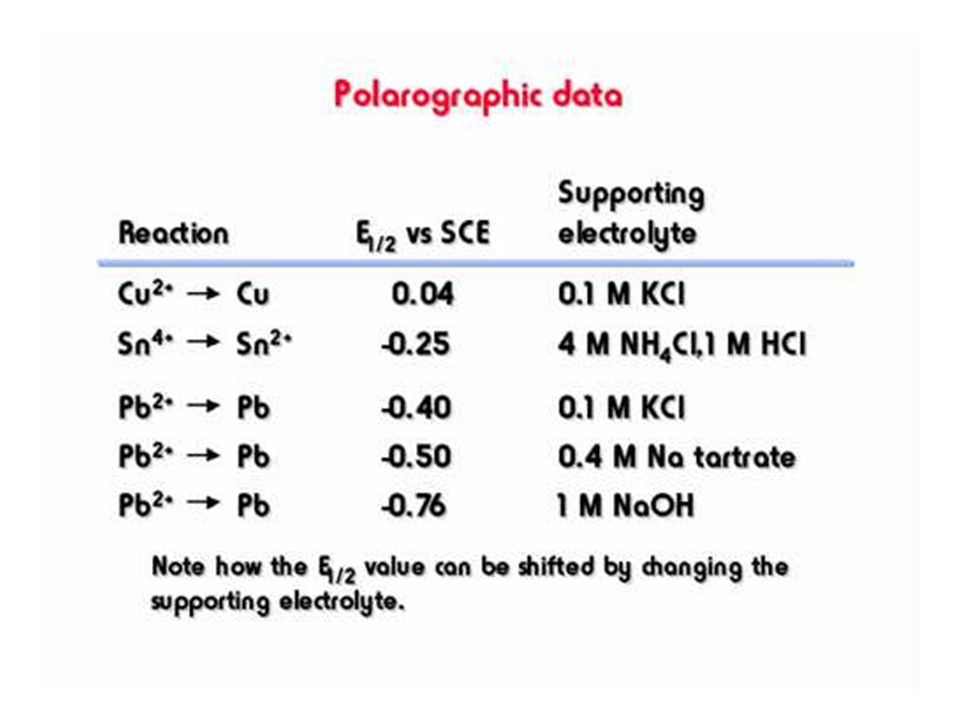
Current flow due to electrostatic attraction (or repulsion) of analyte ions by the electrode is reduced to a negligible level by the presence of a high concentration of supporting electrolyte (1 M HCl in the Figure above). Increasing concentrations of electrolyte reduces the net current, since the rate of arrival of cationic analyte at the negative Hg surface is decreased. Typically, a supporting electrolyte concentration 50‑100 times greater than the analyte concentration will reduce electrostatic transport of the analyte to a negligible level.
 of analyte ions by the electrode is reduced to a negligible level by the presence of a high concentration of supporting electrolyte (1 M HCl in the Figure above). Increasing concentrations of electrolyte reduces the net current, since the rate of arrival of cationic analyte at the negative Hg surface is decreased. Typically, a supporting electrolyte concentration 50‑100 times greater than the analyte. concentration will reduce electrostatic transport of the analyte to a negligible level.")
29
Half-wave Potential, E1/2
Half wave potential, E1/2 is an important feature can be derived from the plarogram. It is the potential corresponding to one half the limiting current i.e. id/2. El/2 is a characteristic for each element and thus used for qualitative analysis.

31
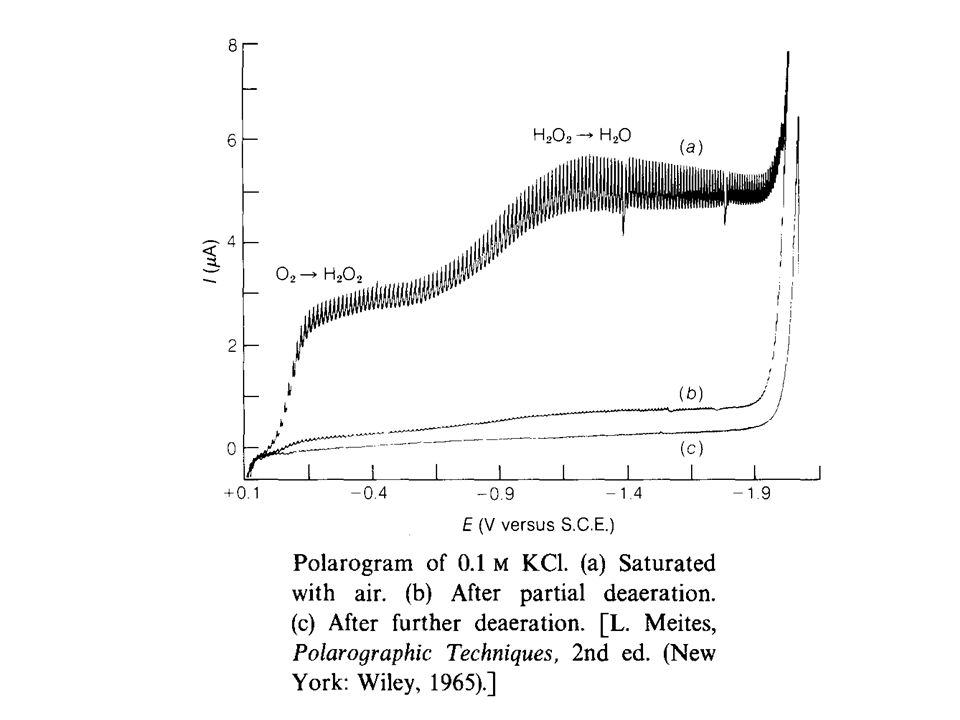
Effect of Dissolved Oxygen
Oxygen dissolved in the solution will be reduced at the DME leading to two well defined waves which were attributed to the following reactions: O2(g) + 2H+ + 2e- < ==== > H2O2; E1/2 = V H2O2 + 2H+ +2e- < ==== > 2H2O; E1/2 = V E1/2 values for these reductions in acid solution correspond to -0.05V and -0.8V versus SCE. This indicates that dissolved oxygen interferes in the determination of most metal ions. Therefore, dissolved O2 has to be removed by bubbling nitrogen free oxygen into the solution before recording the polarogram.
 + 2H+ + 2e- < ==== > H2O2; E1/2 = - 0.1V. H2O2 + 2H+ +2e- < ==== > 2H2O; E1/2 = - 0.9V. E1/2 values for these reductions in acid solution correspond to -0.05V and -0.8V versus SCE. This indicates that dissolved oxygen interferes in the determination of most metal ions. Therefore, dissolved O2 has to be removed by bubbling nitrogen free oxygen into the solution before recording the polarogram.")
33
Voltammetric Techniques
Normal Polarography The earliest voltammetric experiment was normal polarography at a dropping mercury electrode. In normal polarography the potential is linearly scanned, producing voltammograms (polarograms) such as that shown in Figure above. This technique is discussed above and usually called Direct Current (DC) polarography
 such as that shown in Figure above. This technique is discussed above and usually called Direct Current (DC) polarography.")
34
Differential Pulse Polarography
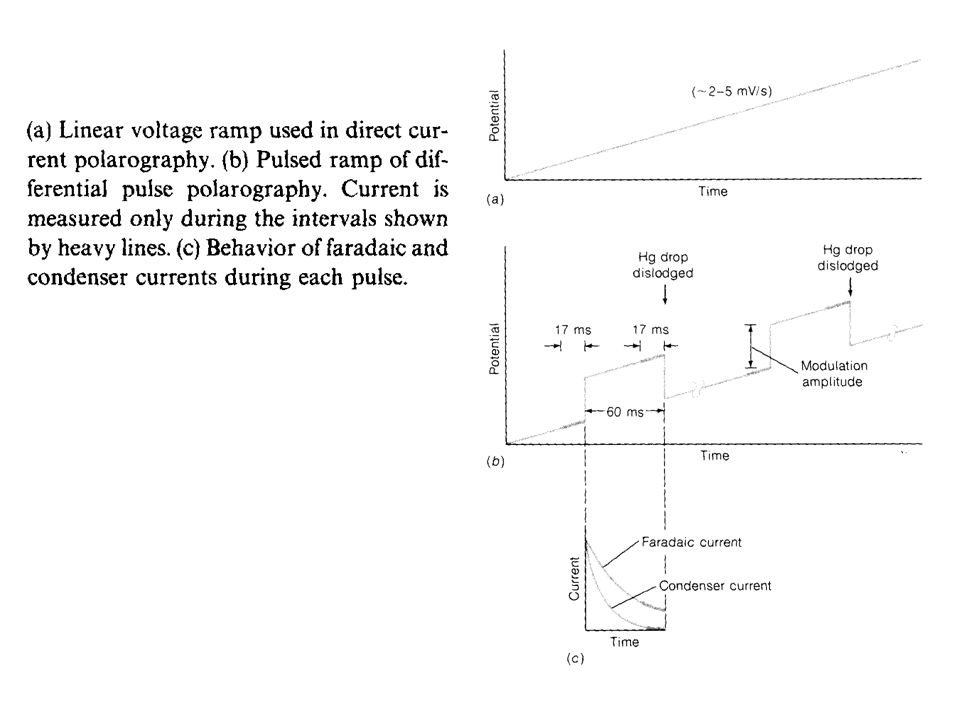
In direct current polarography, the voltage applied to the working electrode increases linearly with time, as shown above. The current is recorded continuously, and a polarogram such as that shown above results. The shape of the plot is called a linear voltage ramp. In differential pulse polarography, small voltage pulses are superimposed on the linear voltage ramp, as in the Figure below. The height of the pulse is called its modulation amplitude. Each pulse of magnitude 5‑100 mV is applied during the last 60 ms of the life of each mercury drop.

35
The drop is then mechanically dislodged.
The current is not measured continuously. Rather, it is measured once before the pulse and again for the last 17 ms of the pulse. The polarograph subtracts the first current from the second and plots this difference versus the applied potential (measured just before the voltage pulse). The resulting differential pulse polarogram is nearly the derivative of a direct current polarogram, as shown in the Figure below
. The resulting differential pulse polarogram is nearly the derivative of a direct current polarogram, as shown in the Figure below.")
39
Hydrodynamic Voltammetry
In hydrodynamic voltammetry the solution is stirred by rotating the electrode. Current is measured as a function of the potential applied to a solid working electrode. The same potential profiles used for polarography, such as a linear scan or a differential pulse, are used in hydrodynamic voltammetry. The resulting voltammograms are identical to those for polarography, except for the lack of current oscillations resulting from the growth of the mercury drops. Because hydrodynamic voltammetry is not limited to Hg electrodes, it is useful for the analysis of analytes that are reduced or oxidized at more positive potentials.

40
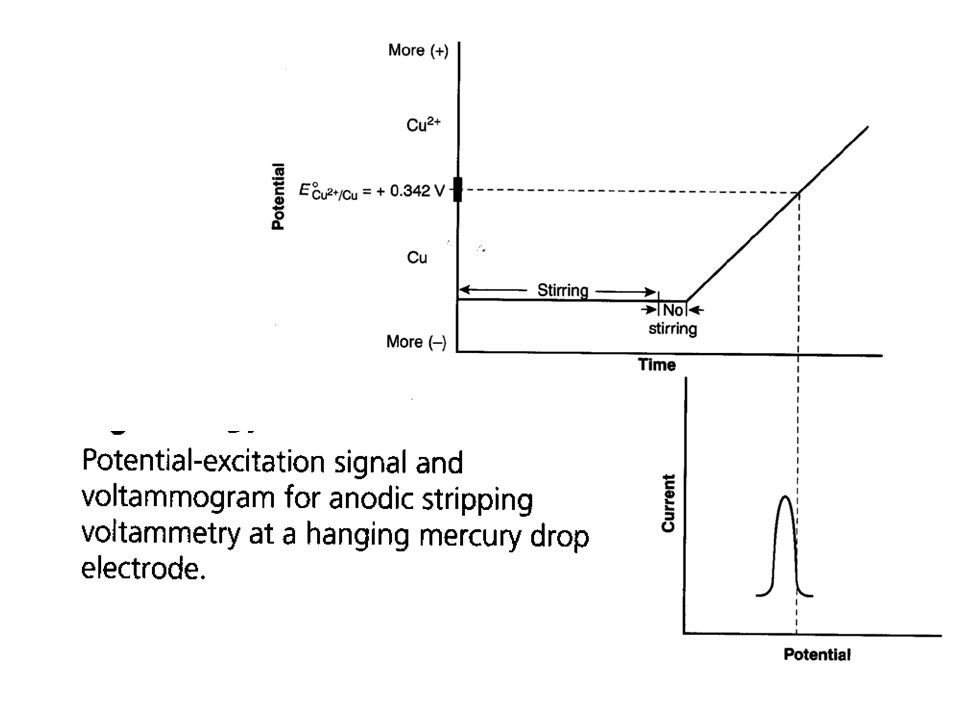
Stripping Ansalysis The analyte from a dilute solution is first concentrated in a single drop of Hg (or any micro-electorde) by electroreduction or electro-oxidation. The electroactive species is then stripped from the electrode by reversing the direction of the voltage sweep. The potential becomes more positive, oxidizing the species back into solution (anodic stripping voltammetry) or more negative reducing the species back into solution (cathodic stripping voltammetry) The current measured during the oxidation or reduction is related to the quantity of analyte The polarographic signal is recorded during the oxidation or reduction process. The deposition step amounts to an electrochemical preconcentration of the analyte; that is, the concentration of the analyte in the surface of the microelectrode is far greater than it is in the bulk solution.
 by electroreduction or electro-oxidation. The electroactive species is then stripped from the electrode by reversing the direction of the voltage sweep. The potential becomes more positive, oxidizing the species back into solution (anodic stripping voltammetry) or more negative reducing the species back into solution (cathodic stripping voltammetry) The current measured during the oxidation or reduction is related to the quantity of analyte. The polarographic signal is recorded during the oxidation or reduction process. The deposition step amounts to an electrochemical preconcentration of the analyte; that is, the concentration of the analyte in the surface of the microelectrode is far greater than it is in the bulk solution.")
42
Excitation signal for stripping determination of Cd2+ and Cu2+
Voltamrnograrn.

43
Amperometry A constant potential is applied to the working electrode, and current is measured as a function of time. Since the potential is not scanned, amperometry does not lead to a voltammogram. One important application of amperometry is in the construction of chemical sensors. One of the first amperometric sensors to be developed was for dissolved O2 in blood The design of the amperometric sensor is shown below and is similar to potentiometric membrane electrodes. A gas‑permeable membrane is stretched across the end of the sensor and is separated from the working and counter electrodes by a thin solution of KCI. The working electrode is a Pt disk cathode, and an Ag ring anode is the counter electrode Although several gases can diffuse across the membrane (O2, N2, CO2), only O2 is reduced at the cathode
, only O2 is reduced at the cathode.")
44
Differential-pulse anodic stripping voltammogram of 25 ppm zinc, cadmium, lead, and copper.

45
Clark amperometric Sensor for the Determination of Dissolved O2

46
Quantitative Analysis
The principal use of polarography is in quantitative analysis. Since the magnitude of the diffusion current is proportional to the concentration of analyte, the height of a polarographic wave tells how much analyte is present.

47
Hstandadr / hanalyte = Xstandard / Xanalyt
One Standard Method It is assumed that a linear relationship holds for the concentration and the wave height. Assuming that the wave heightes for the standard and the analyte were h1 and h2 and the concentrations were Xstandard and Xanalyte then, Hstandadr / hanalyte = Xstandard / Xanalyt

48
Standard curves The most reliable, but tedious, method of quantitative analysis is to prepare a series of known concentrations of analyte in otherwise identical solutions. A polarogram of each solution is recorded, and a graph of the diffusion current versus analyte concentration is prepared. Finally, a polarogram of the unknown is recorded, using the same conditions. From the measured diffusion current and the standard curve, the concentration of analyte can be determined. The figure below shows an example of the linear relationship between diffusion current and concentration.

49
Standard curve for polarographic analysis of Al(III) in 0
Standard curve for polarographic analysis of Al(III) in 0.2 M sodium acetate, pH 4.7. Id is corrected for the residual current
 in 0.2 M sodium acetate, pH 4.7. Id is corrected for the residual current.")
50
Example 1 Using a Standard Curve
Suppose that 5.00 mL of an unknown sample of Al(III) was placed in a 100‑mL volumetric flask containing mL of 0.8 M sodium acetate (pH 4.7) and 2.4 mM pontachrome violet SW (a maximum suppressor). After dilution to 100 mL, an aliquot of the solution was analyzed by polarography. The height of the polarographic wave was 1.53 µA, and the residual current‑measured at the same potential with a similar solution containing no Al(III)‑was µA. Find the concentration of Al(III) in the unknown.
 was placed in a 100‑mL volumetric flask containing mL of 0.8 M sodium acetate (pH 4.7) and 2.4 mM pontachrome violet SW (a maximum suppressor). After dilution to 100 mL, an aliquot of the solution was analyzed by polarography. The height of the polarographic wave was 1.53 µA, and the residual current‑measured at the same potential with a similar solution containing no Al(III)‑was 0.12 µA. Find the concentration of Al(III) in the unknown.")
51
The corrected diffusion current is 1.53 ‑ 0.12 = 1.41 µA.
In the figure above, 1.41 µA corresponds to [AI(III)] = mm. Since the unknown was diluted by a factor of 20.0 (from 5.00 mL to 100 mL) for analysis, the original concentration of unknown must have been (20.0)(0.126) = 2.46 mm.
] = mm. Since the unknown was diluted by a factor of 20.0 (from 5.00 mL to 100 mL) for analysis, the original concentration of unknown must have been. (20.0)(0.126) = 2.46 mm.")
52
Standard addition method
The standard addition method is most useful when the sample matrix is unknown or difficult to duplicate in synthetic standard solutions. This method is faster but usually not as reliable as the method employing a standard curve. First, a polarogram of the unknown is recorded. Then, a small volume of concentrated solution containing a known quantity of the analyte is added to the sample. With the assumption that the response is linear, the increase in diffusion current of this new solution can be used to estimate the amount of unknown in the original solution. For greatest accuracy, several standard additions are made.

53
rearrange and solve for Cx
The diffusion current of the unknown will be proportional to the concentration of unknown, Cx: ld(unknown) = kCx where k is a constant of proportionality. Let the concentration of standard solution be CS. When VS mL of standard solution is added to Vx mL of unknown, The diffusion current is the sum of diffusion currents due to the unknown and the standard. rearrange and solve for Cx
 = kCx. where k is a constant of proportionality. Let the concentration of standard solution be CS. When VS mL of standard solution is added to Vx mL of unknown, The diffusion current is the sum of diffusion currents due to the unknown and the standard. rearrange and solve for Cx.")
54
Example 2: Standard Addition Calculation
A 25.0‑mL sample of Ni2+ gave a wave height of 2.36 µA (corrected for residual current) in a polarographic analysis. When mL of solution containing 28.7 mM Ni2+ was added, the wave height increased to 3.79 µA. Find the concentration of Ni2+ in the unknown.
 in a polarographic analysis. When mL of solution containing 28.7 mM Ni2+ was added, the wave height increased to 3.79 µA. Find the concentration of Ni2+ in the unknown.")
55
Using the above Equation we can write:

56
Example 1

57
Example 2

59
Example 3

61
Example 4

Similar presentations

 A galvanic electrochemical cell at open circuit>")


 Comparison of Voltammetry to Other Electrochemical Methods 1.) Voltammetry: electrochemical method in which information about an analyte.>")


 Comparison of Voltammetry to Other Electrochemical Methods 1.) Voltammetry: electrochemical method in which information about an analyte.>")


 + 2H + (aq) Zn 2+ (aq) + H 2 (g). The oxidation number of Zn has.>")