Download presentation
Presentation is loading. Please wait.

1
Transmission Media (Chapter 7) Many of the figures are from the textbook.
 Many of the figures are from the textbook.")
2
Most of the diagrams in this powerpoint presentation (and future ones as well) come from the powerpoint file available via the book’s web site. They reflect diagrams contained in the textbook.

3
Twisted pair Figure 7.3 Twisted-pair cable

4
Figure 7.4 UTP and STP cables

5
twisted to avoid crosstalk [http://en.wikipedia.org/wiki/Inductance]http://en.wikipedia.org/wiki/Inductance] [http://en.wikipedia.org/wiki/Crosstalk] [http://en.wikipedia.org/wiki/Crosstalk [http://en.wikipedia.org/wiki/Twisted_pair]http://en.wikipedia.org/wiki/Twisted_pair]

6
CAT 1 through CAT 6 [http://en.wikipedia.org/wiki/Category_5_cable] [http://en.wikipedia.org/wiki/Category_5_cable] [http://www.duxcw.com/digest/Howto/network/cabl e/cable2.htm] [http://www.duxcw.com/digest/Howto/network/cabl e/cable2.htm]
![ CAT 1 through CAT 6 [ [ [ e/cable2.htm] [ e/cable2.htm]](http://images.slideplayer.com/14/4213399/slides/slide_6.jpg " CAT 1 through CAT 6 [ [ [ e/cable2.htm] [ e/cable2.htm]")
7
Coax cable: [http://en.wikipedia.org/wiki/Coaxial_cable]http://en.wikipedia.org/wiki/Coaxial_cable]

8
Optical fiber: Light Refraction and reflection

9
Optical signals are not electrical in nature and not subject to same interference as are electrical signals less attenuation [http://www.arcelect.com/fibercable.htm]http://www.arcelect.com/fibercable.htm]

10
LED/laser, multimode, graded index multimode, single mode LED/laser, multimode, graded index multimode, single mode modal dispersion (spreading of light in multimode fibers) infrared range of E/M waves. Dark Fiber: Optical fiber that’s in place but currently not being used

11
[http://electronics.howstuffworks.com/fiber- optic5.htm] [http://electronics.howstuffworks.com/fiber- optic5.htm] [http://electronics.howstuffworks.com/fiber- optic2.htm] [http://electronics.howstuffworks.com/fiber- optic2.htm]
![ [ optic5.htm] [ optic5.htm] [ optic2.htm] [ optic2.htm]](http://images.slideplayer.com/14/4213399/slides/slide_11.jpg " [ optic5.htm] [ optic5.htm] [ optic2.htm] [ optic2.htm]")
12
Wireless : Electromagnetic spectrum [http://www.lbl.gov/MicroWorlds/ALSTool/E MSpec/EMSpec2.html]http://www.lbl.gov/MicroWorlds/ALSTool/E MSpec/EMSpec2.html [http://www.purchon.com/physics/electromagn etic.htm] [http://www.purchon.com/physics/electromagn etic.htm]
![Wireless : Electromagnetic spectrum [ MSpec/EMSpec2.html] MSpec/EMSpec2.html [ etic.htm] [ etic.htm]](http://images.slideplayer.com/14/4213399/slides/slide_12.jpg "Wireless : Electromagnetic spectrum [ MSpec/EMSpec2.html] MSpec/EMSpec2.html [ etic.htm] [ etic.htm]")
13
Figure 7.18 Propagation methods

14
Table 7.4 Bands

15
Radio waves Generally between 3 KHz and 1 GHz Regulated by the FCC Low data rates and not particularly suited for digital communications Length of antenna proportional to the wavelength (inversely proportional to the frequency)
")
16
Project ELF [http://www.fas.org/nuke/guide/usa/c3i/elf.htm ]http://www.fas.org/nuke/guide/usa/c3i/elf.htm [http://enterprise.spawar.navy.mil/UploadedFil es/fs_clam_lake_elf2003.pdf]http://enterprise.spawar.navy.mil/UploadedFil es/fs_clam_lake_elf2003.pdf [http://en.wikipedia.org/wiki/Extremely_low_f requency]http://en.wikipedia.org/wiki/Extremely_low_f requency No longer active [http://www.senate.gov/~feingold/statements/0 3/01/2003310D02.html]. [http://www.senate.gov/~feingold/statements/0 3/01/2003310D02.html].
![Project ELF [ ] [ es/fs_clam_lake_elf2003.pdf] es/fs_clam_lake_elf2003.pdf [ requency] requency No longer active [ 3/01/ D02.html].](http://images.slideplayer.com/14/4213399/slides/slide_16.jpg "[ 3/01/ D02.html]..")
17
Danish King Harald Blatand: (Danish: Harald Blåtand, Old Norse: Haraldr blátönn, Norwegian: Harald Blåtann)Old Norse born around 935, the son of King Gorm the Old, king of Jutland (that is, peninsular Denmark) and of Thyra (also known as Thyre Danebod) a supposed daughter of Harald Klak, Jarl of Jutland, or daughter of a noblemen of Sønderjylland who is supposed to have been kindly disposed towards Christianity.ThyraHarald Klak He died in 986 having ruled as King of Denmark from around 958 and king of Norway for a few years probably around 970. Some sources state that he was forcefully deposed by his son Sweyn as king [Wikipedia]

18
You might know Blåtand by its other name Bluetooth [http://en.wiktionary.org/wiki/Bl%C3%A5tand]http://en.wiktionary.org/wiki/Bl%C3%A5tand [http://www.bluetooth.com] [http://www.bluetooth.com] http://www.bluetooth.com/Pages/Fast-Facts.aspx http://www.bluetooth.com/Pages/Fast-Facts.aspx

19
Wireless LANs: infrared vs radio waves covered later

20
Free space Optics : [http://www.freespaceoptics.org/]http://www.freespaceoptics.org optical technology without the fiber transmits using narrowly focused laser beams (10 12 Hz range, which is unregulated by law) line of sight buildings sway and can lose tracking (although can use auto tracking receivers) after about 1-2 km signal becomes less focused fog can disrupt public perception of birds flying into the path of a laser, getting fried, and falling to the ground.
 line of sight buildings sway and can lose tracking (although can use auto tracking receivers) after about 1-2 km signal becomes less focused fog can disrupt public perception of birds flying into the path of a laser, getting fried, and falling to the ground.")
21
Microwaves: parabolic and horn antenna, requires line-of-sight.

22
Satellites : Arthur C. Clarke wrote about them in 1940 Sputnik Sputnik Interestingly part of the sputnik crashed in Manitowoc [http://www.manitowoc.org/index.aspx?NID=1026]http://www.manitowoc.org/index.aspx?NID=1026] [http://www.roadsideamerica.com/sights/sightstory.p hp?tip_AttrId=%3D12959] [http://www.roadsideamerica.com/sights/sightstory.p hp?tip_AttrId=%3D12959]

23
Planetary Orbits: too slow and object falls to earth; too fast and it speeds into space Keplers laws of planetary motion defines the speed as a function of, in part, the distance from the planet Geosynchronous (22,300 miles) orbital speed matches earth’s rotation. By comparison, the space shuttle may orbit between 200 and 400 miles. 200 and 400 miles TV satellite technology uses geosynchronous orbits

24
LEO (Low Earth orbit) Satellites Satellites move relative to ground position Useful for surveillance
 Satellites Satellites move relative to ground position Useful for surveillance")
25
LEO systems Iridium Iridium Orbcomm Orbcomm GlobalStar GlobalStar Other references Other references

26
GPS Systems GPS Systems Applications to Einstein’s theory of relativity Applications to Einstein’s theory of relativity

27
Cell phones, grids Cell phones

28
Digital and Analog signals (Chapter 3 and 4) Digital signal vs analog signal Sound and images are naturally analog Computer data is digital
 Digital signal vs analog signal Sound and images are naturally analog Computer data is digital")
29
periodic signal: repeating signal Cycle: part that repeats Period (p): length of a cycle Frequency (f): 1/period (1 Hertz (Hz) = 1 cycle per second (cps) ) f = 1/p and p = 1/f KHz = 10 3 Hz; MHz = 10 6 Hz; GHz = 10 9 Hz Bandwidth: (frequency range) bit rate: # bits per second (bps or Kbps or Mpbs or Gbps)
: length of a cycle Frequency (f): 1/period (1 Hertz (Hz) = 1 cycle per second (cps) ) f = 1/p and p = 1/f KHz = 10 3 Hz; MHz = 10 6 Hz; GHz = 10 9 Hz Bandwidth: (frequency range) bit rate: # bits per second (bps or Kbps or Mpbs or Gbps)")
30
Periodic Analog signals (Chapter 3) An analog signal is defined by its frequency, amplitude, and phase.
 An analog signal is defined by its frequency, amplitude, and phase.")
31
Figure 3.3 Two signals with the same phase and frequency, but different amplitudes

32
Figure 3.4 Two signals with the same amplitude and phase, but different frequencies

33
Figure 3.5 Three sine waves with the same amplitude and frequency, but different phases

35
Maple worksheet has some examples

36
Figure 3.7 The time-domain and frequency- domain plots of a sine wave

37
Fourier results: a composite signal is a combination of simple sine and cosine wave with different frequencies and amplitudes. Applications to equalizers, filters, CATV. Ref: Maple worksheet [http://www.falstad.com/fourier/]http://www.falstad.com/fourier/] Skip sections 3.3 and 3.4

38
Bit rate limits: section 3.5

39
An analog signal with a fixed amplitude, frequency, and phase can represent a number of bits. Changing the characteristics at regular intervals can be used to transmit a bit stream bit rate: number of bits per second baud rate: frequency with which a signal’s characteristics change Higher frequency signals can have a higher baud rate.

40
Let n = #bits per baud and L = #different signals L=2 n Equivalently, n=log 2 (L) eg. L=8 amplitudes => n=3 bits per baud (since 2 3 = 8) Bit rate = baud rate ‧ n = baud rate ‧ log 2 (L)
 Bit rate = baud rate ‧ n = baud rate ‧ log 2 (L).")
41
Nyquist result: bit rate = 2 ‧ F ‧ n = 2 ‧ F ‧ log 2 (L) where F is the bandwidth (highest frequency minus lowest frequency) of the signal. This implies no theoretical limit on bit rates.

42
Does not consider Noise that affects a signal’s characteristics Limitations on devices to measure small differences between signals

43
Problem: noisy channels Large L (# different signals) means more subtle differences and more difficulty distinguishing them. Eg. With just a few amplitudes the amplitudes need not be close together. More amplitudes means the values are all closer together.

44
Shannon’s result: S and N are signal and noise power S/N ratio: 1 Bel = log 10 (S/N); 1 decibel (db) = 0.1 Bels Bit rate = bandwidth ‧ log 10 (1 + S/N) bps If little noise, S/N is large and the bit rate is larger. If lots of noise, bit rate is smaller.

45
Phone system: Maximum bit rates for dial-up modemsdial-up modems bandwidth ~ 3000 Hz S/N ratio ~ 35 db; 3.5 Bels = log 10 (S/N) S/N ~ 10 3.5 S/N ~ 3162 bit rate ~ 3000 ‧ log 10 (1 + 3162) ~ 35,000 bps max. This applies to old cases where there was a modem on each end.

46
56Kbps possible because remote end usually connected to an ISP and there’s no analog component at that end. Thus downloads do NOT encounter an analog- digital conversion at the remote end, which (using PCM-covered later) is susceptible to quantization noise.
 is susceptible to quantization noise..")
47
Can skip section 3.6

48
Digital data (Chapter 4). Can skip section 4.1 except for the schemes below. NRZ schemes: generally 0=high or low and 1=low or high (the opposite of 0) Ref: [http://www.frontiernet.net/~prof_tcarr/Encodi ngs/applet.html#APPLET] [http://www.frontiernet.net/~prof_tcarr/Encodi ngs/applet.html#APPLET] NRZ subject to baseline wandering or loss of synchronization. A very long string of 0s or 1s may be difficult to interpret correctly.
 Ref: [ ngs/applet.html#APPLET] [ ngs/applet.html#APPLET] NRZ subject to baseline wandering or loss of synchronization. A very long string of 0s or 1s may be difficult to interpret correctly..")
49
Manchester 1=Low-Hi, 0 = Hi-Low; Differential Manchester 1=no change at start, 0=change at start; transition in the middle. Manchester codes are self synchronizing frequency = 2 ‧ bit rate (an issue). Section 4.1 has many other schemes but we’ll skip most and defer a couple others until later to put them into a context.
. Section 4.1 has many other schemes but we’ll skip most and defer a couple others until later to put them into a context..")
50
Analog to digital (section 4.2) Can skip material not related to PAM or PCM Here we deal with analog data, not simple sine/cosine waves with fixed characteristics.
 Can skip material not related to PAM or PCM Here we deal with analog data, not simple sine/cosine waves with fixed characteristics.")
51
Sampling theorem F = max frequency receiver can reconstruct a signal by sampling it at least 2F times per second. Sample obtained by generating a sampling signal consisting of pulses at specified intervals.

52
[http://www.cs.cf.ac.uk/Dave/Multimedia/node149.h tml#sine]http://www.cs.cf.ac.uk/Dave/Multimedia/node149.h tml#sine] [http://www2.egr.uh.edu/~glover/applets/Sampling/S ampling.html] [http://www2.egr.uh.edu/~glover/applets/Sampling/S ampling.html
![ [ tml#sine] tml#sine] [ ampling.html] [ ampling.html](http://images.slideplayer.com/14/4213399/slides/slide_52.jpg " [ tml#sine] tml#sine] [ ampling.html] [ ampling.html")
53
Pulse Amplitude modulation Each pulse has analog characteristics in that it can be any real value

54
PCM (uncompressed video and audio) Divide vertical into bit groups Take samples and round to the nearest bit group. This rounding is called quantization noise and results in some signal loss.

55
[ http://en.wikipedia.org/wiki/PCM]http://en.wikipedia.org/wiki/PCM] Digitized voice (telephone) 8000 samples (4000 Hz max frequency) ‧ 8 bits per sample 64kbps CD player tech specs: Sampling frequency 44.1 KHz, D-A conversion = 16-bit linear frequency response up to ~20,000 Hz and 64,000 signal amplitudes.
 8000 samples (4000 Hz max frequency) ‧ 8 bits per sample 64kbps CD player tech specs: Sampling frequency 44.1 KHz, D-A conversion = 16-bit linear frequency response up to ~20,000 Hz and 64,000 signal amplitudes.")
56
Transmission Modes: Section 4.3

57
Figure 4.31 Data transmission and modes

58
Digital to analog (Section 5.1) Modulation: Amplitude Shift Keying (ASK) Frequency Shift keying (FSK) Phase shift keying (PSK) Quadrature modulation (QAM)
 Modulation: Amplitude Shift Keying (ASK) Frequency Shift keying (FSK) Phase shift keying (PSK) Quadrature modulation (QAM)")
59
ASK

60
FSK

61
PSK

62
Example Signal Association for Quadrature Amplitude Modulation Bit Values Amplitude of Generated Signal Phase Shift of Generated Signal 000A1A1 0 001A2A2 0 010A1A1 1/(4f) 011A2A2 1/(4f) 100A1A1 2/(4f) 101A2A2 2/(4f) 110A1A1 3/(4f) 111A2A2 3/(4f)
 011A2A2 1/(4f) 100A1A1 2/(4f) 101A2A2 2/(4f) 110A1A1 3/(4f) 111A2A2 3/(4f)")
63
Phase is relative to the signal in the previous interval

64
There is a simulation at [http://williams.comp.ncat.edu/Networks/modulate.h tm] Also look at [http://www.mathsnet.net/graphs/cuoc3.html]http://williams.comp.ncat.edu/Networks/modulate.h tmhttp://www.mathsnet.net/graphs/cuoc3.html]
![ There is a simulation at [ tm] Also look at [ tmhttp://](http://images.slideplayer.com/14/4213399/slides/slide_64.jpg " There is a simulation at [ tm] Also look at [ tmhttp://")
65
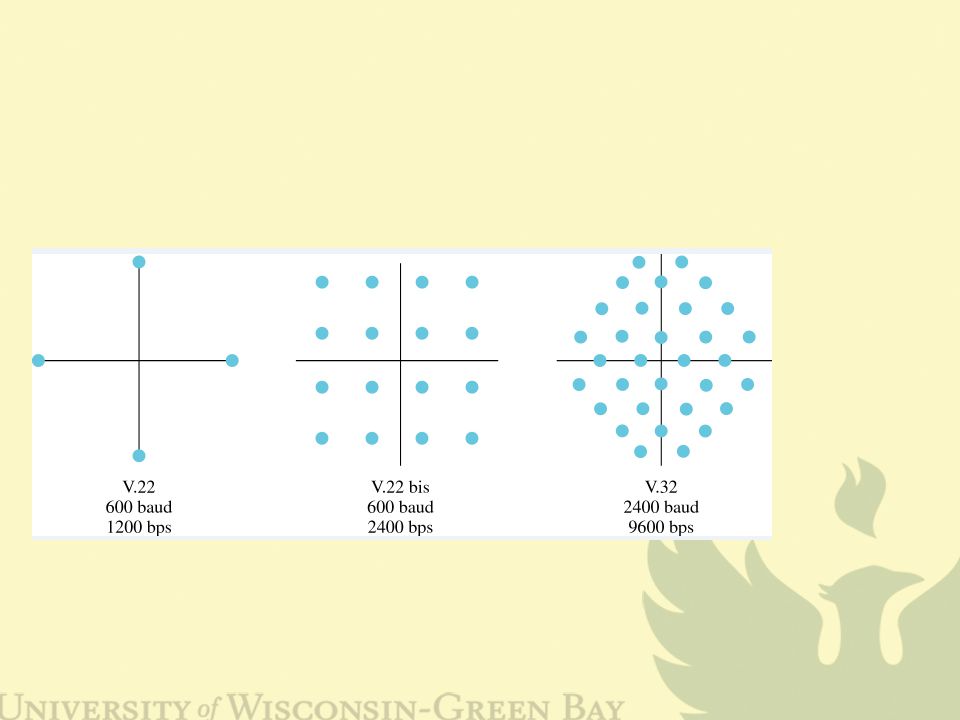
Signal constellation: Each signal is represented by a point as shown below is the phase shift r is the amplitude

68
Modems (standards defined by CCITT (now ITU) denoted by V.xxstandards See also Section 9.2
 denoted by V.xxstandards See also Section 9.2")
69
Figure 9.8 The V.32 and V.32bis constellation and bandwidth

70
Figure 9.9 Uploading and downloading in 56K modems

71
Cable modems Cable modems See also Section 9.5

72
DSL – Section 9.3 DSL (Digital Subscriber Line): DSL local loop (last mile) POTS (Plain Old Telephone system) not high quality like CAT5 and not likely to be ripped out and new wires installed (costly) It is capable of transferring higher frequencies than telephone produces.
: DSL local loop (last mile) POTS (Plain Old Telephone system) not high quality like CAT5 and not likely to be ripped out and new wires installed (costly) It is capable of transferring higher frequencies than telephone produces.")
73
Discrete Multitone Discrete Multitone Divide the frequency range from 0 Hz to 1.104 MHz into 256 separate channels Use the five lowest channels for POTS Use the remaining channels for upstream and/or downstream transmission with more channels reserved for downstream

74
some channels to be used by both upstream and downstream transfers To transmit data, divide a bit stream into smaller groups of bits, one group for each channel Apply a QAM technique to the bits in each channel

75
Combine the QAM-generated signals and subject the result to an Inverse Fast Fourier Transform. (Mathematical function that is able to determine frequency components of a complex signal) Downstream (in theory) up to 6 Mbps. Upstream is less.
 Downstream (in theory) up to 6 Mbps. Upstream is less..")
76
Figure 9.10 Discrete multitone technique

77
Multiplexing: Section 6.1 Multiplexing: combining multiple data signals onto a single data link.

78
Figure 6.4 FDM process

79
Figure 6.5 FDM demultiplexing example

80
Figure 6.11 Prisms in wavelength-division multiplexing and demultiplexing

81
Time Division Multiplexing

82
Figure 6.23 Digital hierarchy

83
Figure 6.24 T-1 line for multiplexing telephone lines

84
Figure 6.25 T-1 frame structure

85
Table 6.1 DS and T line rates

Similar presentations


>")


 We can carry digital values over analog.>")


 Given an analog function (voice?) we wish to represent it as a sequence of digital values Pulse Amplitude Modulation.>")


