Download presentation
Presentation is loading. Please wait.

1
An AQ Assessment Tool for Local Land Use Decisio ns MnAPA Annual Conference September 28, 2011 St. Cloud, Minnesota Mark Filipi, AICP PTP

2
Metropolitan Council Background 2009 legislative mandate to prepare Land Use and Planning Resources Report.

3
Land Use and Planning Resources Report Identify and assess land use & transportation strategies for 3 goals: Reduce air pollution, Mitigate congestion, and Reduce costs for operation, maintenance or improvement of infrastructure. Develop voluntary land use air quality assessment tool for local decision-makers.

4
Air Quality Assessment Tool Assess green house gases (along with other criteria pollutants). Based on local data to maximum extent possible.

5
Travel Model Data Requirements Data needed to develop assessment tool: Vehicle-miles-traveled data (VMT) – by trip purpose and community. VMT elasticity relationships to adjust “Base Case” VMT to “Alternative Land Use/Design Scenario” VMT based on difference between development scenarios.

6
AQ Emission Rate Data Requirements Data needed to develop assessment tool: Air pollutant emission rate data generated with MOVES2010 using local input data from various available existing sources.

7
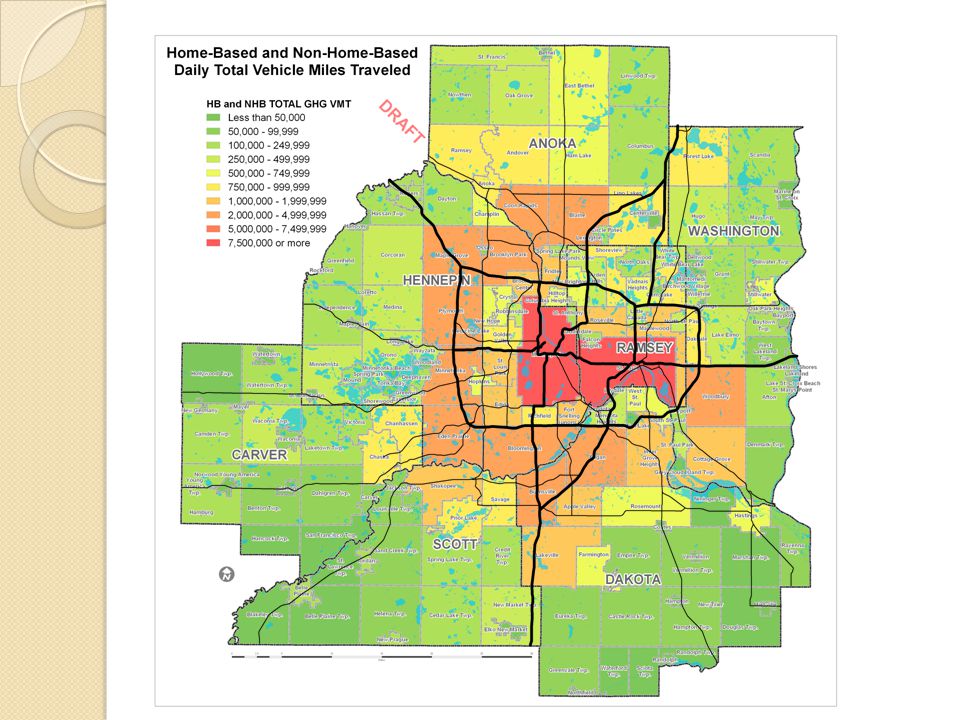
“Base Case” Land Use VMT Data Regional travel demand model used to estimate and tabulate baseline “Base Case” VMT. VMT aggregated for: Home-Based, Non-Home Based, Through, and Truck Trips

8
Community Aggregation TAZ based VMT aggregated to communities based on: Existing list of community TAZs, and TAZs with only a portion in a community – GIS used to calculate area in community and homogenous distribution of land uses assumed to exist, so TAZ total VMT multiplied by calculated percent in community.

9
Calculation of VMT rates for HB and NHB Trips Population, household and employment data taken from Council website to ensure consistency with publicly available data. VMT for Home-Based trips divided by # of households in community. VMT for Non-Home Based trips divided by # of employees.

10
Range of Resulting VMT Rates Definitions: Free Standing Growth Center – typically old farm community with job opportunities commensurate with residential intensity Rural Community – Typically a few households clustered around a crossroads with a few businesses thrown in SubAreaHB VMT per HHNHB VMT per Employee Central City3219 Suburb5527 Free Standing Growth Center 4222 Rural Community9365 Township11584

13
Land Use Strategies and Elasticities Travel and the Built Environment: A Meta-Analysis; Ewing and Cervero; JAPA; Summer 2010 TCRP Report 95: Traveler Response to Transportation System Changes: Ch. 13: Parking Pricing and Fees Ch. 15: Land Use and Site Design Ch. 17: Transit Oriented Design

14
Land Use Strategies and Elasticities Strategy Built Environment Variable Elasticity Concentration of Population and Households Population and/or Household Density-0.04 Diversity of Land UsesLand Use Mix Jobs/Housing Balance -0.09 -0.02 DesignIntersection/Street Density Percent 4-way Intersection -0.12 AccessibilityJob Accessibility by Automobile Job Accessibility by Transit -0.20 -0.05 TransitDistance to Nearest Transit Stop -0.05

15
Assessment Tool Implementation Currently implemented as an Excel ® spreadsheet – some elements password protected Long term implementation as application on Council website – facilitate maintenance of data from: Updates of travel forecast model Updates of air pollutant emission rates

16
Assessment Tool Implementation

17
Use of Assessment Tool Local development data “Build” scenario data – typically from development proposal “No-Build” scenario data – potential sources: Existing development “Typical” recent development Previous planned development

18
Assessment Tool Implementation

23
Conclusions: This is not a tool to estimate actual total emissions, just potential reductions between alternative land use scenarios. Requires “Base Case” and “Alternative Land Use/Design” scenarios to calculate change in independent variable. Can assist local decision makers in considering air quality impacts of land use decisions.

24
An AQ Assessment Tool for Local Land Use Decisio ns MnAPA Annual Conference September 28, 2011 St. Cloud, Minnesota Mark Filipi, AICP PTP mark.filipi@metc.state.mn.us 651-602-1725

Similar presentations


. Gravity model 3 1 2 4 5 Where do the trips produced in TAZ 3 go? ? ? ? ?>")


>")
, ch3.2-3.8 (C1) Get a general idea of urban planning theories (from rading p.333-342 (A)>")


: Pilot Test Results Prepared for 14 th TRB National Transportation Planning Applications Conference May 5-9,>")