Download presentation
Presentation is loading. Please wait.

1
Unit 7 Cities and Urban Land Use

2
BAV- Search “AP Human Geography Urbanization” to locate these terms using your device. Finish for HW if you don’t finish in class. annexation central business district central place theory gentrification ghetto greenbelts megacity megalopolis peripheral model MSA (metropolitan & micropolitan) primate city public housing redlining sector model slum smart growth sprawl Squatter suburb underclass urban decay urban renewal zone in transition zoning ordinance
 primate city public housing redlining sector model slum smart growth sprawl Squatter suburb underclass urban decay urban renewal zone in transition zoning ordinance")
3
Cities are everywhere

4
Physical City Is a continuous development that contains a central city, many nearby cities, towns and suburbs. Physical cities may be separated by less developed landscapes. But they may be part of a larger urban landscape.

5
Urban Geography Focuses on how cities function, their internal systems and structures, and the external influences on them. Two sub-fields of urban geography are: The study of systems of cities-where located, and why they are there. An external view of cities Current and historic distribution of cities Functions of cities Reasons for differential growth among cities. The study of internal cities Land use, racial and ethnic segregation, architectural styles, types of intracity transportation, cycles of construction and development. Makes use of quantitative data-census data Qualitative data-narrative accounts and field studies

6
Urbanization process by which cities grow. has 2 dimensions:
An increase in the # of ppl living in cities. An increase in the % of ppl living in cities.

7
What is an urban area? Nucleated-one or more clear core areas. People who live in them work in non-agricultural jobs. City and town describe nucleated settlements that perform multiple residential and non residential functions. Towns are smaller and less complex than cities but still have the nuclear business concentrations. Cities may be surrounded by suburbs-areas also nucleated, use much land space for residences of people who work in or near cities. Suburbs are separated from the central city by political boundaries.

8
Percent living in urban areas
Percent living in urban areas. More developed countries have higher % in urban areas. Figure: 13-01 Title: Percent living in urban areas. Caption: More developed countries have a higher percentage of people living in urban areas.

10
Urbanized area 70% of USA lives in urbanized areas
30% in central cities 40% surrounding jurisdictions

11
Cities with 3 million or more

12
Grading Rubric for Pass out of Class
70= Student Participated in Quick Write but does not demonstrate knowledge of the topic. 85= Student demonstrates limited knowledge on the topic. 100= Student is on the right track and demonstrates knowledge of the topic.

13
Metropolitan Statistical Area (MSA)
An MSA includes the following: 1. An urbanized area with a population of at least 50, The county within which the city is located. 3. Adjacent counties with a high population density and a large percentage of residents working in the central city’s county.

14
Micropolitan Statistical Area
Urbanized area between 10,000 and 50,000. The county in which it is found and adjacent counties tied to the city

15
Megalopolis

16
Megalopolis Adjacent MSA’s overlap.
A county between two central cities may send large number of commuters to jobs in each. Megalopolis-Greek word meaning “Great City” Bowash Corridor

17
Urban Hierarchy- from smallest to largest
Hamlet-cluster of farmer’s houses with a few basic services. Village-smallest urban settlement. Several dozen services more specialized than a hamlet. Town-has more specialized function. May have a bank, post office, hospital, schools. Towns have a hinterland-smaller villages or hamlets economically dependent on it. City-large population, functional specialization. Well defined central business district. Megalopolis-multiple cities that have grown together.

18
Social Characteristics of Urban Areas
Luis Wirth defined a city as a permanent settlement that has three characteristics that create living experiences for urban residents that are different from residents in rural areas. Large size High density Social heterogeneity

19
1. Large Size Residents can know only a small percentage of each other. Know persons through work, living arrangements and daily routines. Come into contact with many people but does not know them well. In contrast- People in rural areas know almost everyone that lives nearby Know a great deal about neighbors

20
2. High Density Highly specialized jobs, which allows a large number of people to live in one place. Each person plays a specific role or performs a specific task which allows the urban area to function smoothly. High density causes people to compete for space, causing social problems-one group dominates others. Higher prices for property and rent Further distinguishing between rich and poor.

21
3. Social heterogeneity People with diverse backgrounds
Anonymity, uncomfortable with all knowing neighbors. Attract persons with unusual occupations only available in urban areas. Sexual orientations unacceptable in rural areas. Cultural interests fed by museums, theaters. People tend to be lonely and isolated feeling those around them are indifferent and uncaring.

22
Systems of Cities Cities appear in response to human needs and activities. A cities geography is important in determining growth. A city may establish itself as a center of culture, arts, shipping, industry.

23
Origin and Evolution of Cities
It is hard to imagine the world without cities. Humans appeared 100,000 ago. No permanent settlements appeared for 90,000 years. The Neolithic(Agricultural) Revolution caused people to form permanent settlements. These settlements were small and simple. Southeast Asia 3,000 BCE changed things as large scale farming and irrigation caused agricultural societies to become more complex. Inequality of wealth caused some houses and landholdings to become larger than others. Specialization of jobs began and some stayed farmers while others became crafts people, priests and government officials. Government buildings appeared.
 Revolution caused people to form permanent settlements. These settlements were small and simple. Southeast Asia 3,000 BCE changed things as large scale farming and irrigation caused agricultural societies to become more complex. Inequality of wealth caused some houses and landholdings to become larger than others. Specialization of jobs began and some stayed farmers while others became crafts people, priests and government officials. Government buildings appeared.")
24
The Role of Government 4,000 to 2,000 BCE is called the Formative Era for both the development of states and urbanization. The more complex settlements grew, the need for central authority increased. States-organized territories under governments appeared. Tigris/Euphrates River(Mesopotamia) Indus River(South Asia) East Asian Rivers(China) Agean Sea(Greeks)
 Indus River(South Asia) East Asian Rivers(China) Agean Sea(Greeks)")
25
Function and Location of Ancient Cities
Organized focus of the state. Agriculture planned and controlled to generate a flow of food. Governments collected taxes, walls around cities to protect from outside invaders. Sites chosen near farmland, water, trade routes, defensibility. Less accessible, more isolated places were at a disadvantage. A group of urban elite controlled the resources and lives of others.

26
Function and Location of Ancient Cities
Functions of cities included: Centers of power-headquarters of early heads of state. Religious centers-priests, temples and shrines located in cities. Economic centers-markets for trade, wealthy merchants, land and livestock owners, traders operating and living in urban areas. Educational centers-city residents included teachers and philosophers to educate the urban elite.

27
City

28
Urbanization and Mediterranean
City-states-self-governing communities that included the nearby countryside. Greeks Athens-first city to reach 100,000 in population. Urban empire included large parts of the interior of Europe along with Mediterranean shores. Phoenicians-SW Africa Romans The cities were connected by a network of land and sea routes.

29
Urban Growth in China Huang River and its tributaries.
Han Dynasty as large as the Roman Empire.

30
Medieval, Preindustrial and Industrial World Cities

31
Medieval cities The largest settlements were centers of government, church and markets. Roads connected to hinterlands. Most cities were surrounded by walls. Streets were narrow and winding. Occupational groups were clustered together. Ethnicity defined communities and sought to keep out people who differed from themselves. “ghetto” first described the segregation of Jews in Venice.

32
Preindustrial Cities. Urban centers for culture.
Mark Jefferson named them: Primate Cities –larger in other cities in the area and representing national culture. Kyoto-old Japan Paris-French culture London-all that is English.

33
Preindustrial Cities Mercantile City-where trade became central to the city design. No matter where the city was located, it’s central square was fronted by government and religious buildings, housing for the rich. Streets leading to the square were arteries of commerce, lined with shops that specialized in products brought by the trade routes.

34
Industrial Revolution Cities

35
Industrial Revolution
Created the Manufacturing City Factories attracted workers from rural areas. In some countries tenements were constructed for worker housing. Broad, straight boulevards to accommodate the flow of commercial traffic, eventually cars. Developers divided cities into regular sized lots as land was a commodity to be bought and sold. Some cities retained their historic square, others lost organization. Problems of sanitation, overcrowding, pollution and dissaray.

36
Rural to Urban Migration and Urban Growth
¾ of people in developed countries live in cities. Urbanization in the USA 1800-5% urbanized % Migration urban to rural has increased in less developed countries in Asia, Africa and Latin America. By 2000, 32 of the 48 cities with populations over 5 million were in less developed nations. All countries have in common: The proportion of people living in cities is rising. Cities themselves are large and growing.

37
World’s 26 Largest Cities
1. Tokyo-Yokohama, Japan - 33,200, New York, United States - 17,800, Sao Paulo, Brazil - 17,700, Seoul-Incheon, South Korea - 17,500, Mexico City, Mexico - 17,400, Osaka-Kobe-Kyoto, Japan - 16,425, Manila, Philippines - 14,750, Mumbai, India (formerly Bombay) - 14,350, Jakarta, Indonesia - 14,250, Lagos, Nigeria - 13,400, Kolkata, India (formerly Calcutta) - 12,700, Delhi, India - 12,300, Cairo, Egypt - 12,200,000 14. Los Angeles, United States - 11,789, Buenos Aires, Argentina - 11,200, Rio de Janeiro, Brazil - 10,800, Moscow, Russia - 10,500, Shanghai, China - 10,000, Karachi, Pakistan - 9,800, Paris, France - 9,645, Nagoya, Japan - 9,000,000 (tie) 21. Istanbul, Turkey - 9,000,000 (tie) 23. Beijing, China - 8,614, Chicago, United States - 8,308, London, United Kingdom - 8,278, Shenzhen, China - 8,000,000
 - 14,350, Jakarta, Indonesia - 14,250, Lagos, Nigeria - 13,400, Kolkata, India (formerly Calcutta) - 12,700, Delhi, India - 12,300, Cairo, Egypt - 12,200, Los Angeles, United States - 11,789, Buenos Aires, Argentina - 11,200, Rio de Janeiro, Brazil - 10,800, Moscow, Russia - 10,500, Shanghai, China - 10,000, Karachi, Pakistan - 9,800, Paris, France - 9,645, Nagoya, Japan - 9,000,000 (tie) 21. Istanbul, Turkey - 9,000,000 (tie) 23. Beijing, China - 8,614, Chicago, United States - 8,308, London, United Kingdom - 8,278, Shenzhen, China - 8,000,000.")
39
World Cities and Megacities
In the place of great manufacturing cities are modern world cities that have become centers of business, consumer and public sectors.

40
Tiers of cities First tier-London, NYC, Tokyo Second tier-Chicago, LA, Washington, DC. ,Brussels, Frankfurt, Paris, Zurich, Sao Paulo, Singapore. Third Tier-Bangkok, Bombay, Hong Kong, Manila, Osaka, Seoul, Taipei, Buenos Aires, Caracas, Mexico City, Rio de Janeiro, Johannesburg.

41
Tiers of Cities. These tiers are based on centrality of these services to the city: Business, consumer and public services. Business-corporate offices and support staff, financial services of banks, insurance companies. Stock exchanges, convergence of transportation networks. Consumer-more wealthy live in cities. Entertainment and cultural offerings. Public-national or international seats of power. NYC-United Nations, Brussels-EU headquarters.

42
Megacities Coined by the United Nations in the 1970’s for cities over 10 million. House new arrivals in overpopulated apartment buildings, tenements or slums. Shantytowns have grown up around many. Lack of zoning allows the very wealthy to live next to the very poor.

43
Functions of Cities Urban centers are functionally connected to other cities and to rural areas. Transportation centers-major routes converge. Special function cities-engaged in manufacturing, mining, or recreation. Central places-provide goods and services for the surrounding areas. Cities carry out activities that are necessary simply to support itself.

44
The economic base of cities
Export activities-produce goods and services for outside the city. They are the basic sector of the city’s economy. Non-basic or service sector- produce goods or services for the residents of he city itself. Base ratio-ration between workers employed in basic and non basic sector. The larger the city the larger the ratio of non-basic workers. Multiplier effect-new basic sector employment is accompanied by a larger share of non-basic workers. Decreasing the ratio of basic to non-basic workers.

45
Economic base

46
CBD-Downtown Retail High cost of land Excluded activities
High end shops Retail services such as malls, grocery stores Business services High cost of land Tokyo-$500 million/sq acre Intensive land use skyscrapers Excluded activities Declining manufacturing Lack of residents

47
Charleston

48
1943-Chauncy Harris Father of modern Geography
Classified cities in the USA into three types according to function. Manufacturing dominated cities in the Northeast. Retail centers scattered across the country. Diversified cities with multiple functions.

49
Urban Influence Zones Areas outside the city that are affected by it.
How big an area, depends on the city. The urban hierarchy is at work.

50
John Borchert (1967)- Stages in the Evolution of a City
Sail-Wagon Epoch ( )-trade took ships across the ocean or along shorelines, wagons overland. Technologies determined job opportunities of people that came to work in cities. Iron-Horse Epoch ( )-railroad technology changed the nature of trade and employment. Street-Rail Epoch( )-the steel industry transformed urban America and job opportunities of workers. Auto-Air-Amenity Epoch (1920’s-1960’s)-internal combustion engine came to dominate life styles, employment opportunities and the economic base of cities.
-trade took ships across the ocean or along shorelines, wagons overland. Technologies determined job opportunities of people that came to work in cities. Iron-Horse Epoch ( )-railroad technology changed the nature of trade and employment. Street-Rail Epoch( )-the steel industry transformed urban America and job opportunities of workers. Auto-Air-Amenity Epoch (1920’s-1960’s)-internal combustion engine came to dominate life styles, employment opportunities and the economic base of cities.")
51
Models of Urban Systems
Two theories of settlement geography or patterns of settlement on the earth’s surface. Rank-size rule. Christaller’s Central Place Theory

52
Rank Size Rule Rank size ordering describes patterns of urban sizes in complex economies where urbanization is well established. Tells us that the nth largest city will be 1/n the size of the larges city. Example the 2nd largest city will be ½ the size of the first largest city. In some countries the primate city so dominates that no other cities fit the rank size order.

53
Central Place Theory Views urban settlements as centers for distribution of economic goods and services to the surrounding nonurban populations. Walter Christaller Germany in 1933.

54
Central Place Theory Several Assumptions: No topographic barriers
No difference in farm productivity An evenly dispersed farm population People with similar lifestyles and incomes. Differing thresholds, or minimum number of consumers necessary to support different products(lower threshold for inexpensive items, higher threshold for expensive items.) 1) threshold -- the minimum market needed to bring a firm or city selling goods and services into existence and to keep it in business 2) range -- the average maximum distance people will travel to purchase goods and services Purchase of goods and services at the nearest center.
 1) threshold -- the minimum market needed to bring a firm or city selling goods and services into existence and to keep it in business. 2) range -- the average maximum distance people will travel to purchase goods and services. Purchase of goods and services at the nearest center.")
55
Basis of the theory

56
Central Place Theory The landscape is divided into non-competing market areas. Each individual urban center and its merchants has a sales monopoly. The market areas for a series of hexagons, with no area un- serviced and no area with equal service from two centers. The central place is the center of he hexagon, it will supply all the goods and services to consumers in the area. The size of the market area of a central place is based on the number of goods and services offered. Within each hexagon, or around its edges, lie smaller hexagons with central places that serve smaller areas. This creates a hierarchy of hexagons or central places providing lower order services.

57
Two conclusions Towns of the same size are evenly spaced apart because they are the center of the like-sized market areas. Larger towns will be farther apart than smaller towns because their market area is larger. Towns are part of an interdependent system. If a central place is eliminated, the entire system readjusts altering the spatial pattern.

60
Conclusions The conclusions apply widely to differing areas of the world. They describe agricultural areas particularly well. Where cities are multi-functional, the model is less applicable. But still can accurately describe special- function as well as transportation based cities.

61
Internal Cities Geographers analyze the internal land spaces of cities and the various uses that it serves. Cities are often arranged in similar ways, allowing geographers to develop models of urban land use. The models are influenced by: Accessibility High cost of accessible space Transportation Societal and cultural needs.

62
Internal cities Accessibility High cost of accessible space
Functions of cities be fulfilled in spaces accessible to its inhabitants. Ex. High density housing within walking distance of workers during the Industrial Revolution. High cost of accessible space The cost of land ↑ as available land↓ Mass transportation allowed the amount of useable space to grow. Population density pushes the cost of land and other commodities higher.

63
Internal Cities Transportation Societal and cultural needs.
Lines of transportation determine the growth of a city. Land with highest accessibility is the most desirable and generally the most expensive. Societal and cultural needs. Economic competition determines land use. Some highly desirable land is usually set aside for parks, schools, libraries. Look at Central Park in NYC

64
Models of Urban Land Use
Three different models developed to explain land use within cities. The 3 models were all developed in Chicago, with flat land and only Lake Michigan to disrupt the landscape. The three models: Concentric Zone Sector Multiple Nuclei Models

65
Concentric Zone Model Created in 1923 Sociologist EW Burgess
It views cities growing outward from a central area in a series of concentric rings.

66
Concentric Zones

67
Concentric Zones Zone 1-CBD, nonresident activities, property costs↑.
Zone 2-Zone in transition, light industry, housing for poor, services in transition between CBD and residential areas in outer zones. Housing formerly occupied by the wealthy, who have moved farther out. Industry in Zone 2 are too large to fit into Zone 1, owners seeking cheaper land. Zone 3-working class homes, modest older homes on smaller lots. Housing is less expensive than outer rings.

68
Concentric Zones Zone 4-homes are larger and more expensive. Middle class single family homes or high rent apartments. These persons choose location and afford high cost of transportation to the CBD. Zone 5-commuter zone, farthest from CBD. Beyond continuous built up area. People live in small villages where they spend leisure and sleep hours and commute to the CBD.

69
Indianapolis concentric

72
Concentric Zone Burgesses model is dynamic.
Invasion and succession explains the changes to the model. Poorer inhabitants drive wealthy farther out from the center of the city.

73
Sector Model Homer Hoyt 1939 Land Economist

74
Sector Model Cities develop in a series of sectors.
Sectors develop by environmental factors or by chance. As cities grow, activities expand outward like a wedge. Once an area is established for industry, other industry will cluster around it. Wealthy areas attract wealthy. Middle class live next to wealthy.

75
Sector Model

76
Multiple Nuclei Model C. D. Harris and E. L. Ullman Developed in 1945

77
Multiple Nuclei Model Harris and Ullman
Explains that large cities develop by spreading from several nodes of growth, not just one. Individual nodes have special functions This model explains that incompatible land use activities do not cluster in the same location. Nodes influence the type of development that occurs around them. This model explains then clusters come into contact, incompatible land uses will develop along juncture lines.

78
Multiple Nuclei Model

79
Summary All 3 models help explain not only land use, but the different social characteristics of people living in areas of a city. These models may be used along with census information. Census tracts-division of urban land areas in the USA. Approximately 5,000 people Correspond to neighborhood boundaries.

80
Peripheral Model North American Cities follow this model.
Created by Chauncy Harris-created the multiple nuclei model. Strong desire for suburban living Families with children Amenities More space, play and protection than city

81
Peripheral Model

82
Chicago

83
Cleveland Density gradient- Density change in an Urban area.
Sprawl-progressive Spread of Development over the Landscape.

84
Urban Sprawl Progressive spread of development over the landscape.
Greenbelts-rings of open space can fight urban development. London is an example.

85
Development

86
Zoning Ordinances Encourage spatial segregation.
Prevents mixed land uses within the same district. This is a form of suburban segregation. Vertical segregation is replaced by territorial segregation. Legally requirements such as lot size, prohibition of apartments, prevent many low income families from living in the suburbs.

87
Planning for growth Urban redevelopment Smart growth
Revitalization of downtown areas Gentrification-middle class people drawn to renovated areas. Expensive condos replacing low income housing. Poor even further displaced. New public housing with less population density. Smart growth Produce a pattern of controlled development. Protect rural lands for agriculture, wildlife and recreation Urban growth areas designated by the local governments.

88
Patterns of class, age, gender, race and ethnicity
Social Area Analysis-puts together information from census tracts to create an overall picture of how various types of people are distributed within a broader area, like a city. Social groups influenced by the size and value of available housing.

89
Patterns of class, age, gender, race and ethnicity
Social class Low number of people per room=high social class Age/marital status Younger families live farther from CBD Gender Increasing number of 1 parent families-78% of one parent families are headed by women. Feminization of poverty-increasing proportion of the poor who are women. Rely heavily on public transportation and live closer to or in CBD’s.

90
Patterns of class, age, gender, race and ethnicity
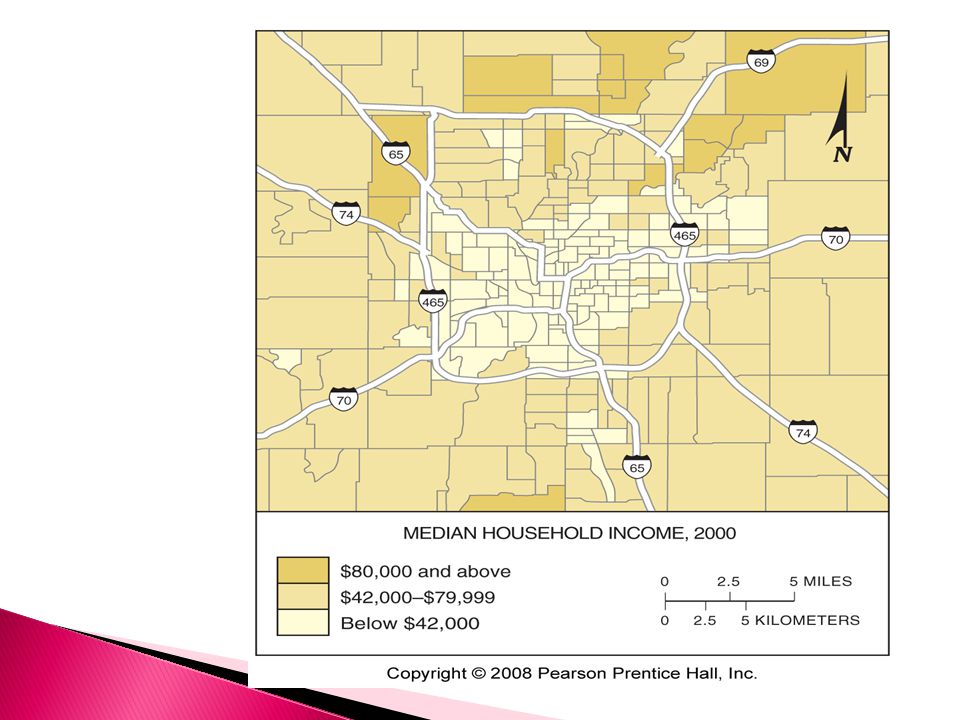
Tendency for ethnic and racial groups to cluster together. Many black Americans and Latinos live in undesirable neighborhoods “ghettos” with dilapidated housing, high crime rates and inadequate schools. Social and economic barriers to move are high Redlining-It describes the practice of marking a red line on a map to delineate the area where banks would not invest; later the term was applied to discrimination against a particular group of people (usually by race or sex) no matter the geography.
 no matter the geography.")
93
Ghettoization Forced segregation limits residential choices, ethnic or racial minorities may be confined to older, low-cost housing areas typically close to the city center. Patterns of ghettoization have differed by region

94
Ghettoization Early South-alleys and back streets, nearby white communities where jobs were. Classic south-newly freed black slaves, poor quality houses on undesirable land. Spatial and social segregation from white neighborhoods. Early northern-in cities competed with other groups for living space. High density housing on the margins of the CBD. Classic northern-low rent housing surrounding CBD. Overcrowding leads to crime.

96
Transportation and Infrastructure
Cities and Urban Land Used

97
Infrastructure Refers to all the facilities that support basic economic activities to such a degree that a city cannot function without them. Transportation impacts the demographic layout and function including: Motor vehicles About ¼ of city land allocated to roads and parking lots. Public transportation Busses, rail, subway

98
Public Transportation

99
Comparative Urbanization
How do worldwide cities compare to American cities?

100
Comparative Urbanization
European Cities Wealthy live close to town Small yards if any, parks are popular Wealthy have weekend homes. European suburbs are centers for crime, violence, drug dealing. Suburb residents are often immigrants from Africa or Asia who face discrimination or prejudice in larger society.

101
Comparative Urbanization
Latin American Cities Faster growth today CBD main focus of business, employment and entertainment. Socioeconomic levels and housing decrease in quality as distance from the center city increases. Disamenity sector is a relatively stable slum area that radiates from the central market to the outermost zone of periphery squatter settlements that consist of high density shantytowns.

102
Layout of Latin American City

103
Squatter settlement it is considered as a residential area in an urban locality inhabited by the very poor who have no access to tenured land of their own, and hence "squat" on vacant land, either private or public.

104
Squatter Settlement

105
Comparative Urbanization
Asian Cities Founded and developed by Europeans, follow European model of spatial arrangement. Asia’s urban growth is explosive African Cities Northern Africa-Islamic influence, mosque in the center, marketplace or bazaar. Southern Africa-Western due to colonization by Europe.

106
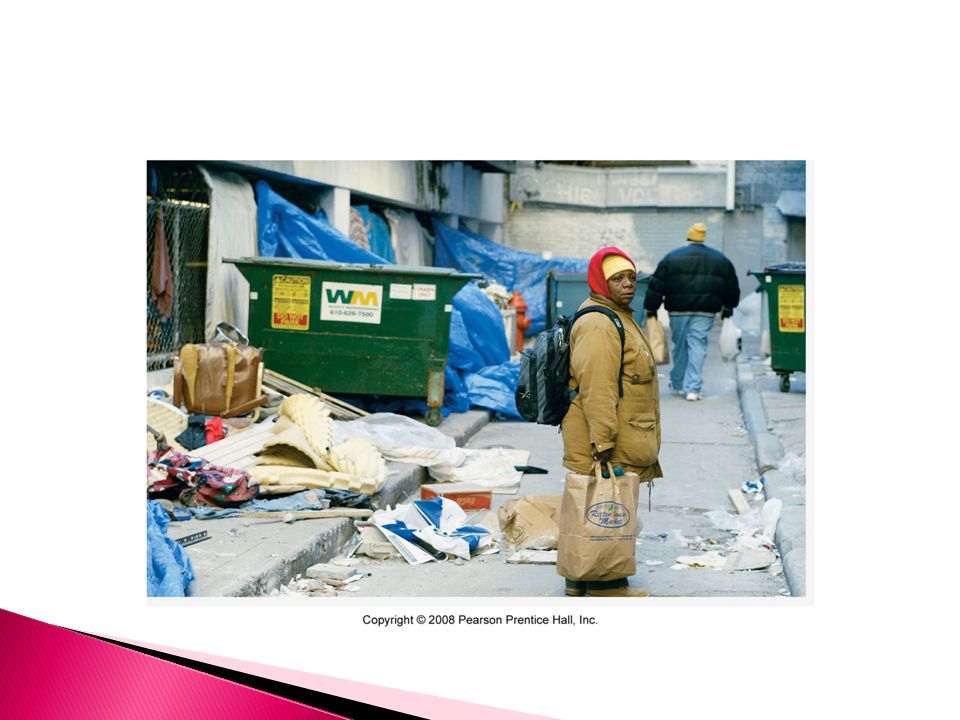
Inner city Social Problems
Underclass-inner city residents who are trapped in an unending cycle of economic and social problems. Lack of job skills Homeless Poverty Crime Racial Segregation Annexation –legally adding land to the city

107
Bid Rent theory How the price and demand for real estate changes as the distance from the Central Business District (CBD) increases. It states that different land users will compete with one another for land close to the city centre.
 increases. It states that different land users will compete with one another for land close to the city centre.")
Similar presentations