Download presentation
Presentation is loading. Please wait.

1
MedGen 505 Gene Regulation Bioinformatics Wyeth W. Wasserman www.cisreg.ca

2
CMMT Overview TFBS Prediction with Motif Models Improving Specificity of Predictions Analysis of Sets of Co-Expressed and Co- Regulated Genes

3
CMMT Transcription Factor Binding Sites (over-simplified for pedagogical purposes) TATAURE URFPol-II
 TATAURE URFPol-II")
4
Teaching a computer to find TFBS…

5
CMMT Laboratory Discovery of TFBS LUCIFERASE ACTIVITY

6
Representing Binding Sites for a TF A set of sites represented as a consensus VDRTWRWWSHD (IUPAC degenerate DNA) A 14 16 4 0 1 19 20 1 4 13 4 4 13 12 3 C 3 0 0 0 0 0 0 0 7 3 1 0 3 1 12 G 4 3 17 0 0 2 0 0 9 1 3 0 5 2 2 T 0 2 0 21 20 0 1 20 1 4 13 17 0 6 4 A matrix describing a a set of sites A single site AAGTTAATGA Set of binding sites AAGTTAATGA CAGTTAATAA GAGTTAAACA CAGTTAATTA GAGTTAATAA CAGTTATTCA GAGTTAATAA CAGTTAATCA AGATTAAAGA AAGTTAACGA AGGTTAACGA ATGTTGATGA AAGTTAATGA AAGTTAACGA AAATTAATGA GAGTTAATGA AAGTTAATCA AAGTTGATGA AAATTAATGA ATGTTAATGA AAGTAAATGA AAGTTAATGA AAATTAATGA AAGTTAATGA Set of binding sites AAGTTAATGA CAGTTAATAA GAGTTAAACA CAGTTAATTA GAGTTAATAA CAGTTATTCA GAGTTAATAA CAGTTAATCA AGATTAAAGA AAGTTAACGA AGGTTAACGA ATGTTGATGA AAGTTAATGA AAGTTAACGA AAATTAATGA GAGTTAATGA AAGTTAATCA AAGTTGATGA AAATTAATGA ATGTTAATGA AAGTAAATGA AAGTTAATGA AAATTAATGA AAGTTAATGA
 A C G T A matrix describing a a set of sites A single site AAGTTAATGA Set of binding sites AAGTTAATGA CAGTTAATAA GAGTTAAACA CAGTTAATTA GAGTTAATAA CAGTTATTCA GAGTTAATAA CAGTTAATCA AGATTAAAGA AAGTTAACGA AGGTTAACGA ATGTTGATGA AAGTTAATGA AAGTTAACGA AAATTAATGA GAGTTAATGA AAGTTAATCA AAGTTGATGA AAATTAATGA ATGTTAATGA AAGTAAATGA AAGTTAATGA AAATTAATGA AAGTTAATGA Set of binding sites AAGTTAATGA CAGTTAATAA GAGTTAAACA CAGTTAATTA GAGTTAATAA CAGTTATTCA GAGTTAATAA CAGTTAATCA AGATTAAAGA AAGTTAACGA AGGTTAACGA ATGTTGATGA AAGTTAATGA AAGTTAACGA AAATTAATGA GAGTTAATGA AAGTTAATCA AAGTTGATGA AAATTAATGA ATGTTAATGA AAGTAAATGA AAGTTAATGA AAATTAATGA AAGTTAATGA")
7
CMMT TGCTG = 0.9 PFMs to PWMs Add the following features to the model: 1. Correcting for the base frequencies in DNA 2. Weighting for the confidence (depth) in the pattern 3. Convert to log-scale probability for easy arithmetic A 5 0 1 0 0 C 0 2 2 4 0 G 0 3 1 0 4 T 0 0 1 1 1 A 1.6 -1.7 -0.2 -1.7 -1.7 C -1.7 0.5 0.5 1.3 -1.7 G -1.7 1.0 -0.2 -1.7 1.3 T -1.7 -1.7 -0.2 -0.2 -0.2 f matrix w matrix Log ( ) f(b,i) + s(n) p(b)
 in the pattern 3. Convert to log-scale probability for easy arithmetic A C G T A C G T f matrix w matrix Log ( ) f(b,i) + s(n) p(b).")
8
CMMT Performance of Profiles 95% of predicted sites bound in vitro (Tronche 1997) MyoD binding sites predicted about once every 600 bp (Fickett 1995) The Futility Conjuncture –Nearly 100% of predicted transcription factor binding sites have no function in vivo
 MyoD binding sites predicted about once every 600 bp (Fickett 1995) The Futility Conjuncture –Nearly 100% of predicted transcription factor binding sites have no function in vivo")
9
CMMT JASPAR AN OPEN-ACCESS DATABASE OF TF BINDING PROFILES

10
PROBLEM: Too many spurious predictions Actin, alpha cardiac

11
CMMT Terms Specificity – The portion of predictions that are correct Sensitivity – The portion of “positives” that are detected The detection of TFBS is limited by terrible specificity. Why? I.9

12
CMMT Method#1 Phylogenetic Footprinting 70,000,000 years of evolution reveals most regulatory regions

13
CMMT Phylogenetic Footprinting FoxC2 100% 80% 60% 40% 20% 0%

14
CMMT Phylogenetic Footprinting to Identify Functional Segments % Identity Actin gene compared between human and mouse with DPB. 200 bp Window Start Position (human sequence)
.")
15
CMMT Phylogenetic Footprinting Dramatically Reduces Spurious Hits Human Mouse Actin, alpha cardiac

16
CMMT Performance: Human vs. Mouse Testing set: 40 experimentally defined sites in 15 well studied genes (Replicated with 100+ site set) 75-90% of defined sites detected with conservation filter, while only 11-16% of total predictions retained SELECTIVITYSENSITIVITY
 75-90% of defined sites detected with conservation filter, while only 11-16% of total predictions retained SELECTIVITYSENSITIVITY.")
17
CMMT ConSite (www.cisreg.ca) NEW: Ortholog Sequence Retrieval Service

18
CMMT Emerging Issues Multiple sequence comparisons –Incorporate phylogenetic trees –Visualization Analysis of closely related species –Phylogenetic shadowing Genome rearrangements –Inversion compatible alignment algorithm Higher order models of TFBS

19
CMMT OnLine Resources for Phylogenetic Footprinting Linked to TFBS –ConSite –rVISTA Alignments –Blastz –Lagan –Avid –ORCA I.18 Visualization –Sockeye –Vista Browser –PipMaker

20
CMMT Method#2 Discrimination of Regulatory Modules TFs do NOT act in isolation

21
Layers of Complexity in Metazoan Transcription

22
CMMT Diverse and non-uniform use of terms: Partial glossary for tutorial Promoter – Sufficient to support the initiation of transcription; orientation dependent; includes TSS Regulatory Regions –Proximal – adjacent to promoter –Distal – some distance away from promoter (vague) –May be positive (enhancing) or negative (repressing) TSS – transcription start site TFBS – single transcription factor binding site Modules – Sets of TFBS that function together EXON TFBSTATA TSS TFBS Promoter Region TFBS Distal Regulatory RegionProximal Regulatory Region EXON TFBS Distal R.R.
 –May be positive (enhancing) or negative (repressing) TSS – transcription start site TFBS – single transcription factor binding site Modules – Sets of TFBS that function together EXON TFBSTATA TSS TFBS Promoter Region TFBS Distal Regulatory RegionProximal Regulatory Region EXON TFBS Distal R.R.")
23
CMMT Detecting Clusters of TF Binding Sites Trained Methods –Sufficient examples of real clusters to establish weights on the relative importance of each TF Statistical Over-Representation of Combinations –Binding profiles available for a set of biologically motivated TFs

24
CMMT Training for the detection of liver cis-regulatory modules (CRMs)
")
25
CMMT Models for Liver TFs… HNF1 C/EBP HNF3 HNF4

26
CMMT Logistic Regression Analysis “logit” Optimize vector to maximize the distance between output values for positive and negative training data. Output value is: e logit p(x)= 1 + e logit
= 1 + e logit.")
27
CMMT Performance of the Liver Model Performance –Sensitivity: 60% of known CRMs detected –Specificity: 1 prediction/35,000bp Limitations –Applies to genes expressed late in hepatocyte differentiation –Requires 10-15 genes in positive training set –This model doesn’t account for multiple sites for the same TF New methods from several groups address this limit

28
CMMT UGT1A1 Wildtype Other Liver Module Model Score “Window” Position in Sequence

29
CMMT Making better predictions Profiles make far too many false predictions to have predictive value in isolation Phylogenetic footprinting eliminates ~90% of false predictions Algorithms for detection of clusters of binding sites perform better, especially when possible to create train on known examples for the target context

30
CMMT Method#3 Higher Order Models Position-position dependence

31
What is a higher-order background model? Zero-order: p(A)=0.29, p(C)=0.21, p(G)=0.21, p(T)=0.29 First-order: A A T C G A m:th-order: The chance of drawing base x is dependant on the identity of the previous m bases Probabilistic Methods for Pattern Discovery(7)
=0.29, p(C)=0.21, p(G)=0.21, p(T)=0.29 First-order: A A T C G A m:th-order: The chance of drawing base x is dependant on the identity of the previous m bases Probabilistic Methods for Pattern Discovery(7).")
32
CMMT Linking co-expressed genes to candidate transcription factors

33
CMMT Deciphering Regulation of Co- Expressed Genes

34
CMMT oPOSSUM Procedure Set of co- expressed genes Automated sequence retrieval from EnsEMBL Phylogenetic Footprinting Detection of transcription factor binding sites Statistical significance of binding sites Putative mediating transcription factors ORCA

35
CMMT Statistical Methods for Identifying Over- represented TFBS Z scores –Based on the number of occurrences of the TFBS relative to background –Normalized for sequence length –Simple binomial distribution model Fisher exact probability scores –Based on the number of genes containing the TFBS relative to background –Hypergeometric probability distribution

36
CMMT The oPOSSUM Database Orthologous genes: 8468 Promoter pairs: 6911 Promoters with TFBS: 6758 Total # of TFBS predictions: 1638293 Overall failure rate: 20.2%

37
CMMT Validation using Reference Gene Sets TFs with experimentally-verified sites in the reference sets. A. Muscle-specific (23 input; 16 analyzed) B. Liver-specific (20 input; 12 analyzed) RankZ-scoreFisherRankZ-scoreFisher SRF121.411.18e-02HNF-1138.21 8.83e-08 MEF2218.128.05e-04HLF211.00 9.50e-03 c-MYB_1314.411.25e-03Sox-539.822 1.22e-01 Myf413.543.83e-03FREAC-447.101 1.60e-01 TEF-1511.222.87e-03HNF-3beta54.494 4.66e-02 deltaEF1610.881.09e-02SOX1764.229 4.20e-01 S875.8742.93e-01 Yin-Yang74.0701.16e-01 Irf-185.2452.63e-01S883.821 1.61e-02 Thing1-E4794.4854.97e-02 Irf-193.4771.69e-01 HNF-1103.3532.93e-01 COUP-TF103.2862.97e-01
 B. Liver-specific (20 input; 12 analyzed) RankZ-scoreFisherRankZ-scoreFisher SRF e-02HNF e-08 MEF e-04HLF e-03 c-MYB_ e-03Sox e-01 Myf e-03FREAC e-01 TEF e-03HNF-3beta e-02 deltaEF e-02SOX e-01 S e-01 Yin-Yang e-01 Irf e-01S e-02 Thing1-E e-02 Irf e-01 HNF e-01 COUP-TF e-01.")
38
Application to Microarray Data Sets 1.NF-кB inhibition microarray study

39
Genes Significantly Down-regulated by the NF-κB inhibitor (326 input; 179 analyzed) TF ClassRankZ-scoreFisherNo. Genes p65REL136.575.66e-1262 NF-kappaBREL232.585.82e-1161 c-RELREL326.028.59e-0863 Irf-2TRP-CLUSTER420.395.74e-046 SPI-BETS516.591.23e-03135 Irf-1TRP-CLUSTER615.49.55e-0423 Sox-5HMG715.382.56e-02126 p50REL814.722.23e-0319 NkxHOMEO913.662.29e-03111 BsapPAIRED1013.2 9.92e-021 FREAC-4FORKHEAD1112.051.66e-0392 n-MYCbHLH-ZIP256.6951.84e-03102 ARNTbHLH266.6951.84e-03102 HNF-3betaFORKHEAD295.9483.32e-0347 SOX17HMG315.4068.60e-0379

40
CMMT C-Myc SAGE Data c-Myc transcription factor dimerizes with the Max protein Key regulator of cell proliferation, differentiation and apoptosis Menssen and Hermeking identified 216 different SAGE tags corresponding to unique mRNAs that were induced after adenoviral expression of c-Myc in HUVEC cells They then went on to confirm the induction of 53 genes using microarray analysis and RT-PCR

41
CMMT Induced Genes after Ectopic Expression of c-Myc (SAGE) (53 input; 36 analyzed) TF ClassRankZ-scoreFisherNo. Genes Myc-MaxbHLH-ZIP121.685.35e-037 StafZN-FINGER, C2H2220.171.70e-022 MaxbHLH-ZIP318.322.16e-0212 SAP-1ETS413.231.61e-0413 USFbHLH-ZIP511.90 1.84e-0116 SP1ZN-FINGER, C2H2611.684.40e-0212 n-MYCbHLH-ZIP711.11 1.55e-0120 ARNTbHLH811.11 1.55e-0120 Elk-1ETS910.923.88e-0319 Ahr-ARNTbHLH1010.17 1.11e-0125

42
CMMT C-Fos Microarray Experiment In a study examining the role of transcriptional repression in oncogenesis, Ordway et al. compared the gene expression profiles of fibroblasts transformed by c-fos to the parental 208F rat fibroblast cell line We mapped the list of 252 induced Affymetrix Rat Genome U34A GeneChip sequences to 136 human orthologs

43
Induced Genes after Ectopic Expression of c-Fos (Affymetrix) (136 input; 86 analyzed) TF ClassRankZ-scoreFisherNo. Genes c-FOSbZIP117.532.60e-0545 RREB-1ZN-FINGER, C2H228.8991.41e-011 PPARgamma-RXRalNUCLEAR RECEPTOR33.9912.98e-011 CREBbZIP43.6261.25e-0110 E2FUnknown52.9657.67e-0215 NF-kappaBREL62.9151.04e-0117 SRFMADS72.7072.24e-012 MEF2MADS82.6341.32e-0113 c-RELREL92.4675.79e-0222 StafZN-FINGER, C2H2102.3853.74e-011 Ahr-ARNTbHLH151.7162.57e-0363 deltaEF1ZN-FINGER, C2H2230.2715.39e-0375 Elk-1ETS210.78758.12e-0337 MZF_1-4ZN-FINGER, C2H227-0.24215.41e-0373 n-MYCbHLH-ZIP30-0.87388.20e-0351 ARNTbHLH31-0.87388.20e-0351

44
CMMT oPOSSUM Server

45
CMMT http://www.cisreg.ca/cgi- bin/oPOSSUM/opossum INPUT A LIST OF CO-EXPRESSED GENES

46
CMMT SELECT YOUR TFBS PROFILES

47
CMMT SELECT: 1.CONSERVATION 2.PSSM MATCH THRESHOLD 3.PROMOTER REGION 4.STATISTICAL MEASURE

48
CMMT de novo Discovery of TF Binding Sites

49
CMMT Pattern Discovery

50
CMMT de novo Pattern Discovery Exhaustive –e.g. YMF (Sinha & Tompa) –Generalization: Identify over-represented oligomers in comparison of “+” and “-” (or complete) promoter collections Monte Carlo/Gibbs Sampling –e.g. AnnSpec (Workman & Stormo) –Generalization: Identify strong patterns in “+” promoter collection vs. background model of expected sequence characteristics
 –Generalization: Identify over-represented oligomers in comparison of + and - (or complete) promoter collections Monte Carlo/Gibbs Sampling –e.g. AnnSpec (Workman & Stormo) –Generalization: Identify strong patterns in + promoter collection vs. background model of expected sequence characteristics.")
51
Exhaustive methods Word based methods: How likely are X words in a set of sequences, given sequence characteristics? CCCGCCGGAATGAAATCTGATTGACATTTTCC>EP71002 (+) Ce[IV] msp-56 B; range -100 to -75 TTCAAATTTTAACGCCGGAATAATCTCCTATT >EP63009 (+) Ce Cuticle Col-12; range -100 to -75 TCGCTGTAACCGGAATATTTAGTCAGTTTTTG >EP63010 (+) Ce Cuticle Col-13; range -100 to -75 TATCGTCATTCTCCGCCTCTTTTCTT >EP11013 (+) Ce vitellogenin 2; range -100 to -75 GCTTATCAATGCGCCCGGAATAAAACGCTATA >EP11014 (+) Ce vitellogenin 5; range -100 to -75 CATTGACTTTATCGAATAAATCTGTT >EP11015 (-) Ce vitellogenin 4; range -100 to -75 ATCTATTTACAATGATAAAACTTCAA >EP11016 (+) Ce vitellogenin 6; range -100 to -75 ATGGTCTCTACCGGAAAGCTACTTTCAGAATT >EP11017 (+) Ce calmodulin cal-2; range -100 to -75 TTTCAAATCCGGAATTTCCACCCGGAATTACT >EP63007 (-) Ce cAMP-dep. PKR P1+; range -100 to -75 TTTCCTTCTTCCCGGAATCCACTTTTTCTTCC >EP63008 (+) Ce cAMP-dep. PKR P2; range -100 to -75 ACTGAACTTGTCTTCAAATTTCAACACCGGAA >EP17012 (+) Ce hsp 16K-1 A; range -100 to -75 TCAATGCCGGAATTCTGAATGTGAGTCGCCCT >EP55011 (-) Ce hsp 16K-1 B; range
 Ce[IV] msp-56 B; range -100 to -75 TTCAAATTTTAACGCCGGAATAATCTCCTATT >EP63009 (+) Ce Cuticle Col-12; range -100 to -75 TCGCTGTAACCGGAATATTTAGTCAGTTTTTG >EP63010 (+) Ce Cuticle Col-13; range -100 to -75 TATCGTCATTCTCCGCCTCTTTTCTT >EP11013 (+) Ce vitellogenin 2; range -100 to -75 GCTTATCAATGCGCCCGGAATAAAACGCTATA >EP11014 (+) Ce vitellogenin 5; range -100 to -75 CATTGACTTTATCGAATAAATCTGTT >EP11015 (-) Ce vitellogenin 4; range -100 to -75 ATCTATTTACAATGATAAAACTTCAA >EP11016 (+) Ce vitellogenin 6; range -100 to -75 ATGGTCTCTACCGGAAAGCTACTTTCAGAATT >EP11017 (+) Ce calmodulin cal-2; range -100 to -75 TTTCAAATCCGGAATTTCCACCCGGAATTACT >EP63007 (-) Ce cAMP-dep. PKR P1+; range -100 to -75 TTTCCTTCTTCCCGGAATCCACTTTTTCTTCC >EP63008 (+) Ce cAMP-dep. PKR P2; range -100 to -75 ACTGAACTTGTCTTCAAATTTCAACACCGGAA >EP17012 (+) Ce hsp 16K-1 A; range -100 to -75 TCAATGCCGGAATTCTGAATGTGAGTCGCCCT >EP55011 (-) Ce hsp 16K-1 B; range.")
52
CMMT Over-representation How many words of type ’AGGAGTGA’ are found in our sequences? How likely is this result? Exhaustive methods

53
CMMT Exhaustive methods Find all words of length 7 in the yeast genome Make a lookup table: AAACCTTT456 TTTTTTTT57788 GATAGGCA589 Etc... GTCTTTATCTTCAAAGTTGTCTGTCCAAGATTTGGACTTGAAGG ACAAGCGTGTCTTCTCAGAGTTGACTTCAACGTCCCATTGGAC GGTAAGAAGATCACTTCTAACCAAAGAATTGTTGCTGCTTTGC CAACCATCAAGTACGTTTTGGAACACCACCCAAGATACGTTGT CTTGTTCTCACTTGGGTAGACCAAACGGTGAAAGAAACGAAAA ATACTCTTTGGCTCCAGTTGCTAAGGAATTGCAATCATTGTTG GGTAAGGATGTCACCTTCTTGAACGACTGTGTCGGTCCAGAA GTTGAAGCCGCTGTCAAGGCTTCTGCCCCAGGTTCCGTTATTT TGTTGGAAAACTGCGTTACCACATCGAAGAAGAAGGTTCCAGA AAGGTCGATGGTCAAAAGGTCAAGGCTCAAGGAAGATGTTCA AAAGTTCAGACACGAATTGAGCTCTTTGGCTGATGTTTACATC ACGATGCCTTCGGTACCGCTCACAGAGCTCACTCTTCTATGGT CGGTTTCGACTTGCCAACGTGCTGCCGGTTTCTTGTTGGAAAA GGAATTGAAGTACTTCGGTAAGGCTTTGGAGAACCCAACCAG ACCATTCTTGGCCATCTTAGGTGGTGCCAAGGTTGCTGACAAG ATTCAATTGATTGACAACTTGTTGGACAAGGTCGACTCTATCAT CATTGGTGGTGGTATGGCTTTCCCTTCAAGAAGGTTTTGGAAA ACACTGAAATCGGTGACTCCATCTTCGACAAGGCTGGTGCTG AAATCGTTCCAAAGTTGATGGAAAAGGCCAAGGCCAAGGGTG TCGAAGTCGTCTTGCAGTCGACTTCATCATTGCTGATGCTTTC TCTGCTGATGCCAACACCAAGACTGTCACTGACAAGGAAGGT ATTCCAGCTGGCTGGCAAGGGTTGGACAATGGTCCAGAATCT AGAAAGTGTTTGCTGCTACTGTTGCAAAGGCTAAGACCATTGT CTGGAACGGTCCACCAGGTGTTTTCGAATTCGAAAAGTTCGCT GCTGGTACTAAGGCTTTGTTAGACGAAGTTGTCAAGAGCTCTG CTGCTGGTAACACCGTCATCATTGGTGGTGGTGACACTGCCA

54
Two data structures used: 1) Current pattern nucleotide frequencies q i,1,..., q i,4 and corresponding background frequencies p i,1,..., p i,4 2) Current positions of site startpoints in the N sequences a 1,..., a N, i.e. the alignment that contributes to q i,j. One starting point in each sequence is chosen randomly initially. The Gibbs Sampling algorithm tgacttcc tgatctct agacctca tgacctct Probabilistic Methods for Pattern Discovery

55
Iteration step Remove one sequence z from the set. Update the current pattern according to tgacttcc tgatctct agacctca tgacctct Pseudocount for symbol j Sum of all pseudocounts in column Probabilistic Methods for Pattern Discovery A ’Score’ the current pattern against each possible occurence a k in z. Draw a new a k with probabilities based on respective score divided by the background model B z

56
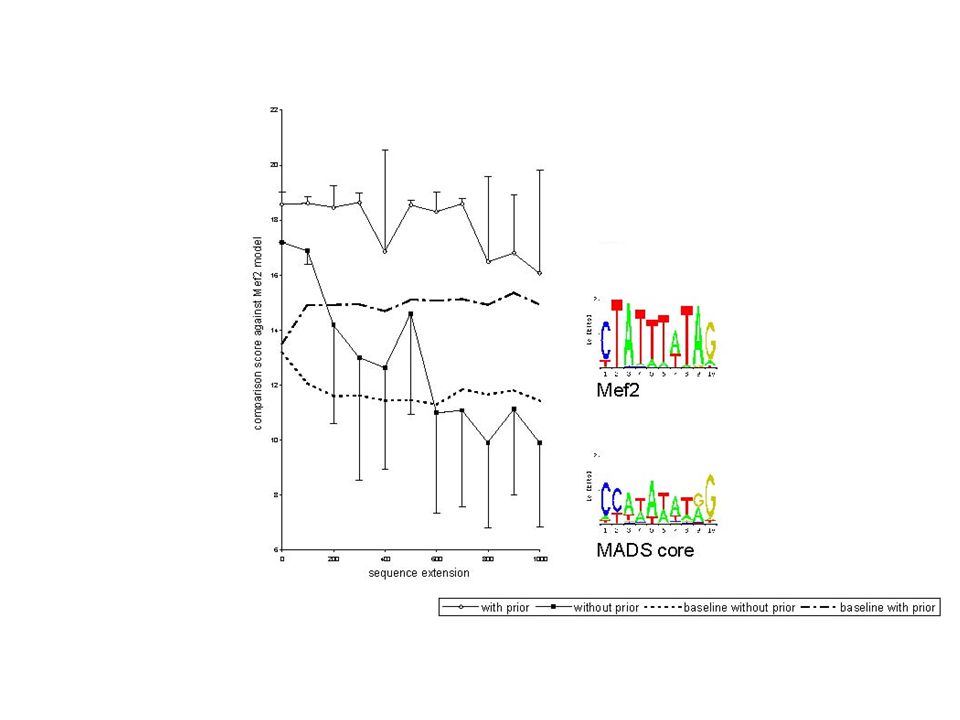
CMMT Applied Pattern Discovery is Acutely Sensitive to Noise SEQUENCE LENGTH PATTERN SIMILARITY vs. TRUE MEF2 PROFILE True Mef2 Binding Sites

57
CMMT Four Approaches to Improve Sensitivity Better background models -Higher-order properties of DNA Phylogenetic Footprinting –Human:Mouse comparison eliminates ~75% of sequence Regulatory Modules –Architectural rules Limit the types of binding profiles allowed –TFBS patterns are NOT random

58
Information segmentation Information content distributions of TFBS are distinctly non-random (Wasserman et al 2000) Palindromicity, dyads (van Helden et al 2000) Variable gaps (Hu 2003) TFBSs are not randomly drawn Enhancing pattern detection sensitivity
 Palindromicity, dyads (van Helden et al 2000) Variable gaps (Hu 2003) TFBSs are not randomly drawn Enhancing pattern detection sensitivity")
59
CMMT Pattern discovery methods using biochemical constraints

60
CMMT Some profile constraints have been explored… Segmentation of informative columns Palindromic patterns

61
CMMT Our Hypothesis Point 1: Structurally-related DNA binding domains interact with similar target sequences Exceptions exist (e.g. Zn-fingers) Point 2: There are a finite number of binding domains used in human TFs Approximately 20-25 Idea: We could use the shared binding properties for each family to focus pattern detection methods Constrain the range of patterns sought
 Point 2: There are a finite number of binding domains used in human TFs Approximately Idea: We could use the shared binding properties for each family to focus pattern detection methods Constrain the range of patterns sought.")
62
CMMT Comparison of profiles requires alignment and a scoring function Scoring function based on sum of squared differences Align frequency matrices with modified Needleman-Wunsch algorithm Calculate empirical p-values based on simulated set of matrices Score Frequency

63
CMMT Intra-family comparisons more similar than inter-family TF Database (JASPAR) COMPARE Match to bHLH Jackknife Test87% correct Independent Test Set93% correct
 COMPARE Match to bHLH Jackknife Test87% correct Independent Test Set93% correct")
64
CMMT

65
FBPs enhance sensitivity of pattern detection

67
CMMT REVIEWING THE TOP POINTS

68
Orientation Regulatory regions problem space Sets of binding sites AATCACCA AATCACCA AATCACCA AATCACCA AATCTCCC AATCTCCG AATCACAC AATCATCA AATCTCAC AATCTCTG AGTCCCCA AATCCCGG AATCTGAG AATCCATA ATTCAGCC AATAACTT GATAACCT AATTAGAC GATTACAG GATTAGCG ATTCTTCC TATGAACA GATTAAAA AGACCCCA Sets of binding sites AATCACCA AATCACCA AATCACCA AATCACCA AATCTCCC AATCTCCG AATCACAC AATCATCA AATCTCAC AATCTCTG AGTCCCCA AATCCCGG AATCTGAG AATCCATA ATTCAGCC AATAACTT GATAACCT AATTAGAC GATTACAG GATTAGCG ATTCTTCC TATGAACA GATTAAAA AGACCCCA Specificity profiles for binding sites A [ -2 0 -2 -0.415 0.585 -2 -2 2.088 -2 -2 -1 0.585 ] C [ 1 0.585 0 0 -1 -2 -2 -2 2.088 -2 0.585 0.807 ] G [0.585 0.322 0.807 1.585 1 -2 2 -2 -2 2.088 -2 0 ] T [0.319 0.322 1 -2 0 2.088 -1 -2 -2 -2 1.459 -0.415 ] Specificity profiles for binding sites A [ -2 0 -2 -0.415 0.585 -2 -2 2.088 -2 -2 -1 0.585 ] C [ 1 0.585 0 0 -1 -2 -2 -2 2.088 -2 0.585 0.807 ] G [0.585 0.322 0.807 1.585 1 -2 2 -2 -2 2.088 -2 0 ] T [0.319 0.322 1 -2 0 2.088 -1 -2 -2 -2 1.459 -0.415 ] Clusters of binding sites Transcription factors Transcription factor binding sites Regulatory nucleotide sequences Transcription factors Transcription factor binding sites Regulatory nucleotide sequences TATAURE URFPol-II
![Orientation Regulatory regions problem space Sets of binding sites AATCACCA AATCACCA AATCACCA AATCACCA AATCTCCC AATCTCCG AATCACAC AATCATCA AATCTCAC AATCTCTG AGTCCCCA AATCCCGG AATCTGAG AATCCATA ATTCAGCC AATAACTT GATAACCT AATTAGAC GATTACAG GATTAGCG ATTCTTCC TATGAACA GATTAAAA AGACCCCA Sets of binding sites AATCACCA AATCACCA AATCACCA AATCACCA AATCTCCC AATCTCCG AATCACAC AATCATCA AATCTCAC AATCTCTG AGTCCCCA AATCCCGG AATCTGAG AATCCATA ATTCAGCC AATAACTT GATAACCT AATTAGAC GATTACAG GATTAGCG ATTCTTCC TATGAACA GATTAAAA AGACCCCA Specificity profiles for binding sites A [ ] C [ ] G [ ] T [ ] Specificity profiles for binding sites A [ ] C [ ] G [ ] T [ ] Clusters of binding sites Transcription factors Transcription factor binding sites Regulatory nucleotide sequences Transcription factors Transcription factor binding sites Regulatory nucleotide sequences TATAURE URFPol-II](http://images.slideplayer.com/14/4205781/slides/slide_68.jpg "Orientation Regulatory regions problem space Sets of binding sites AATCACCA AATCACCA AATCACCA AATCACCA AATCTCCC AATCTCCG AATCACAC AATCATCA AATCTCAC AATCTCTG AGTCCCCA AATCCCGG AATCTGAG AATCCATA ATTCAGCC AATAACTT GATAACCT AATTAGAC GATTACAG GATTAGCG ATTCTTCC TATGAACA GATTAAAA AGACCCCA Sets of binding sites AATCACCA AATCACCA AATCACCA AATCACCA AATCTCCC AATCTCCG AATCACAC AATCATCA AATCTCAC AATCTCTG AGTCCCCA AATCCCGG AATCTGAG AATCCATA ATTCAGCC AATAACTT GATAACCT AATTAGAC GATTACAG GATTAGCG ATTCTTCC TATGAACA GATTAAAA AGACCCCA Specificity profiles for binding sites A [ ] C [ ] G [ ] T [ ] Specificity profiles for binding sites A [ ] C [ ] G [ ] T [ ] Clusters of binding sites Transcription factors Transcription factor binding sites Regulatory nucleotide sequences Transcription factors Transcription factor binding sites Regulatory nucleotide sequences TATAURE URFPol-II")
69
Analysis of regulatory regions with TFBS Detecting binding sites in a single sequence Scanning a sequence against a PWM A [-0.2284 0.4368 -1.5 -1.5 -1.5 0.4368 -1.5 -1.5 -0.2284 0.4368 ] C [-0.2284 -0.2284 -1.5 -1.5 1.5128 -1.5 -0.2284 -1.5 -0.2284 -1.5 ] G [ 1.2348 1.2348 2.1222 2.1222 0.4368 1.2348 1.5128 1.7457 1.7457 -1.5 ] T [ 0.4368 -0.2284 -1.5 -1.5 -0.2284 0.4368 0.4368 0.4368 -1.5 1.7457 ] ACCCTCCCCAGGGGCGGGGGGCGGTGGCCAGGACGGTAGCTCC Abs_score = 13.4 (sum of column scores) Sp1 Calculating the relative score A [-0.2284 0.4368 -1.5 -1.5 -1.5 0.4368 -1.5 -1.5 -0.2284 0.4368 ] 1.5128 C [-0.2284 -0.2284 -1.5 -1.5 1.5128 -1.5 -0.2284 -1.5 -0.2284 -1.5 ] 1.23481.2348 2.1222 2.12221.2348 1.5128 1.7457 1.7457 G [ 1.2348 1.2348 2.1222 2.1222 0.4368 1.2348 1.5128 1.7457 1.7457 -1.5 ] 1.7457 T [ 0.4368 -0.2284 -1.5 -1.5 -0.2284 0.4368 0.4368 0.4368 -1.5 1.7457 ] -1.5-1.5 -1.5 A [-0.2284 0.4368 -1.5 -1.5 -1.5 0.4368 -1.5 -1.5 -0.2284 0.4368 ] -1.5 C [-0.2284 -0.2284 -1.5 -1.5 1.5128 -1.5 -0.2284 -1.5 -0.2284 -1.5 ] -1.5 G [ 1.2348 1.2348 2.1222 2.1222 0.4368 1.2348 1.5128 1.7457 1.7457 -1.5 ] 0.4368 -0.2284-1.5 -1.5-1.5 T [ 0.4368 -0.2284 -1.5 -1.5 -0.2284 0.4368 0.4368 0.4368 -1.5 1.7457 ] Max_score = 15.2 (sum of highest column scores) Min_score = -10.3 (sum of lowest column scores) Scanning 1300 bp of human insulin receptor gene with Sp1 at rel_score threshold of 75% Ouch.
![Analysis of regulatory regions with TFBS Detecting binding sites in a single sequence Scanning a sequence against a PWM A [ ] C [ ] G [ ] T [ ] ACCCTCCCCAGGGGCGGGGGGCGGTGGCCAGGACGGTAGCTCC Abs_score = 13.4 (sum of column scores) Sp1 Calculating the relative score A [ ] C [ ] G [ ] T [ ] A [ ] -1.5 C [ ] -1.5 G [ ] T [ ] Max_score = 15.2 (sum of highest column scores) Min_score = (sum of lowest column scores) Scanning 1300 bp of human insulin receptor gene with Sp1 at rel_score threshold of 75% Ouch.](http://images.slideplayer.com/14/4205781/slides/slide_69.jpg "Analysis of regulatory regions with TFBS Detecting binding sites in a single sequence Scanning a sequence against a PWM A [ ] C [ ] G [ ] T [ ] ACCCTCCCCAGGGGCGGGGGGCGGTGGCCAGGACGGTAGCTCC Abs_score = 13.4 (sum of column scores) Sp1 Calculating the relative score A [ ] C [ ] G [ ] T [ ] A [ ] -1.5 C [ ] -1.5 G [ ] T [ ] Max_score = 15.2 (sum of highest column scores) Min_score = (sum of lowest column scores) Scanning 1300 bp of human insulin receptor gene with Sp1 at rel_score threshold of 75% Ouch.")
70
Low specificity of profiles: too many hits great majority not biologically significant A dramatic improvement in the percentage of biologically significant detections Scanning a single sequenceScanning a pair orf orthologous sequences for conserved patterns in conserved sequence regions Analysis of regulatory regions with TFBS Phylogenetic Footprints

71
CMMT Pattern Discovery

72
CMMT Concluding Thoughts Bioinformatics is often constrained by our understanding of biochemistry rather than computational or statistical limitations Evolution has a powerful influence on the performance of many bioinformatics methods Computational predictions have value, but only if you understand the limitations of the methods

Similar presentations


 10/17/07.>")

 with a countable infinite number of Gaussian components.>")


>")
