Download presentation
Presentation is loading. Please wait.

1
Britain’s Declining House Sizes Coming to the US?

2
Measuring Housing Affordability: Median Multiple Median House Price/Median Household Income (Used by UN, OECD and others)
")
3
Median Multiple (Price to Income Ratio) INTERNATIONAL:1980s-2000s
 INTERNATIONAL:1980s-2000s")
4
Data from Royal Institute of British Architects New House Size: US & UK 2009 United States United Kingdom

5
House Size Decline: United Kingdom 1920 COMPARED TO 2009 1920 2009 Data from Royal Institute of British Architects

6
Terraced (Town House)
")
7
Semi-Detached (2-Family House or Duplex)
")
8
Detached

10
World War I: Ypres (Belgium)
")
11
British War Cemetery: Ypres British War Fatalities 1 Million (2.5x WW20

12
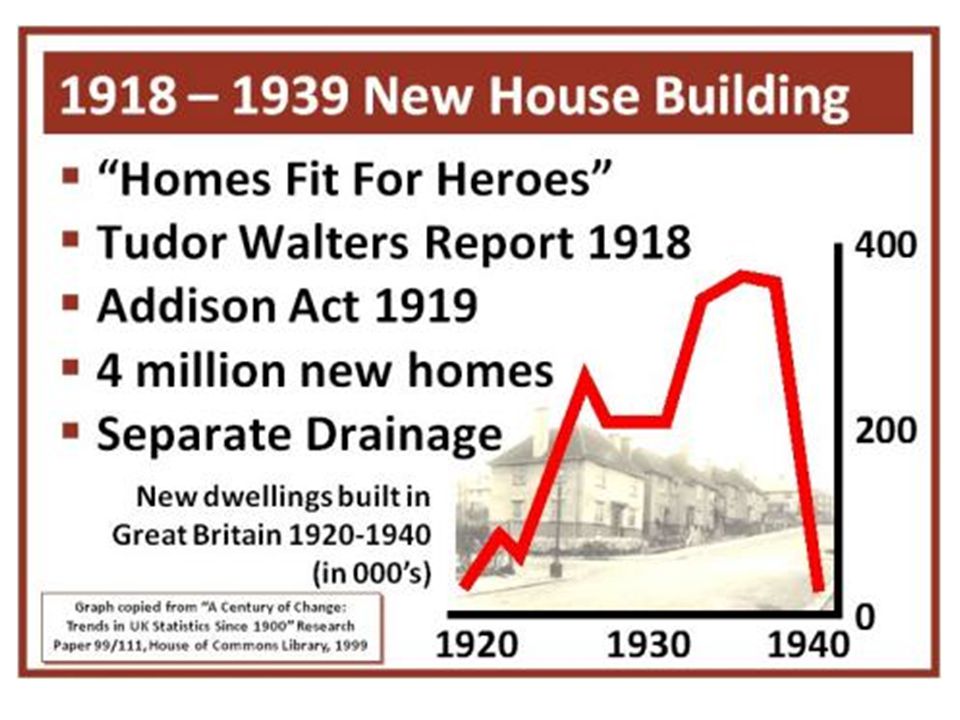
David Lloyd George Prime Minister 1917-1922 Homes fit for heroes

14
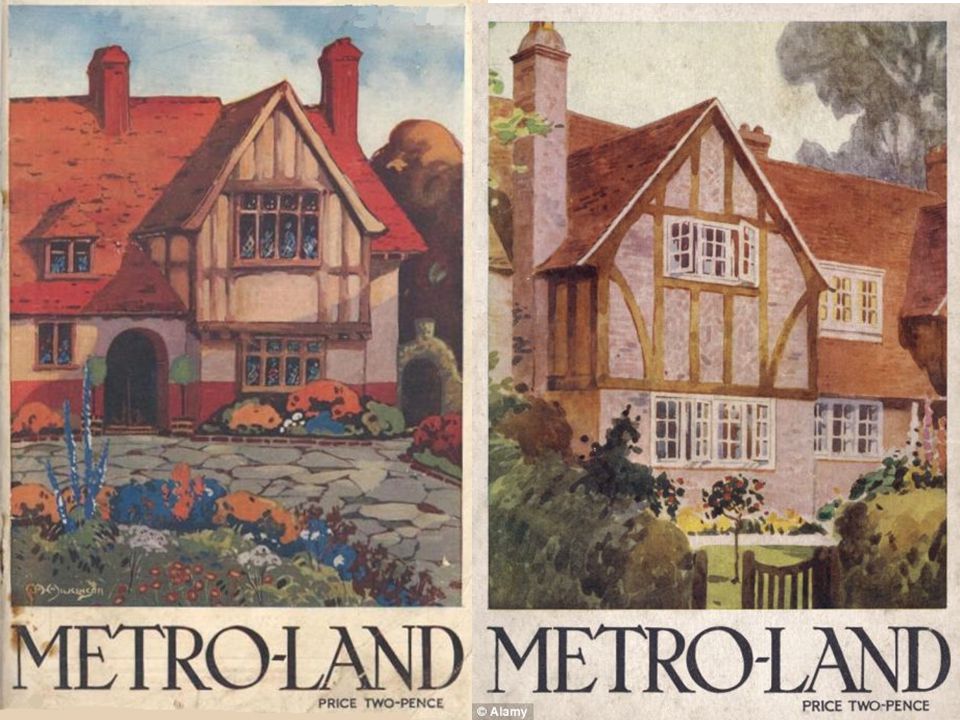
Suburban London

16
The Result

17
Elitist Disparagement (Interwar) An affront to the eye ‘slums of the future 1938: “their destruction was ‘an eventuality that does much to reconcile one to the prospect of aerial bombardment’. …the new style of homes represented 'something worse than the meanness of poverty - the meanness of spirit'

18
World War II: St. Paul’s (London)
")
20
Winston Churchill Prime Minister 1940-1945 1951-1955

21
Post World War II Clement Atlee, Prime Minister 1945-1951: With Truman & Stalin

22
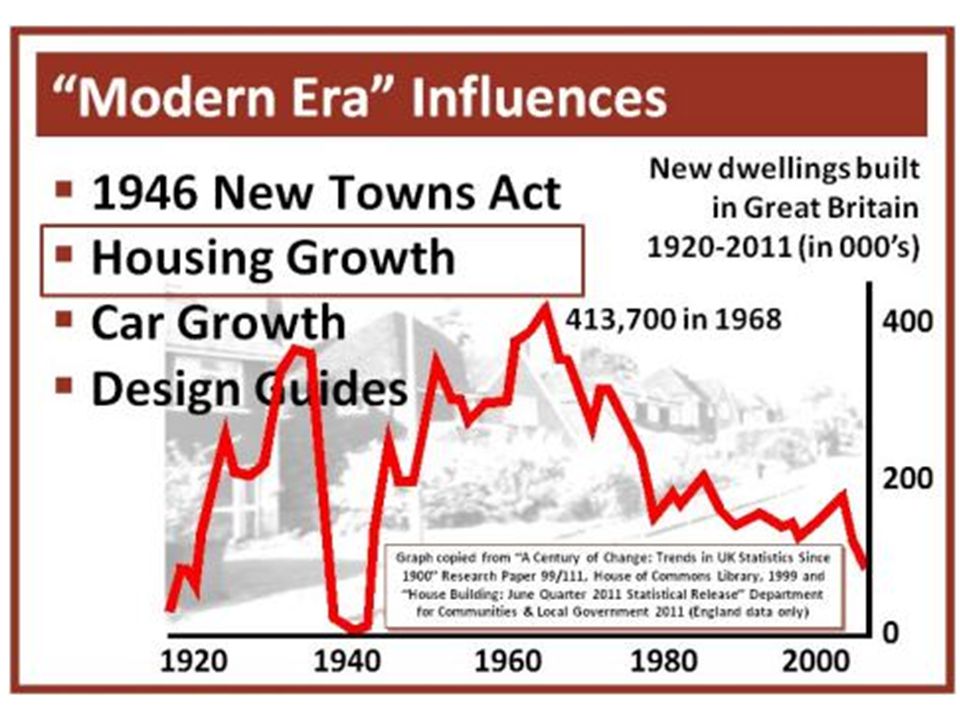
Town & Country Planning Act: 1947 Green Belts

23
Post World War II Council Houses

24
Post World War II Council Houses

25
Sir Peter Hall Urbanologist

26
Margaret Thatcher Prime Minister 1979-1990

29
Barker Reports … to reduce the long- term trend in house price increases to 1.1% a year – compared with the current rate of more than 9% a year – would require 260,000 homes to be built annually. Since then, an average of just 115,000 homes have been built in the private sector each year.

31
Post World War II: US HOME OWNERSHIP INCREASE Levittown (NY): Birthplace of the American Dream
: Birthplace of the American Dream")
32
Lakewood, California (Los Angeles Area)
")
33
From Census Bureau Home Ownership Rate: 1900-2013 UNITED STATES AVERAGE Figure 33

34
U.S. nationally syndicated newspaper columnist Neal Pearce implied that the Columbine High School massacre, was caused by urban sprawl. Suburban bankruptcy predictions Faceless estates. Soulless financial districts. Elite Disparagement

35
Housing Affordability 1950-2012 MAJOR US METROPOLITAN AREAS: MEDIAN MULTIPLE Median Multiple: Median House Price divided by Median Household Income Figure 35 Greater Price Volatility

36
$550,000 (2007) Houston Exurbs (Katy) 4,500 square feet Lot: 0.4 Acre $550,000 (2007) Los Angeles Exurbs (Simi Valley) 1,700 square feet Lot: 0.1 Acre
 Houston Exurbs (Katy) 4,500 square feet Lot: 0.4 Acre $550,000 (2007) Los Angeles Exurbs (Simi Valley) 1,700 square feet Lot: 0.1 Acre")
37
MANILA SICK Priorities are Wrong

38
Why did people move to the cities? Not light rail, good urban planning To have better lives Yet urban planning is – Reducing the standard of living and increasing poverty Need to replace policy based on means (inputs) – To policy based on ends (Outputs) – Maintain the standard of living & reduce poverty
 – To policy based on ends (Outputs) – Maintain the standard of living & reduce poverty.")
39
Anti-Smart Growth Government Re-elected NEW ZEALAND SEPTEMBER 20, 2014 David Seymour

Similar presentations


>")


