Download presentation
Presentation is loading. Please wait.

1
Rock Cycle & Soil Origins Magma –> Igneous Rocks Intrusive, Extrusive Transportation, Erosion, Weathering Sediments -> Sedimentary Rock Metamorphism Melting to Magma

2
Natural Soil Deposits Weathering Process Mechanical and Chemical Soil Types Residual - Formed in-place Transported – Glacial, Alluvial, Aeolian

3
Soil-Particle Size Coarse Grains Gravels - typically > 2 mm Sands – typically 0.075 – 2 mm Fine Grains Silts – 0.002 – 0.075 mm Clays – typically < 0.002 mm

4
Particle Size – Table 1.1 MIT – Initial classification system USDA – Textural classification system, agronomy AASHTO – Classification for road building purposes USCS – Predominant system used for geotechnical engineering

5
Clay Minerals Silica Tetrahedron Silica Sheet Alumina Octahedron Octahedral Sheet (Gibbsite) Different clay minerals built up of varying sheet combinations Become putty-like in presence of water
 Different clay minerals built up of varying sheet combinations Become putty-like in presence of water")
6
Clay Minerals Kaolinite – Large blocky particles 15 m 2 /g specific surface Illite – flake-shaped particles 80 m 2 /g Montmorillonite – Very flaky 800 m 2 /g

7
Specific Gravity Ratio of unit weight of material to the unit weight of water G s = ( s / ( w = M s / V s ( w Typically 2.6 to 2.9 Table 1.2 provides representative values

8
Mechanical Analysis Sieve Analysis Good to 0.075 mm (#200) Dry - Mechanical shaker Wet – Hand separation Hydrometer Analysis Sedimentation Test Good to 1-2 :
 Dry - Mechanical shaker Wet – Hand separation Hydrometer Analysis Sedimentation Test Good to 1-2 :")
9
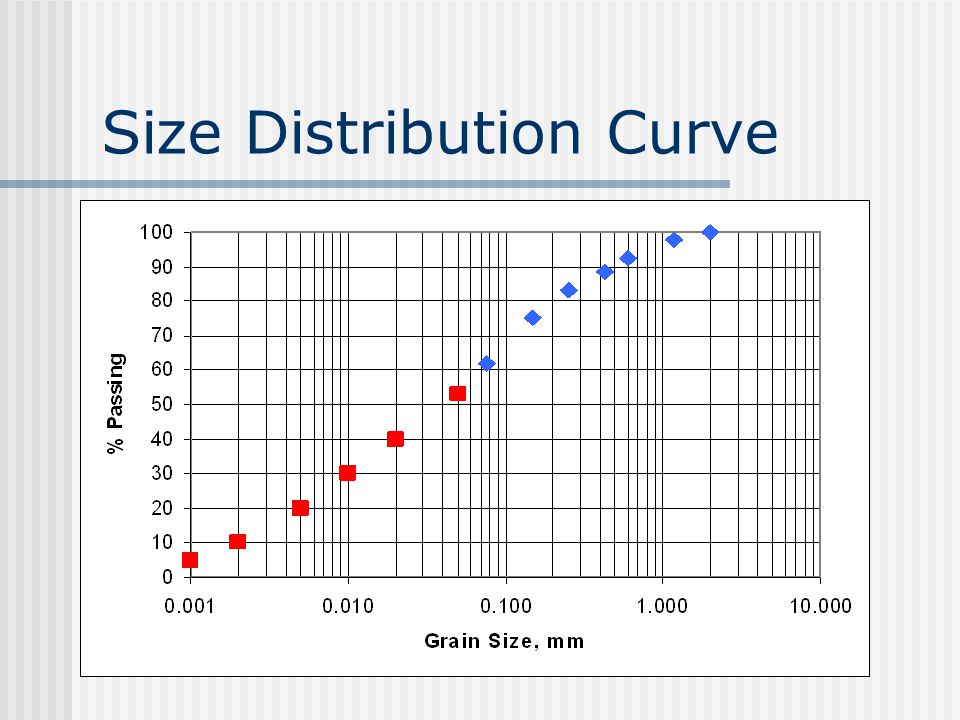
Particle-Size Distribution Generally plotted on semi-log paper with % Passing vs. log size Provides simple visual aid for describing predominant size range and size distribution

10
Sieve No. Size mm Mass Ret g Indiv.% Retained Cumm % Retained % Passing 102.0000.00 100.0 161.1809.902.20 97.8 300.60024.665.487.6892.3 400.42517.603.9111.5988.4 600.25023.905.3116.9093.1 1000.15035.107.8024.7075.3 2000.07559.8513.3038.0062.0 Pan ------278.9962.00 ----- Table 1.4 Sieve Analysis

11
Size Distribution Curve

13
Visual Interpretations

14
Shorthand Descriptors P xx – Percent passing sieve xx For example, P 200, P 1” R xx – Percent retained on sieve xx For example, R 200 P xx = 100 – R xx D xx – Diameter for which xx% is finer For example, D 10

15
Size Distribution Curve P4P4 #4 D 30 30

16
Numerical Descriptors Effective Size, D 10 Uniformity Coefficient, C u C u = D 60 / D 10 Coefficient of Gradation, C z C z = D 30 2 / D 60 D 10

17
Numerical Descriptors Coarse Grained Soils Gravels Well Graded if C u >4 and 1<C z <3 Sands Well Graded if C u >6 and 1<C z <3

Similar presentations


>")


 Sections: 2.5, 2.6, 2.7>")

>")

