Download presentation
Presentation is loading. Please wait.

1
Running, Human Evolution, and Barefoot Running Review of Bramble & Lieberman (2004) Nature 432: 345-352 W. Rose

2
Austr. afarensis Homo sapiens Homo erectus Present 10 Mya 5 Mya1.8 Mya3.5 Mya Gorillas Chimp- anzees Human Evolutionary Timeline

3
Background Australopithecines walked habitually > 4 Mya H. erectus a better walking design than Australopith.: walking / swinging tradeoff Was human running selected for? Did running influence human evolution? Most have said probably not. Humans not very good sprinters. Horses, antelopes, greyhounds can run faster longer. Sources: Bramble & Lieberman (2004) Nature 432: 345-352;.
 Nature 432: ;..")
4
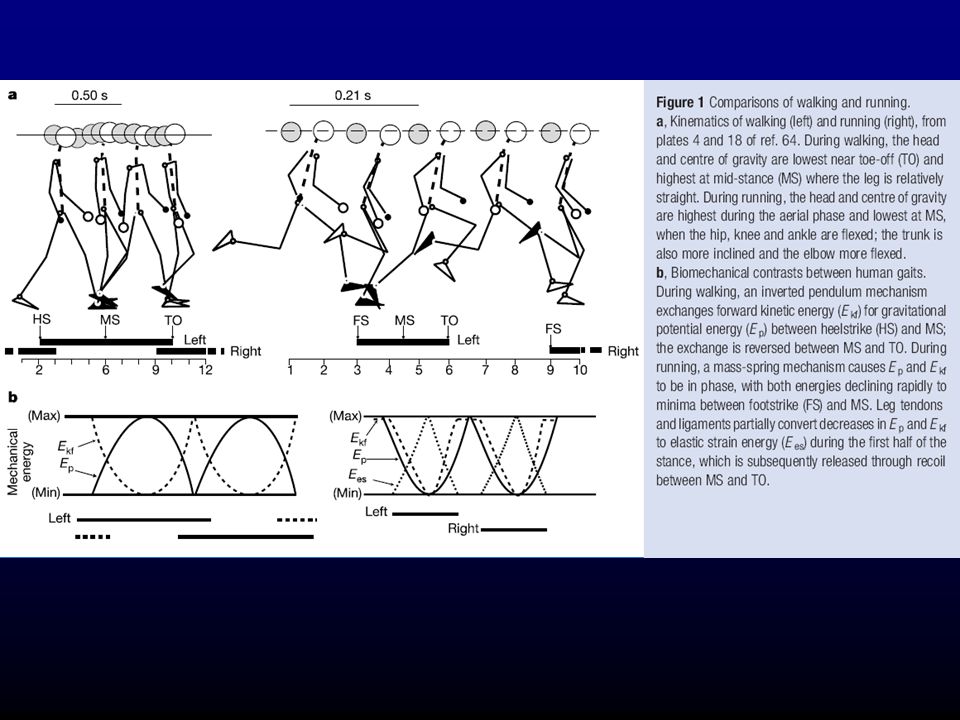
Run vs. walk Walk Inverted pendulum, KE – PE tradeoff C.o.m. vaults over extended leg in stance U-shaped cost-of-transport (COT) curve Optimum speed a function of leg length Run Mass-spring mechanism, KE – PE tradeoff Tendons, muscles, ligaments store PE Limbs flex more in run to store energy Walk-to-run transition occurs where COT curves intersect – as one might expect Sources: Bramble & Lieberman (2004) Nature 432: 345-352.
 curve Optimum speed a function of leg length Run Mass-spring mechanism, KE – PE tradeoff Tendons, muscles, ligaments store PE Limbs flex more in run to store energy Walk-to-run transition occurs where COT curves intersect – as one might expect Sources: Bramble & Lieberman (2004) Nature 432:")
6
Running gait Human running like trotting Bipeds can’t gallop Forelimbs move with opp. hindlimbs Human running, trotting both bouncy Run Mass-spring mechanism, KE – PE tradeoff Tendons, ligaments store PE Limbs flex more in run to store energy Walk-to-run where COT curves intersect Sources: Bramble & Lieberman (2004) Nature 432: 345-352.
 Nature 432:")
8
Endurance Running (ER) ER: many kilometers, aerobically, 3-6.5 m/s Humans: only primates that do ER Better than most mammals Humans can run faster than most trotting animals trot, esp. when consider body size Distance: >10% Americans run kms/day Distance: Thousands/yr run 42 km Unknown in other primates; unusual in other mammals Sources: Bramble & Lieberman (2004) Nature 432: 345-352.
 Nature 432:")
9
Running Adaptations What adaptations make ER possible? When do they appear in fossil record? Four areas of adaptation required for ER Energetics Strength Stabilization Thermoregulation

11
Energetics Long tendons, short muscles Chimps: short calcaneal tendon Australopithicus: Calcaneal tendon insertion site is chimplike Plantar arch: another energy storage site in humans Chimps: flat feet, weight bearing, large medial tuberosity on navicular. Austr. like chimps, but early Homo lack large medial tuberosity on navicular

12
Bramble & Lieberman (2004) Nature 432: 345-352.
 Nature 432:")
13
Energetics: Stride length Humans have longer stride than expected for animal their size Humans increase speed mostly by increasing stride length Long (relative to body size) legs in humans, H. erectus. Chimps short. Australopithecis? Oscillating long legs is costly unless minimize moment of inertia, hence small human feet Human feet small compared to chimps & pithecines (9% v 14% leg mass, hmn v chmp)
.")
14
Bramble & Lieberman (2004) Nature 432: 345-352.
 Nature 432:")
15
Skeletal strength Running: large skeletal stresses Force at heel strike = 3-4X body wt Force travels up skeleton Adaptations Larger lower limb joint surfaces in human v chimp, even after adjust for weight: knee, hip, sacroiliac, lumbar centra Reduced femoral neck length & inter-acetabular distance reduces bending moments on femoral neck, sacrum, lower back – compare Homo to chimps, Australopithicus

16
Bramble & Lieberman (2004) Nature 432: 345-352.
 Nature 432:")
17
Stabilization Gluteus max: its “increased size is among the most distinctive of all human features” Enlarged sacral transverse process Enlarged area for erector spinae attachment on sacrum, PSIS – allows the forward pitch of trunk during running Decoupled head & shoulder (longer neck, fewer/smaller muscles) Homo vs Pan, Austr
 Homo vs Pan, Austr")
18
Stabilization Reduced forearm mass in Homo (50% smaller than Pan when adjust for body weight) reduces effort to keep arm flexed Decoupled head & shoulder (longer neck, fewer/smaller muscles) Homo vs chimp, Austr Wide shoulders of Homo enhance counter- balancing effect of arm-swinging in running
 reduces effort to keep arm flexed Decoupled head & shoulder (longer neck, fewer/smaller muscles) Homo vs chimp, Austr Wide shoulders of Homo enhance counter- balancing effect of arm-swinging in running")
19
Head Stabilization Occipital projection behind condyles improves balance, reduces pitch-forward tendency at footstrike Larger relative diam of posterior semicircular canal increaes sensitivity to sagital plane accelerations of head Large nucchal ligament seen in humans, cursors, & large-headed mammals (elephant) but not chimps; Australopithicus lacks nucchal line on occipital bone
 but not chimps; Australopithicus lacks nucchal line on occipital bone")
20
Thermoregulation Dissipate waste heat of running Humans: Larger & more eccrine sweat glands for evaporative cooling Lack of body hair Larger near-surface cranial venous circulation Mouth breathing (also lowers work of breathing)
")
21
Summary of some human adaptations for running

22
F z (t)=vertical ground reaction force. Δv com =change in velocity of center of mass. T=impact duration, g=gravitational acceleration. Lieberman, Davis, et al. (2010). Foot strike patterns and collision forces in habitually barefoot versus shod runners. Nature 463: 531-535.
. Foot strike patterns and collision forces in habitually barefoot versus shod runners. Nature 463:")
23
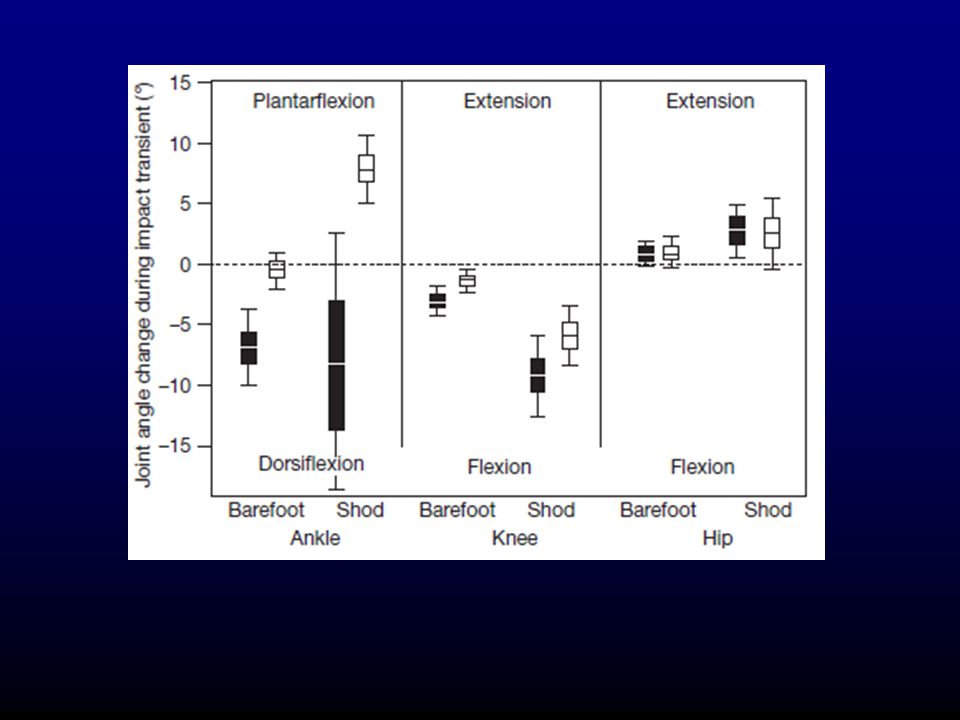
Figure 1. Vertical ground reaction forces and foot kinematics for three foot strikes at 3.5m/s in the same runner. a, RFS during barefoot heel–toe running; b, RFS during shod heel–toe running; c, FFS during barefoot toe–heel–toe running. Both RFS gaits generate an impact transient, but shoes slow the transient’s rate of loading and lower its magnitude. FFS generates no impact transient even in the barefoot condition. Lieberman, Davis, et al. (2010). Foot strike patterns and collision forces in habitually barefoot versus shod runners. Nature 463: 531-535.
. Foot strike patterns and collision forces in habitually barefoot versus shod runners. Nature 463:")
24
Figure 1. Vertical ground reaction forces and foot kinematics for three foot strikes at 3.5m/s in the same runner. a, RFS during barefoot heel–toe running; b, RFS during shod heel–toe running; c, FFS during barefoot toe–heel–toe running. Both RFS gaits generate an impact transient, but shoes slow the transient’s rate of loading and lower its magnitude. FFS generates no impact transient even in the barefoot condition. Lieberman, Davis, et al. (2010). Foot strike patterns and collision forces in habitually barefoot versus shod runners. Nature 463: 531-535.
. Foot strike patterns and collision forces in habitually barefoot versus shod runners. Nature 463:")
25
Figure 1. Vertical ground reaction forces and foot kinematics for three foot strikes at 3.5m/s in the same runner. a, RFS during barefoot heel–toe running; b, RFS during shod heel–toe running; c, FFS during barefoot toe–heel–toe running. Both RFS gaits generate an impact transient, but shoes slow the transient’s rate of loading and lower its magnitude. FFS generates no impact transient even in the barefoot condition. Lieberman, Davis, et al. (2010). Foot strike patterns and collision forces in habitually barefoot versus shod runners. Nature 463: 531-535.
. Foot strike patterns and collision forces in habitually barefoot versus shod runners. Nature 463:")
26
Figure 2. Variation in impact transients. a, Magnitude of impact transient in units of body weight for habitually shod runners who RFS (group 1; open boxes) and habitually barefoot runners who FFS when barefoot (group 3; shaded boxes).
 and habitually barefoot runners who FFS when barefoot (group 3; shaded boxes)..")
27
Figure 2. Variation in impact transients. b, Rate of loading of impact transient in units of body weight for habitually shod runners who RFS (group 1; open boxes) and habitually barefoot runners who FFS when barefoot (group 3; shaded boxes).
 and habitually barefoot runners who FFS when barefoot (group 3; shaded boxes)..")
28
F z (t)=vertical ground reaction force. Δv com =change in velocity of center of mass. T=impact duration, g=gravitational acceleration. Lieberman, Davis, et al. (2010). Foot strike patterns and collision forces in habitually barefoot versus shod runners. Nature 463: 531-535. Effective mass during impact
. Foot strike patterns and collision forces in habitually barefoot versus shod runners. Nature 463: Effective mass during impact.")
29
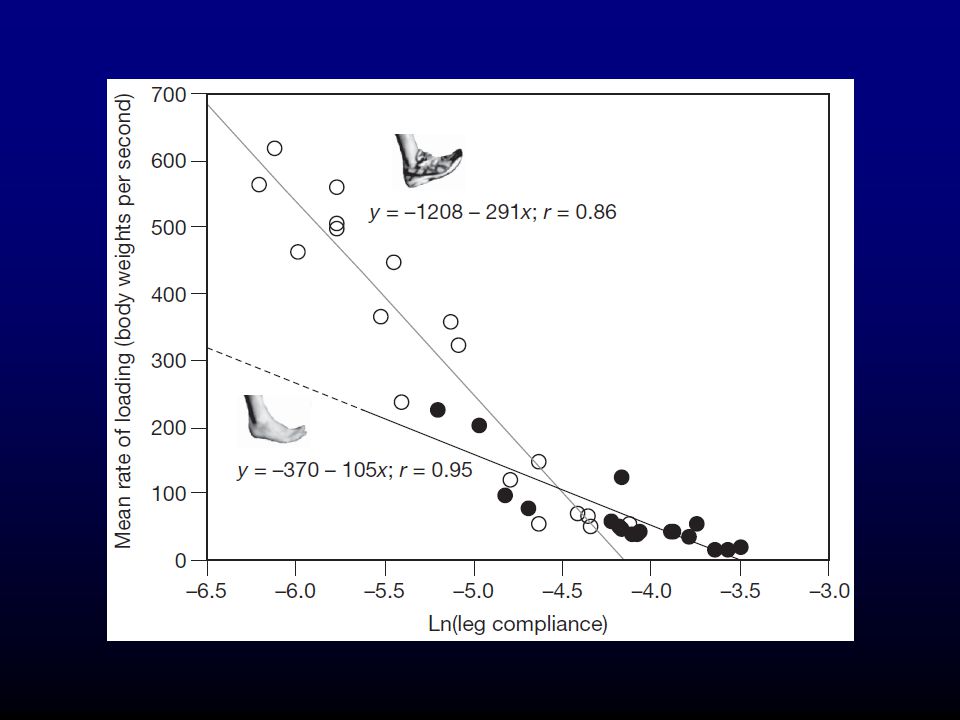
Effective mass during impact, meas. & pred. Open box=RFS barefoot; closed box=FFS barefoot; solid line=infinitely stiff ankle, dotted, infinitely compliant ankle. Str.idx.= location of impact cop as fraction of foot length.

33
Fig. 2. Vertical ground reaction force of a shod RFS, MFS, and FFS. Note the distinct impact peak of the RFS that is missing in the MFS and FFS patterns. RFS, rearfoot strikers; MFS, midfoot strikers; FFS, forefoot strikers. Altman, Davis (2012). Barefoot Running: Biomechanics and Implications for Running Injuries. Curr Sports Med Rep 11: 244-249.
. Barefoot Running: Biomechanics and Implications for Running Injuries. Curr Sports Med Rep 11:")
34
Fig. 3. Vertical ground reaction force of a shod rearfoot striker (RFS) and a barefoot runner (BF). Note the similarity between the forefoot (Fig. 2) and barefoot curves. Altman, Davis (2012). Barefoot Running: Biomechanics and Implications for Running Injuries. Curr Sports Med Rep 11: 244-249.
 and a barefoot runner (BF). Note the similarity between the forefoot (Fig. 2) and barefoot curves. Altman, Davis (2012). Barefoot Running: Biomechanics and Implications for Running Injuries. Curr Sports Med Rep 11:")
35
Fig. 4. Eversion (pronation) moment (curved arrow) during barefoot (A) and shod (B) running, created from the vertical ground reaction force at landing. The eversion moment is higher in the shod condition (B) due to the larger moment arm resulting from the increased width of the shoe and heel flare. Altman, Davis (2012). Barefoot Running: Biomechanics and Implications for Running Injuries. Curr Sports Med Rep 11: 244-249.
 moment (curved arrow) during barefoot (A) and shod (B) running, created from the vertical ground reaction force at landing. The eversion moment is higher in the shod condition (B) due to the larger moment arm resulting from the increased width of the shoe and heel flare. Altman, Davis (2012). Barefoot Running: Biomechanics and Implications for Running Injuries. Curr Sports Med Rep 11:")
36
Axial T1-weighted, fat-suppressed, magnetic resonance imaging (MRI) showing marrow edema and stress reaction of the entire left second metatarsal with soft tissue edema in a 19-year-old runner who newly adopted barefoot-simulating footwear for 3 to 4 weeks. Patient was successfully treated with protected weight bearing and modified activity. Hsu (2012). Barefoot Running Review. Foot & Ankle Int. 33: 787-794.
. Barefoot Running Review. Foot & Ankle Int. 33:")
Similar presentations