Download presentation
Presentation is loading. Please wait.

1
The Traders Forum Tuesday 12 th March 2013 Presenter: Shaun van den Berg Head of Client Education Head of Client Education

2
Technical Market Overview Technical Trading Support & Resistance Fibonacci Retracement Moving Averages Stochastic & RSI indicators The Stockbroker (Trade Ideas) The Investor (Long-term Investment Opportunities) Open the Floor Upcoming Webinars Summary ConclusionAgenda
 The Investor (Long-term Investment Opportunities) Open the Floor Upcoming Webinars Summary ConclusionAgenda")
3
Technical Market Overview

4
Dow Jones Industrial Average Hang Seng & Nikkei Indices DAX Index Brent Crude Oil Gold $ & Platinum $ Euro / US $ Rand $ JSE Top 40 Index JSE FINDI 30 Index JSE Mining Index Technical Overview

5
Dow Jones Industrial Average (Weekly) Bullish Support Resistance
 Bullish Support Resistance")
6
Hang Seng Index (Weekly) Bullish Support Resistance
 Bullish Support Resistance")
7
Nikkei Index (Weekly) Bullish Support Resistance
 Bullish Support Resistance")
8
DAX Index (Weekly) Bullish Support Resistance
 Bullish Support Resistance")
9
Brent Oil Bullish Resistance Support Resistance Support Support

10
Gold $ Bearish Resistance Support Resistance Resistance Support Channel Support

11
Platinum $ Bullish Support Resistance Support / Resistance Support

12
Euro/ USD Resistance USD Weakness USD Weakness Resistance Support

13
Rand $ Resistance ZAR Weakness ZAR Weakness Resistance

14
JSE Top 40 Index Bullish Bullish Resistance Resistance Support Support

15
JSE FINDI 30 Index Bullish Bullish Support Support Resistance Resistance

16
JSE Mining Index Bullish Bullish Support Support

17
DJIA Bullish Broken Resistance Becoming Overbought Hang Seng Index Bullish / Overbought Broken Support Nikkei Index Bullish Overbought DAX Index Bullish / Overbought Broken Support New Highs Brent Crude Oil Bullish / Broken Support Summary: Technical Overview Gold $ Bearish / Support Platinum $ Bullish / Support EUR/ZAR Weakness Resistance Rand $ Weakness JSE Top 40 Index Bullish JSE FINDI 30 Index Bullish Overbought JSE Mining Index Bullish / Support 61.8% Fib retracement

18
Technical Analysis Support & Resistance / Trend Lines / Fibonacci retracement Moving Averages Stochastic & RSI indicators

19
Resistance Support Resistance Support Resistance Support & Resistance levels highlight possible “turning points” Support Resistance Support Support & Resistance

20
Support Trend Line Resistance Trend Line Support Trend Line Resistance Trend Line As long as the price stays above/ below the Support or Resistance lines, the trend is either bullish or bearish Trend Lines

21
Support & Resistance / Trend Lines Support Support Support Support Resistance Resistance Support

22
Series of numbers - Add the previous two numbers to come up with the next number in the sequence. –Example: 1,1, 2, 3, 5, 8, 13, 21, 34, 55, 89, 144 … “Golden Mean” - Measure the ratio of any number to the succeeding higher number –Example: 1/2 =.500, 2/3 = 0.666, 3/5 = 0.666 …. 34/55 =.618. Measure the ratio between alternate numbers –Example: 1/3 = 0.333, 2/5 = 0.400, ….34/89 = 0.382 Fibonacci Retracement Levels –0.236, 0.382, 0.500, 0.618, 0.764 Fibonacci Extension Levels –0, 0.382, 0.618, 1.000, 1.382, 1.618 Fibonacci Retracements

23
First draw a line between two extreme points (i.e., a significant trough & peak). (It is always applied from left to right) It measures the size of a price move & subsequently places horizontal support & resistance levels on a price chart - Used to make trading decisions A series of up to nine horizontal lines will be drawn at the Fibonacci levels of 0.0%, 23.6%, 38.2%, 50.0%, 61.8%, 100%, 161.8%, 261.8%, & 423.6%. After a significant move (either up or down), prices will often rebound & retrace a significant portion (if not all) of the original move. The 38.2%, 50% & 61.8% levels are the most commonly used levels that the price could retrace back to. The Fibonacci tool can also project extension levels that show where the price could go to - Used for profit taking or even counter trend entries. Most common extension levels used by traders are the 138.2% & 161.8%. Note: Fibonacci is not a trading system in itself –used in conjunction with/ part of a trading system. Fibonacci Retracements
 It measures the size of a price move & subsequently places horizontal support & resistance levels on a price chart - Used to make trading decisions A series of up to nine horizontal lines will be drawn at the Fibonacci levels of 0.0%, 23.6%, 38.2%, 50.0%, 61.8%, 100%, 161.8%, 261.8%, & 423.6%. After a significant move (either up or down), prices will often rebound & retrace a significant portion (if not all) of the original move. The 38.2%, 50% & 61.8% levels are the most commonly used levels that the price could retrace back to. The Fibonacci tool can also project extension levels that show where the price could go to - Used for profit taking or even counter trend entries. Most common extension levels used by traders are the 138.2% & 161.8%. Note: Fibonacci is not a trading system in itself –used in conjunction with/ part of a trading system. Fibonacci Retracements.")
27
Fibonacci Extensions

28
Moving Averages (MA) smooth out the data / Warn of a trend change after it has taken place. A crossover is any penetration of a MA – Whipsaws (False signals). Valid penetrations - Filtering techniques. For example: –Take action on a MA crossover 3% penetration / Ignore all others. Better way to avoid whipsaws - Use more than one MA. Signals are given by a shorter-term MA crossing above or below a longer- term MA. Two MAs found to be reliable in determining primary market moves are the 50-day (10-week) & 200-day (40-week) moving average crossover. –Buy signals - When the 50-day or 10-week MA moves above the 200- day or 40-week MA & when the 200-day or 40-week MA is advancing. –Sell signals - When the 50-day or 10-week MA moves below the 200- day or 40-week MA and when the 200-day or 40-week MA is declining. Moving Average Crossovers
. Valid penetrations - Filtering techniques. For example: –Take action on a MA crossover 3% penetration / Ignore all others. Better way to avoid whipsaws - Use more than one MA. Signals are given by a shorter-term MA crossing above or below a longer- term MA. Two MAs found to be reliable in determining primary market moves are the 50-day (10-week) & 200-day (40-week) moving average crossover. –Buy signals - When the 50-day or 10-week MA moves above the 200- day or 40-week MA & when the 200-day or 40-week MA is advancing. –Sell signals - When the 50-day or 10-week MA moves below the 200- day or 40-week MA and when the 200-day or 40-week MA is declining. Moving Average Crossovers.")
30
Stochastic - oscillator that indicates overbought & oversold conditions in the market. –During periods of price decreases, the price closes tend to accumulate near the low of the price range –During periods of price increases, the price closes tend to accumulate near the high of the price range. Slow Stochastic - Smoothed by means of a MA. The Slow Stochastic, plots two lines: the %K and %D. –Area above 80 - Overbought –Area below 20 - Oversold Stochastic Indicator

32
Relative Strength measures the strength of one entity relative to the strength of another entity. RSI indicator – Compare the internal strength / "Internal Strength Index Momentum indicator - Measures an equity's price relative to itself / Relative to its past performance. Front weighted - Gives a better velocity reading than other indicators. Less affected by sharp rises or falls in price performance / Filters out some of the 'noise' in trading activity. Buy & sell levels depend on period used –Shorter periods volatile indicator that reaches further extremes. –Longer periods less volatile but reaches extremes less often. –Vast majority seem to change direction at 30 & 70. Treats price as a rubber band - Stretch just so far - forced to contract. Lends itself to trend lines, support & resistance lines,& divergence. Look for divergence between price action and RSI. –Upwardly sloping price & downward sloping RSI – warning / one of them is wrong - Price is about to break down. –Downward sloping price & upward sloping RSI - Price is about to break up. RSI indicator

34
The Stockbroker Technical & Trade Ideas

35
The Stockbroker Daily & Intra-day newsletter Trade Spotlights CFD & SSF Trader Trade Ideas Entry Levels Swing Traders Target Price Stops

36
Average Trade Duration

37
Sectors

38
Longs versus Shorts Shorts: 28/80 = 35% Longs: 52/80 = 65%

39
Total Performance

40
Winners versus Losers Losers: 34/80 = 42.5% Winners: 46/80 = 57.5%

41
First Quarter 2013 Trades 22 Trades 13 Losers (59.10%) 9 Winners (40.90%) Losers: 45.81% / 13 = - 3.52% Winners: 49.74% / 9 = 5.53%
 9 Winners (40.90%) Losers: 45.81% / 13 = % Winners: 49.74% / 9 = 5.53%")
42
Closed Trades PPC (PPC) LifeHC (LHC) Open Trades BHP Billiton (BIL) Vodacom (VOD) Unopened Trades TFG (TFG) Old Mutual (OML) Trade Ideas Trade Spotlights ABIL (ABL) Implats (IMP) Email Shaunvdb@psgonline.co.za to be added to The Stockbroker mailing listShaunvdb@psgonline.co.za
 LifeHC (LHC) Open Trades BHP Billiton (BIL) Vodacom (VOD) Unopened Trades TFG (TFG) Old Mutual (OML) Trade Ideas Trade Spotlights ABIL (ABL) Implats (IMP) to be added to The Stockbroker mailing")
43
Closed Trades : PPC (PPC) Instrument: CFD / SSF Direction: Buy / Long Entry: 3385c Take Profit: 3600c Stop loss: 3301c Risk/ Reward: 1:2.56 Potential Profit: 215c per share 6.35% (36.29%) Closed @ 3600c 6.35% (36.29%)* *17.5%
 Instrument: CFD / SSF Direction: Buy / Long Entry: 3385c Take Profit: 3600c Stop loss: 3301c Risk/ Reward: 1:2.56 Potential Profit: 215c per share 6.35% (36.29%) 3600c 6.35% (36.29%)* *17.5%")
44
Closed Trades : LifeHC (LHC) Instrument: CFD / SSF Direction: Buy / Long Entry: 3209c Take Profit: 3600c Stop loss: 3099c Risk/ Reward: 1:3.554 Potential Profit: 391c per share 12.18% (81.23%) Closed @ 3400c 5.95% (39.68%)
 Instrument: CFD / SSF Direction: Buy / Long Entry: 3209c Take Profit: 3600c Stop loss: 3099c Risk/ Reward: 1:3.554 Potential Profit: 391c per share 12.18% (81.23%) 3400c 5.95% (39.68%)")
45
Open Trades: Vodacom (VOD) Instrument: CFD / SSF Direction: Buy / Long Entry: 11825c Take Profit: 12500c Stop loss: 11500c Risk/ Reward: 1:2.58 Potential Profit: 675c per share 5.71% (38%)
 Instrument: CFD / SSF Direction: Buy / Long Entry: 11825c Take Profit: 12500c Stop loss: 11500c Risk/ Reward: 1:2.58 Potential Profit: 675c per share 5.71% (38%)")
46
Open Trades: BHP Billiton (BIL) Instrument: CFD / SSF Direction: Buy / Long Entry: 28620c Take Profit: 31000c Stop loss: 27700c Risk/ Reward: 1:2.58 Potential Profit: 2380c per share 8.32% (55.47%)
 Instrument: CFD / SSF Direction: Buy / Long Entry: 28620c Take Profit: 31000c Stop loss: 27700c Risk/ Reward: 1:2.58 Potential Profit: 2380c per share 8.32% (55.47%)")
47
Unopened Trades: TFG (TFG) Instrument: CFD / SSF Direction: Buy / Long Entry: 10950c Take Profit: 11895c Stop loss: 10595c Risk/ Reward: 1:2.66 Potential Profit: 945c per share 8.63% (49.31%)* *17.5%
 Instrument: CFD / SSF Direction: Buy / Long Entry: 10950c Take Profit: 11895c Stop loss: 10595c Risk/ Reward: 1:2.66 Potential Profit: 945c per share 8.63% (49.31%)* *17.5%")
48
Unopened Trades: Old Mutual (OML) Instrument: SSF Direction: Sell / Short Entry: 2845c Take Profit: 2660c Stop loss: 2920c Risk/ Reward: 1:2.46 Potential Profit: 185c per share 6.50% (43.35%)
 Instrument: SSF Direction: Sell / Short Entry: 2845c Take Profit: 2660c Stop loss: 2920c Risk/ Reward: 1:2.46 Potential Profit: 185c per share 6.50% (43.35%)")
49
Trade Spotlights: ABIL (ABL)
")
50
Trade Spotlights: Implats (IMP)
")
51
Long-term opportunities The Investor

52
Bi-monthly newsletter One Share Spot Long-term equity investor Positives & Negatives Technical View Recommendation Equity Account 3-year view 15% compounded

53
Methodology Step 1: Click Research Step 2: Click Search PEG ratio (PE%) is less than or equal to 85% Quality rating (%) is greater than 70%
 is less than or equal to 85% Quality rating (%) is greater than 70%")
54
Methodology * * * *

55
Sasol (SOL) Bowcalf (BCF) Sunint (SUI) Hudaco (HDC) WBHO (WBO) The Investor - Share Picks Email Shaunvdb@psgonline.co.za to be added to The Investor mailing listShaunvdb@psgonline.co.za * *
 Bowcalf (BCF) Sunint (SUI) Hudaco (HDC) WBHO (WBO) The Investor - Share Picks to be added to The Investor mailing * *")
56
Sasol (SOL)
")
57
Updated: 12 March 2013 Interim dividend 484.50 cps Payable Monday, 15 April 2013

58
Sasol (SOL) (Weekly)
 (Weekly)")
59
Bowcalf (BCF)
")
60
Results expected: 14 March 2013

61
Bowcalf (BCF) (Weekly)
 (Weekly)")
62
Sunint (SUI)
")
63
Updated: 26 February 2013 Interim dividend 97.11 cps Payable Monday, 25 March 2013

64
Sunnit (SUI) (Weekly)
 (Weekly)")
65
Hudaco (HDC)
")
66
Hudaco (HDC) 8.2.2013
")
67
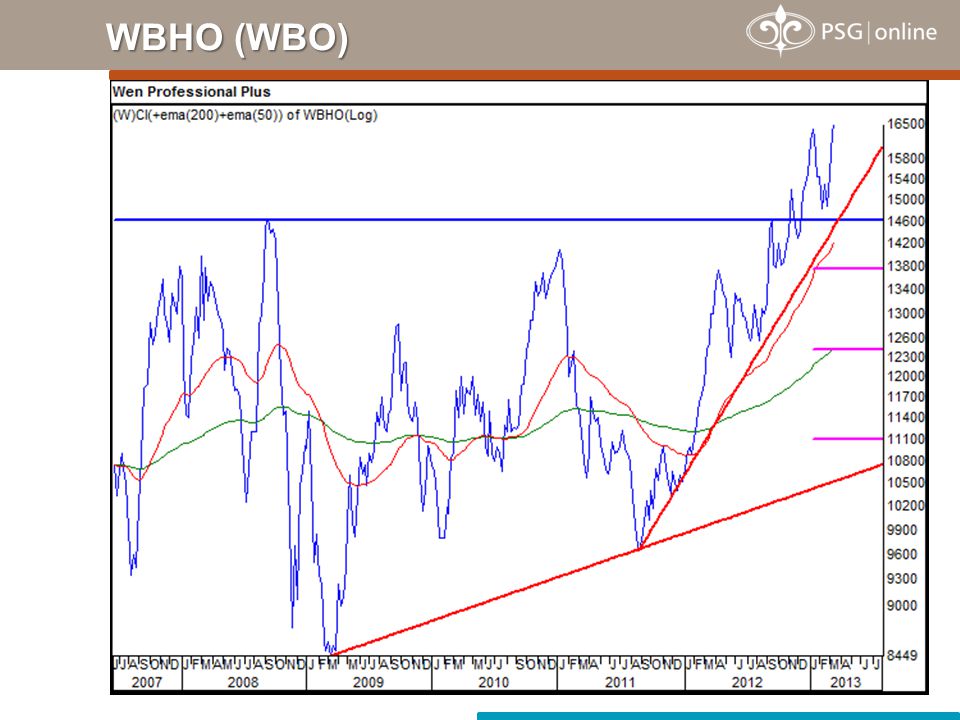
WBHO (WBO)
")
70
Open the Floor

71
Learn to trade Equity Derivatives Webinar (Full) –Date: Thursday, 14 March 2013 –Time: 13:00 14:00 Advanced Technical Analysis (Candlesticks) –Date: Wednesday, 20 March 2013 –Time: 13:00 14:00 Introduction to Exchange Traded Products (ETFs & ETNs) –Date: Wednesday, 10 April 2013 –Time: 13:00 14:00 Introduction to Fundamental Analysis –Date: Wednesday, 24 April 2013 –Time: 13:00 14:00 Upcoming Webinars **Please note: limited to 100 people
 –Date: Thursday, 14 March 2013 –Time: 13:00 14:00 Advanced Technical Analysis (Candlesticks) –Date: Wednesday, 20 March 2013 –Time: 13:00 14:00 Introduction to Exchange Traded Products (ETFs & ETNs) –Date: Wednesday, 10 April 2013 –Time: 13:00 14:00 Introduction to Fundamental Analysis –Date: Wednesday, 24 April 2013 –Time: 13:00 14:00 Upcoming Webinars **Please note: limited to 100 people")
72
Durban –Date: Wednesday, 17 April 2013 –Time: 17:30 for 18:00 until 20:00 Johannesburg –Date: Tuesday, 28 May 2013 –Time: 17:30 for 18:00 until 20:00 Pretoria –Date: Tuesday, 25 June 2013 –Time: 17:30 for 18:00 until 20:00 Johannesburg –Date: Tuesday, 30 July 2013 –Time: 17:30 for 18:00 until 20:00 Cape Town –Date: Wednesday, 21 August 2013 –Time: 17:30 for 18:00 until 20:00 Traders Forum Meetings

73
Presentation link will be emailed Information session –Open a trading account (EQT / SSF & CFD) –Add more funding –Trade & invest Subscribe to tools –The Stockbroker (CFD & SSF traders) –The Investor (Long-term Equity investors) Look out for –Upcoming Webinars (SSF/ CFD & TA) Good Luck & Happy Trading! Summary: The Traders Forum

74
Contact us Thank You Shaun van den Berg Shaunvdb@psgonline.co.za (011) 996 5254
")
75
This publication has been issued by PSG Online. It is confidential and issued for the information of clients only. It shall not be reproduced in whole or in part without our permission. The information contained herein has been obtained from sources which and persons whom we believe to be reliable but is not guaranteed for accuracy, completeness or otherwise. Opinions and estimates constitute our judgement as of the date of this material and are subject to change without notice. Past performance is not indicative of future results. This report is provided for informational purposes only. No information contained herein, no opinion expressed and no recommendation made constitutes a representation by us or a solicitation for the purchase of any of the securities mentioned herein and we have no responsibility whatsoever arising here from or in consequence hereof. Securities, financial instruments or strategies mention herein may not be suitable for all investors and investors must make their own investment decisions using their own independent advisers as they believe necessary and based upon their specific financial situations and investment objectives. The employees of PSG Online may from time to time own securities mentioned herein. Analyst Certification The research analyst who prepared this report certifies that the view expressed herein accurately reflect the research analyst’s personal views about the subject security and issuer and that no part of his compensation was, is or will be directly or indirectly related to specific recommendations or views contained in this report. Disclaimer

Similar presentations