Download presentation
Presentation is loading. Please wait.

1
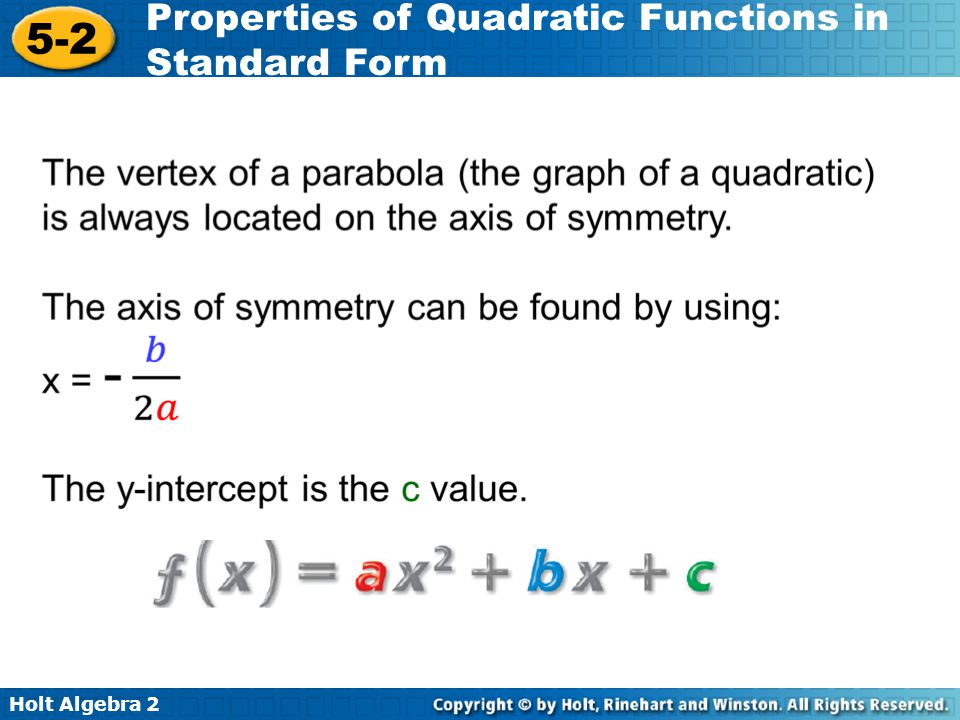
If the leading coefficient of a quadratic equation is positive, then the graph opens upward.
axis of symmetry f(x) = ax2 + bx + c Positive #
 = ax2 + bx + c. Positive #")
2
Label the intercepts, vertex, and axis of symmetry for the graph
If the leading coefficient of a quadratic equation is negative, then the graph opens downward. f(x) = -ax2 + bx + c Negative #
 = -ax2 + bx + c. Negative #")
4
Example 2A: Graphing Quadratic Functions in Standard Form
Consider the function f(x) = 2x2 – 4x + 5. a. Determine whether the graph opens upward or downward. Because a is positive, the parabola opens upward. b. Find the axis of symmetry. The axis of symmetry is given by Substitute –4 for b and 2 for a. The axis of symmetry is the line x = 1.
 = 2x2 – 4x + 5. a. Determine whether the graph opens upward or downward. Because a is positive, the parabola opens upward. b. Find the axis of symmetry. The axis of symmetry is given by . Substitute –4 for b and 2 for a. The axis of symmetry is the line x = 1.")
5
Example 2A: Graphing Quadratic Functions in Standard Form
Consider the function f(x) = 2x2 – 4x + 5. c. Find the vertex. The vertex lies on the axis of symmetry, so the x-coordinate is 1. The y-coordinate is the value of the function at this x-value, or f(1). f(1) = 2(1)2 – 4(1) + 5 = 3 The vertex is (1, 3). d. Find the y-intercept. Because c = 5, the intercept is 5.
 = 2x2 – 4x + 5. c. Find the vertex. The vertex lies on the axis of symmetry, so the x-coordinate is 1. The y-coordinate is the value of the function at this x-value, or f(1). f(1) = 2(1)2 – 4(1) + 5 = 3. The vertex is (1, 3). d. Find the y-intercept. Because c = 5, the intercept is 5.")
6
Example 2A: Graphing Quadratic Functions in Standard Form
Consider the function f(x) = 2x2 – 4x + 5. e. Graph the function. Graph by sketching the axis of symmetry and then plotting the vertex and the intercept point (0, 5). Use the axis of symmetry to find another point on the parabola. Notice that (0, 5) is 1 unit left of the axis of symmetry. The point on the parabola symmetrical to (0, 5) is 1 unit to the right of the axis at (2, 5).
 = 2x2 – 4x + 5. e. Graph the function. Graph by sketching the axis of symmetry and then plotting the vertex and the intercept point (0, 5). Use the axis of symmetry to find another point on the parabola. Notice that (0, 5) is 1 unit left of the axis of symmetry. The point on the parabola symmetrical to (0, 5) is 1 unit to the right of the axis at (2, 5).")
7
Example 2B: Graphing Quadratic Functions in Standard Form
Consider the function f(x) = –x2 – 2x + 3. a. Determine whether the graph opens upward or downward. Because a is negative, the parabola opens downward. b. Find the axis of symmetry. The axis of symmetry is given by Substitute –2 for b and –1 for a. The axis of symmetry is the line x = –1.
 = –x2 – 2x + 3. a. Determine whether the graph opens upward or downward. Because a is negative, the parabola opens downward. b. Find the axis of symmetry. The axis of symmetry is given by . Substitute –2 for b and –1 for a. The axis of symmetry is the line x = –1.")
8
Example 2B: Graphing Quadratic Functions in Standard Form
Consider the function f(x) = –x2 – 2x + 3. c. Find the vertex. The vertex lies on the axis of symmetry, so the x-coordinate is –1. The y-coordinate is the value of the function at this x-value, or f(–1). f(–1) = –(–1)2 – 2(–1) + 3 = 4 The vertex is (–1, 4). d. Find the y-intercept. Because c = 3, the y-intercept is 3.
 = –x2 – 2x + 3. c. Find the vertex. The vertex lies on the axis of symmetry, so the x-coordinate is –1. The y-coordinate is the value of the function at this x-value, or f(–1). f(–1) = –(–1)2 – 2(–1) + 3 = 4. The vertex is (–1, 4). d. Find the y-intercept. Because c = 3, the y-intercept is 3.")
9
Example 2B: Graphing Quadratic Functions in Standard Form
Consider the function f(x) = –x2 – 2x + 3. e. Graph the function. Graph by sketching the axis of symmetry and then plotting the vertex and the intercept point (0, 3). Use the axis of symmetry to find another point on the parabola. Notice that (0, 3) is 1 unit right of the axis of symmetry. The point on the parabola symmetrical to (0, 3) is 1 unit to the left of the axis at (–2, 3).
 = –x2 – 2x + 3. e. Graph the function. Graph by sketching the axis of symmetry and then plotting the vertex and the intercept point (0, 3). Use the axis of symmetry to find another point on the parabola. Notice that (0, 3) is 1 unit right of the axis of symmetry. The point on the parabola symmetrical to (0, 3) is 1 unit to the left of the axis at (–2, 3).")
11
Check It Out! Example 3a Find the minimum or maximum value of f(x) = x2 – 6x + 3. Then state the domain and range of the function. Step 1 Determine whether the function has minimum or maximum value. Because a is positive, the graph opens upward and has a minimum value. Step 2 Find the x-value of the vertex.

12
Check It Out! Example 3a Continued
Find the minimum or maximum value of f(x) = x2 – 6x + 3. Then state the domain and range of the function. Step 3 Then find the y-value of the vertex, f(3) = (3)2 – 6(3) + 3 = –6 The minimum value is –6. The domain is all real numbers, R. The range is all real numbers greater than or equal to –6, or {y|y ≥ –6}.
 = x2 – 6x + 3. Then state the domain and range of the function. Step 3 Then find the y-value of the vertex, f(3) = (3)2 – 6(3) + 3 = –6. The minimum value is –6. The domain is all real numbers, R. The range is all real numbers greater than or equal to –6, or {y|y ≥ –6}.")
13
HW pg. 328 #’s odd, 35, 37, 39, 40

Similar presentations


 = 2(x + 1) 2 – 4 1. f(x) = (x – 2) 2 + 3 3. Give the domain and range of the following.>")


