Download presentation
Presentation is loading. Please wait.

1
Electromagnetic Spectrum

2
Properties of EM Waves EM Waves have frequency, amplitude, wavelength and speed Almost all EM Waves are invisible with the exception of visible light The entire range of EM Waves is called the Electromagnetic Spectrum

3
NASA Introduction Watch this You Tube video from NASANASA

5
EM Spectrum

6
Another EM Diagram

7
Practical Uses of EM Waves Radio Waves Lowest energy and lowest frequency Wavelength ranges of Km down to tens of centimeters Used with communications Microwaves: 30 cm to 1 mm Microwaves transfer energy to water molecules in food Infrared waves: Radiant heat/cannot see it but you can feel it Thermal imaging

8
Practical Uses Continued: Ultraviolet Light: Contained in sunlight Small amounts can be beneficial, larger amounts can cause cancer and sunburns X-Rays: Used exclusively in medicine Bone images absorb the Rays and that is why they appear darker on the image Gamma Rays: Generated in nuclear reactions Very dangerous without protection

9
WAVELENGTH AND FREQUENCY REMEMBER The wavelength of a wave and the frequency of the wave are inversely related; as one increases, the other decreases

10
Speed of Light

12
Light can act like a wave! It can reflect! Reflection = bouncing off

13
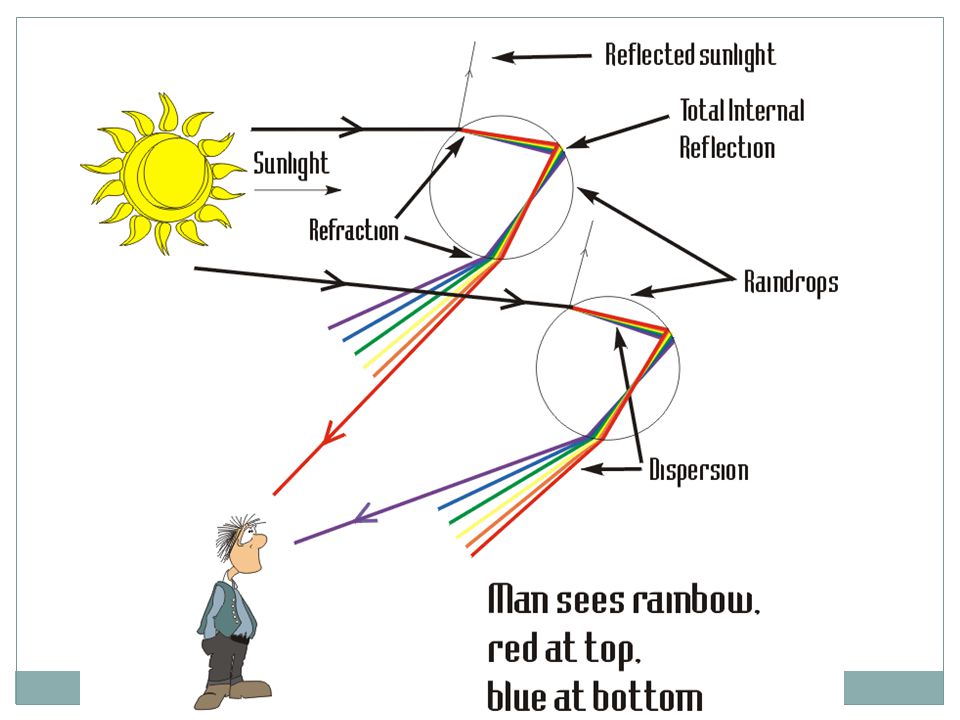
Light can act like a wave! It can refract! Refraction = bending when it passes through

14
Light can act like a wave! It can disperse! Dispersion = separating frequencies of light

16
LIGHT AND THE DOPPLER EFFECT Newton observed the prism effect of light in 1665 In the late 19 th century it was noted that chemicals produce a spectrum when heated

17
LIGHT AND THE DOPPLER EFFECT This led to the discovery of the following… When a light source is moving toward an object the wavelengths appear shorter When a light source is moving away from an object the wavelength appear longer Moving away…light waves shift to RED Moving toward…light waves shift to BLUE This shift in wavelengths is the DOPPLER EFFECT This is strong support for The Big Bang Theory

19
The Red Shift and Blue Shift allow Astronomers to calculate the speed and direction that stars and galaxies are moving.

20
DOPPLER

21
Timeline Project Create a Timeline Poster Start in the 1700’s and progress to present day Identify and explain the relevant space technologies invented Include pictures when possible Complete on paper provided

22
Understanding Space Timeline

23
THE BIG BANG THEORY Observations of RED SHIFT led to the theory of the expanding universe This theory stated that… 17 billion years ago a “Big Bang” sent all the matter and energy outward in a cloud Cloud expanded into clumps Clumps evolved into galaxies Universe is still expanding outward

24
Hubble’s Law Edwin Hubble discovered that most galaxies are moving away from Earth They are also moving away from each other Hubble discovered a relationship and a law was created Hubble’s Law states that the further away the galaxy, the faster it is moving away from us This is strong support for Big Bang

25
STARS AND GALAXIES A star is … A body of gases that gives off a tremendous amount of radiant energy in the form of light and heat Stars vary in size, mass and color

26
STARS/ORION

27
Apparent Magnitude Absolute Magnitude Brightness of a star as it appears from Earth Related to the distance and light emitted Powerful telescopes measure brightness and assign a number True brightness of star if it were 32.6 light years away STELLAR MAGNITUDES

28
CLASSIFICATION OF STARS The Hertzsprung-Russell diagram is a chart that astronomers use to classify stars The chart/graph plots stars’ absolute magnitude and temperature to create a classification system

29
H-R Diagram

30
H-R Diagram Trends The brightness of most stars increases as their surface temperature increases The majority of stars fall within a band called the “Main Sequence” Our sun is a “Main Sequence” star Upper right hand corner of chart has large, bright and cool stars called “Super Giants” Bottom left hand corner has the very small, dim and hot stars called “White Dwarfs”

31
A Star is Born! All Stars begin their lives as part of a NEBULA A NEBULA is a large cloud of gas and dust spread out over a great distance. Gravity causes the cloud to contract and become dense and hot Temperature increases so that nuclear fusion starts at the core and this is the formation of a star

32
You tube video: Life of a StarLife of a Star

33
Life Cycle

34
How Long Does a Star Live? The life span of a star depends on its size The larger stars have a shorter life The smaller stars have a longer life WHY The smaller stars are more efficient in using the fuel that they have

35
The Death of a Star When a star runs out of fuel, its inner core starts to shrink The outer portion of the core starts to expand Once the fuel is gone, the star will become a… White Dwarf A Neutron Star A Black Hole

36
Compare and Contrast the life cycles of the medium mass and large mass stars Remember to discuss similarities and differences

Similar presentations


 Measurement (AU and Light Years) Sun (structure;>")


 Properties of Stars A. A. Color and Temperature 1.A star’s color indicates that temperature of its surface a. a. Hottest stars.>")


