Download presentation
Presentation is loading. Please wait.

1
Defining Land Management in the Wisconsin River Basin Defining Land Management in the Wisconsin River Basin Adam Freihoefer Wisconsin Department of Natural Resources Wisconsin River Water Quality Improvement Symposium February 14, 2014

2
Watershed Stakeholders Engineering News Record September 1993

3
Hydrology Flow accumulation, Internal drainage, groundwater Topography Slope Soils Type and Attributes Climate Precipitation, Temp, etc. Land Management Agriculture, Urban Land Cover Point Sources Landscape Variables Water Quality

4
Phosphorus Load (155 mi 2 )115,000 lbs. Upper Little Eau Pleine River Watershed WY2011
115,000 lbs. Upper Little Eau Pleine River Watershed WY2011")
5
Phosphorus Load (155 mi 2 )115,000 lbs. Point Source Phosphorus Load1,250 lbs. Upper Little Eau Pleine River Watershed Municipal or Industrial Surface Water Effluent WY2011

6
Phosphorus Load (155 mi 2 )115,000 lbs. Point Source Phosphorus Load1,250 lbs. Nonpoint Source Phosphorus Load113,750 lbs. Municipal or Industrial Surface Water Effluent Agriculture Urban Forest Grassland Wetland Upper Little Eau Pleine River Watershed WY2011 An example of a nonpoint source dominated watershed

7
Agriculture Urban Forest Grassland Wetland Upper Little Eau Pleine River Watershed

8
Land CoverPercent Forest35% Wetland27% Agriculture25% Urban / Developed6% Open Water4% Grassland3% Scrubland or Barren, Cranberries < 1% Wisconsin River Basin Land Cover

9
Wisconsin River Basin Agricultural Land Distribution

10
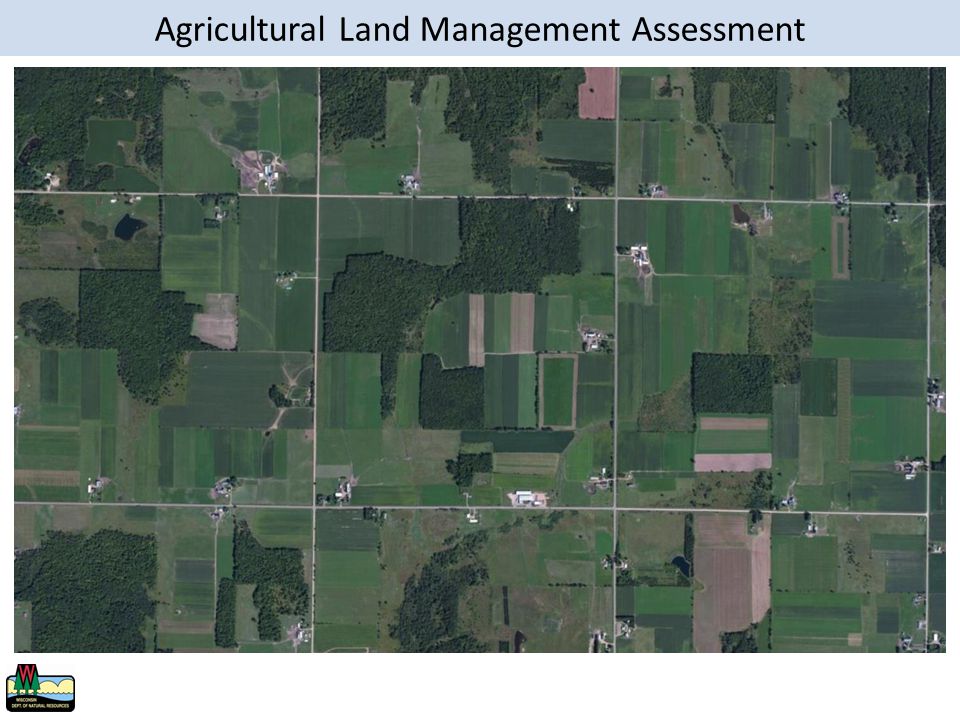
Agricultural Land Management Assessment

13
Continuous Hay / Pasture Corn - Soybean, Disk, Fertilizer 9-23-30 Dairy (C-C-O-A-A-A), Chisel, Fertilizer 9-23-30 Dairy (C-C/S-O-A-A-A), Disk, 5000 kg/ha manure Dairy (C-O-A-A-A), Disk, 300 kg/ha manure / month Agricultural Land Management Assessment
, Chisel, Fertilizer Dairy (C-C/S-O-A-A-A), Disk, 5000 kg/ha manure Dairy (C-O-A-A-A), Disk, 300 kg/ha manure / month Agricultural Land Management Assessment")
14
UW Extension http://fyi.uwex.edu/news/files/2011/03/Tractor_potatoes.jpg Potato Field in Central WI Harvesting Hay in Sauk County UW Extension http://sauk.uwex.edu/files/2012/07/Hay.jpg Spatially identify agricultural crop rotations (crop, tillage, nutrient applications) in support of the Wisconsin River TMDL Installing Tile Drains Near Lodi Cranberry Harvest near Plainfield Agricultural Land Management Assessment
 in support of the Wisconsin River TMDL Installing Tile Drains Near Lodi Cranberry Harvest near Plainfield Agricultural Land Management Assessment")
15
Field-scale Countywide What scale are we working on? Field < Subwatershed < County Generalized crop rotations for county Fairly homogenous management operations No identification of unique landscape issues Barnyards Cattle Crossings Bank erosion sites Nutrient Management Plan Finding a Balance in Data Collection

16
Corn Grain Alfalfa Soybean Potato Crop Rotation Alfalfa Corn Grain Corn Grain Soybean Corn Grain Soybean Corn Grain CarrotsPotato Corn Grain Corn Grain Soybean # cows, application rate Fertilizer Timing Tillage Information Needed for the Agricultural Assessment

18
How did we obtain the information? Step 1 Step 1: Define annual crop change using satellite imagery Step 2 Step 2: Categorize 5-year crop change into rotation types Step 3 Step 3: Assemble local knowledge to further define rotations Step 4 Step 4: Integrate local knowledge to land management layer Step 5 Step 5: Confirm agricultural mgt. with available observed data

19
Using Satellite Imagery to Identify Cropping USDA NASS Cropland Data Layer http://nassgeodata.gmu.edu/CropScape/

20
Using Satellite Imagery to Identify Cropping Yellow = Corn Dark Green = Soybean 2008 Corn

21
Using Satellite Imagery to Identify Cropping Soybean 2009

22
Using Satellite Imagery to Identify Cropping 2010 Corn

23
Using Satellite Imagery to Identify Cropping Corn 2011

24
Using Satellite Imagery to Identify Cropping 2012 Soybean

25
Using Satellite Imagery to Identify Cropping 2012 2011 2010 2009 2008 Corn Soybean Corn Soybean C-C-S-C-C, C-S-C-S-C, S-C-C-S-C, C-C-C-C-S, S-S-S-S-C = Cash Grain

26
Dairy Corn / Soybean / Alfalfa Cash Grain Corn / Soybean Continuous Corn Corn Cranberries Potato / Vegetable Potato w/ Veggie and/or Corn Types of Agriculture in the Wisconsin River Basin

27
Using Local Information to Complete Crop Rotations Does our crop rotation map correctly depict rotations in your county? What is the type and timing of each rotation’s tillage and nutrient applications?

29
Using Local Information to Complete Crop Rotations

30
County-level tillage, fertilizer, manure, & timing information Improved definition of rotations using Satellite Imagery Watershed Model input

31
How do we know our approach is correct? We identified… 121,114 average acres of corn per year in Marathon County 2008 – 2012 The USDA Census identified… 114,643 (± 5%) average acres of corn per year in Marathon County 2008 – 2012 We identified… 28,794 average acres of corn in Adams County between 2008 - 2012 The USDA Census identified… 30,402 (± 5%) average acres of corn in Adams County between 2008 - 2012 Compare our results to observed information including: manure application totals, managed grazed land acreage, farm nutrient management plans, and total acreage for crops
 average acres of corn per year in Marathon County 2008 – 2012 We identified… 28,794 average acres of corn in Adams County between The USDA Census identified… 30,402 (± 5%) average acres of corn in Adams County between Compare our results to observed information including: manure application totals, managed grazed land acreage, farm nutrient management plans, and total acreage for crops.")
32
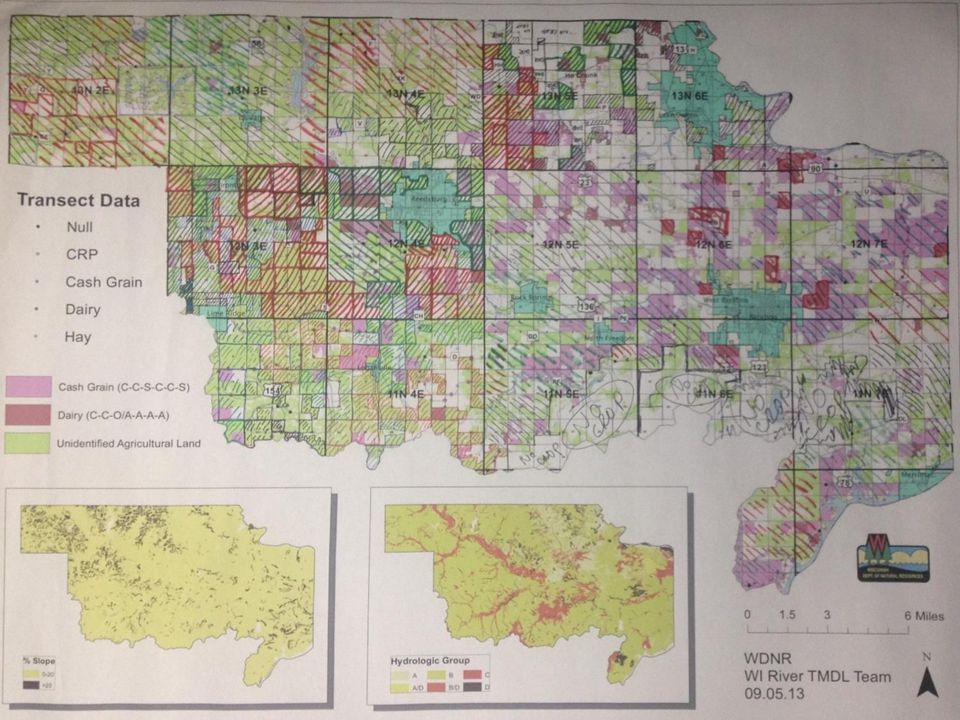
Defined Agricultural Land Management

33
Defined Agricultural Land Management

34
Upper Little Eau Pleine Agricultural Land Management Agriculture Urban Forest Grassland Wetland

35
Upper Little Eau Pleine Agricultural Land Management Agriculture Urban Forest Grassland Wetland Dairy Cash Grain Other

36
dnrwisconsinrivertmdl@wisconsin.gov Questions?

Similar presentations


 Nutrient Management Standard Highlights: NRCS 590 is now only required for producers applying to receive NRCS financial or technical.>")


 Measuring the Environmental Benefits of Conservation Managing the Agricultural Landscape for Environmental.>")


