Download presentation
Presentation is loading. Please wait.

1
U.S. Department of the Interior U.S. Geological Survey UPDATE: A Potential Approach For Assessing the Freshwater/Saltwater Interface (USDW, 10,000 TDS) in the Floridan Aquifer System Lester J. Williams and Rick M. Spechler 2/28/2012
 in the Floridan Aquifer System Lester J. Williams and Rick M. Spechler 2/28/2012.")
2
Problem: No statewide maps available showing the 10,000 mg/L or 35,000 mg/L interface(s) Makes it difficult to assess the regional freshwater flow system and how it interacts with the saline portions of the aquifer Several different methods have been used over the years leading to a disparity between interpretations of it’s position Consistent representation of the interface(s) in local and regional models is important
 Makes it difficult to assess the regional freshwater flow system and how it interacts with the saline portions of the aquifer Several different methods have been used over the years leading to a disparity between interpretations of it’s position Consistent representation of the interface(s) in local and regional models is important")
3
USDW Initiative In Sept 2010 the USGS and FGS presented a proposal to the WMDs to construct a statewide USDW map in but funding was not available to proceed at that time The need for such a map is obvious and would be highly beneficial for ongoing water-resource studies Much of the data needed for this assessment has been already been compiled through the USGS Saline Aquifer Mapping project (L.J. Williams) FGS and USGS have continued to discuss how a state-wide mapping project can be accomplished
 FGS and USGS have continued to discuss how a state-wide mapping project can be accomplished.")
4
Project Objectives and Funding Sources Objective: Produce a state-wide map depicting the position of USDW (10,000 mg/L TDS) in the Floridan aquifer system and cross sections showing the nature of the interface (sharp, diffuse, alternating). Outlet: FGS or USGS map series (within 2-years?) Mapping of other levels (3,000; 5,000 etc.) Funding: USGS cooperative funding matched by other agencies FGS is targeting several federal grants
 Mapping of other levels (3,000; 5,000 etc.) Funding: USGS cooperative funding matched by other agencies FGS is targeting several federal grants.")
5
Presentation Outline Status of current mapping efforts (what has been done thus far) The next step Discuss major tasks that need to be accomplished Other discussions…
 The next step Discuss major tasks that need to be accomplished Other discussions…")
6
Definitions FRESHWATER shall mean any surface or ground waters of the State whose total dissolved solids content is less than 1,000 milligrams per liter. UNDERGROUND SOURCE OF DRINKING WATER (USDW) shall mean an aquifer or its portion: (a) Which supplies any public water system, or (b) Which contains a sufficient quantity of ground water to supply a public water system and: 1. Currently supplies drinking water for human consumption or 2. Contains fewer than 10,000 milligrams per liter total dissolved solids and is not an exempted aquifer. DEP Rules CHAPTER 62C ‑ 25
 shall mean an aquifer or its portion: (a) Which supplies any public water system, or (b) Which contains a sufficient quantity of ground water to supply a public water system and: 1. Currently supplies drinking water for human consumption or 2. Contains fewer than 10,000 milligrams per liter total dissolved solids and is not an exempted aquifer. DEP Rules CHAPTER 62C ‑ 25.")
7
Sources of Data Florida DEP Oil and Gas Program Files Previously published reports Ongoing USGS Regional Studies in the Floridan Aquifer System Well Log analysis Water quality data compilation

8
Florida DEP Oil and Gas Program When drilling an oil test well: (b) Water Quality Analysis. If necessary to determine the depth to the base of the deepest USDW, the Department shall require resistivity and porosity logs be run before setting surface casing and a representative water sample taken immediately after drilling out of the surface casing. DEP Rules CHAPTER 62C ‑ 27

9
Base of Potable Water (250 mg/L) FGS MS-42 Klein, 1971, Revised 1975
 FGS MS-42 Klein, 1971, Revised 1975")
10
Upper Floridan aquifer Conc. Maps OFR 81-1103 PP 1403I Sprinkle, 1981Sprinkle, 1989

11
Ron Reese’s Reports in South Florida From: Water-Resources Investigations Report 98-4253 Hydrogeology and the Distribution of Salinity in the Floridan Aquifer System, Southwestern Florida Prepared in cooperation with the South Florida Water Management District (Reese, 2000) Ron has also mapped the saline water zone (35,000 TDS) Brackish Water Zone Map ~ 10,000 TDS
 Ron has also mapped the saline water zone (35,000 TDS) Brackish Water Zone Map ~ 10,000 TDS")
12
All Wells Ron Analyzed for BWZ and SWZ Map compiled from: Water- Resources Investigations Report 94-4010 (Reese, R.S., 1994) Water-Resources Investigations Report 98-4253 (Reese, R.S., 2000) Water-Resources Investigations Report 03-4242 (Reese, R.S., 2004) Water-Resources Investigations Report 99-4061 (Reese, R.S., and Memberg, S.J., 2000)
 Water-Resources Investigations Report (Reese, R.S., 2000) Water-Resources Investigations Report (Reese, R.S., 2004) Water-Resources Investigations Report (Reese, R.S., and Memberg, S.J., 2000)")
13
South Florida Salinity Maps Emily Richardson SFWMD, Written Commun., 2010 Upper FloridanAvon Park Permeable Zone Lower Floridan

14
St. Johns “CL5K” map 5,000 mg/L chloride Uses water quality data from wells Brian McGurk, SJRWMD

15
Saline Water Aquifer Mapping Project (Ongoing) USGS Groundwater Resources Program (GWRP) Study Began Oct. 2009 Compiling of well-log data (database) Conducting well-log analysis Area being studied is coincident with the Floridan Aquifer System Work is being conducted parallel to the Floridan Aquifer System modeling effort
 Conducting well-log analysis Area being studied is coincident with the Floridan Aquifer System Work is being conducted parallel to the Floridan Aquifer System modeling effort.")
16
Scope of the USGS Saline Aquifer Mapping Project Floridan Aquifer System Base of freshwater system Deep saline zones Coastal Plain System Fresh/Saltwater interface in each major aquifer Lateral continuity of fresh and saline aquifers

17
Status of USGS Log Database In FY2010 we compiled well log data from: 479 wells in FL 13 wells offshore 111 wells in GA Log analysis Status as of Sept. 2010

18
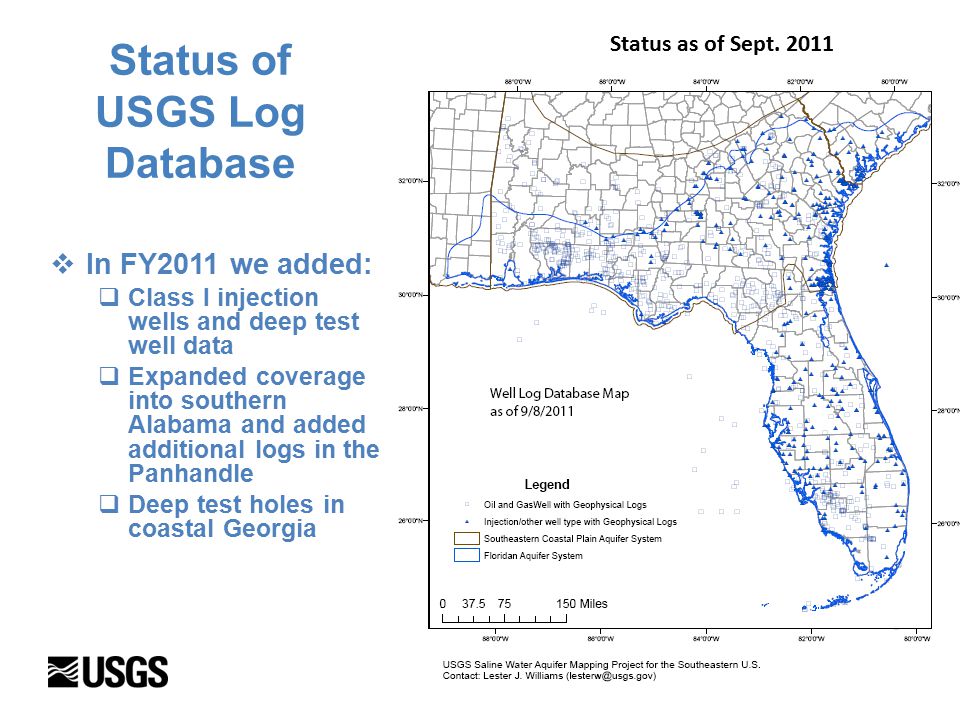
Status of USGS Log Database In FY2011 we added: Class I injection wells and deep test well data Expanded coverage into southern Alabama and added additional logs in the Panhandle Deep test holes in coastal Georgia Status as of Sept. 2011
19
Types of logs pre-1958 (old electric logs) Electrical Surveys “E-Logs” 1960’s-70’s Induction-Electric Logs Post Mid 1970’s Dual Induction Logs (DILL and DISFL) Borehole Compensated Sonic Logs Density (Gamma-Gamma) Logs Neutron Logs
 Electrical Surveys E-Logs 1960’s-70’s Induction-Electric Logs Post Mid 1970’s Dual Induction Logs (DILL and DISFL) Borehole Compensated Sonic Logs Density (Gamma-Gamma) Logs Neutron Logs")
20
Log Database (Neuralog) database images
 database images")
21
Resistivity- Porosity Method Uses resistivity values obtained from induction or e-logs Uses porosity from sonic, density, or neutron log Freshwater Salt Water Transition

22
Approach for assessing the freshwater/saltwater interface Geophysical Logs Locate the interface(s) in a consistent manner using available geophysical logs from: –Oil and gas tests wells –Class I and IV injection wells and test holes –Deep monitoring well clusters Resistivity-Porosity Method Water-Quality Data Confirm interfaces where possible with deep water quality data Water samples collected while drilling samples Packer tests Use water quality to help refine the formation factors being used in the methods
 in a consistent manner using available geophysical logs from: –Oil and gas tests wells –Class I and IV injection wells and test holes –Deep monitoring well clusters Resistivity-Porosity Method Water-Quality Data Confirm interfaces where possible with deep water quality data Water samples collected while drilling samples Packer tests Use water quality to help refine the formation factors being used in the methods")
23
Status in Sept. 2010 Red circles: we have completed an initial analysis Green circles: these are in progress Purple: next Red squares: Ron Reese completed sites Saline Water Aquifer Mapping Project, USGS, GWRP

24
Status as of Sept. 2011 This map shows the sites that have been used to evaluate salinity variations in the lower part of the Floridan Aquifer System Includes both water quality and log-analysis sites Additional sites continue to be added to dataset Saline Water Aquifer Mapping Project, USGS, GWRP ~300 sites in master database

25
Basic Spreadsheet Calculation Deep-reading resistivity, DT, RHOB, or estimated porosity entered into spreadsheet Thermal gradient calculated from BHTs “Salinity zone” depths picked off of graph

26
Salinity Zones Master Database Depths of “salinity zones” recorded in master table Z1 to Z4 Z1 = 3,000 TDS Z2 = 5,000 TDS Z3 = 10,000 TDS Z4 = 32,000 TDS Separate columns are used to calculate altitudes nde = not deep enough BBFAS = estimated depth below bottom of FAS

27
Rough Altitude of 10,000 TDS Produced from initial dataset developed Sept. 2011 Used this to get a rough idea of where the interface was positioned In central highlands and north- central areas the depth of the 10,000 may be near the base of the FAS Much variation in salinity seen with respect to the middle confining units within the main body of the FAS This produces complications moving from the central highlands out to the coastal areas

28
Southwest Florida Much additional water quality data needs to be incorporated in Hillsborough and Pinellas Counties Only a few points have been used along with some older references to map the interface position Salinity inversion observed in areas due to presence of MCUII and highly permeable zones

29
Northeast Florida This area needs a lot of work. See previous map by McGurk and others. We have started to incorporate water quality data

30
Panhandle A lot more data (mostly water quality) exists for the cities along the Gulf Coast but we have not incorporated that yet.
 exists for the cities along the Gulf Coast but we have not incorporated that yet.")
31
The next step Hardening of the interface Water quality data needs to be integrated into the analysis to refine the position estimated using the well logs Iterative process needs to be taken looking at water quality data, going back to the well logs, adjusting a and m parameters, etc., then recalculating salinty profile Salinity Inversions and complicating factors Some of the middle confining units control salinity variations within the main body of the FAS Additional study may be warranted to show these relations Some cross sections would be helpful in certain areas to show this in the report Salinity variations over time The WMD’s, DEP, etc. have compiled a large amount of water quality data that could be used to depict changes over time

32
Major Tasks Log analysis of additional sites (to be done on an as-needed basis) Northeast Florida Gulf Coast Several iterations will be needed to refine position of interface based on all available data – this is a time consuming process but necessary Cross-checking between wells, using deep monitoring well clusters, refining our knowledge of the nature of the interfaces Report
 Northeast Florida Gulf Coast Several iterations will be needed to refine position of interface based on all available data – this is a time consuming process but necessary Cross-checking between wells, using deep monitoring well clusters, refining our knowledge of the nature of the interfaces Report")
33
Contacts: Rick M. Spechler, P.G. Hydrologist U. S. Geological Survey 12703 Research Parkway Orlando, Fl 32826 Phone: (407) 803-5523 email: spechler@usgs.gov Lester J. Williams Hydrologist U.S. Geological Survey 3039 Amwiler Rd, Suite 130 Atlanta, GA 30360 Phone: 404.906.5761 email: lesterw@usgs.gov Andy Smith, P.G. Rodney S. DeHan DVM, Ph.D. Florida Geological Survey Gunter Building, Florida State University Campus Phone: 850-487-9455 Ext. 150 FAX: 850-412-0495 Tallahassee, FL. 32304 E-Mail: andy.smith@dep.state.fl.us rodney.dehan@dep.state.fl.us
 Lester J. Williams Hydrologist U.S. Geological Survey 3039 Amwiler Rd, Suite 130 Atlanta, GA Phone: Andy Smith, P.G. Rodney S. DeHan DVM, Ph.D. Florida Geological Survey Gunter Building, Florida State University Campus Phone: Ext. 150 FAX: Tallahassee, FL")
Similar presentations


Bent Creek Research.>")


