Download presentation
Presentation is loading. Please wait.

1
Clustering and ranking countries and their products: a network analysis Andrea Gabrielli Istituto dei Sistemi Complessi – CNR, Rome (Italy) & IMT - Alti Studi di Lucca (Italy) Email: andrea.gabrielli@roma1.infn.it Collaborators: Luciano Pietronero, Andrea Tacchella Guido Caldarelli, Matthieu Cristelli, Antonio Scala Trento, Italy 23 - 27 July 2012
 & IMT - Alti Studi di Lucca (Italy) Collaborators: Luciano Pietronero, Andrea Tacchella Guido Caldarelli, Matthieu Cristelli, Antonio Scala Trento, Italy July 2012")
2
Standard Economic Theories: Specialization of Countries production (D. Ricardo et al.). Assumption of static equilibrium But observations (see triangular matrix M below) show that diversification is (in general) more important. Globalization: dynamic world, adaptability, evolution, biodiversity. Qualitative Quantitative New Metrics for the competitiveness of Countries and Products Diversification of Countries and Complexity of Products as non monetary metrics to identify the hidden potential for development Database: UN COM.TRADE (1962-2011) New algorithm to identify these metrics in the spirit of the Google page rank problem Excellent performance on model systems and backtests
. Assumption of static equilibrium But observations (see triangular matrix M below) show that diversification is (in general) more important. Globalization: dynamic world, adaptability, evolution, biodiversity. Qualitative Quantitative New Metrics for the competitiveness of Countries and Products Diversification of Countries and Complexity of Products as non monetary metrics to identify the hidden potential for development Database: UN COM.TRADE ( ) New algorithm to identify these metrics in the spirit of the Google page rank problem Excellent performance on model systems and backtests.")
3
Bipartite country-product network (Hidalgo-Hausmann, PNAS, 2009) Weighted matrix
 Weighted matrix")
4
Countries Products If a country is able to make high quality products, it also makes most of the others of lower quality. Diversification is more important than specialization. The “complexity” of a product is not determined by the “richest” producers, but by the “poorest” ones: NON-LINEAR INFORMATION! Triangularity of the M matrix We reorder M for decreasing k c and k p Information from triangularity: “Rich” countries export almost all products; “Poor” countries export only few ubiquitous products; “Complex” products are exported only by diversified countries;

5
Capabilities (Hidalgo-Hausmann, PNAS, 2009) The optimal strategy is not specialization but diversification ( Ecology) Countries tend to accumulate “capabilities”= non-tradable goods and socio-economical non-monetary resources which permit production (e.g. high educational system, natural resourches, good burocracy, technological transfer, infrastructures etc.) From the mix of “old” and “new” capabilities new complex product may appear This explain why rich countries (with many and advanced capabilities) export both complex and simple products The larger is the basket of capabilities the larger is the effect of adding a new advanced capability (combinatorics): NON-LINEAR RELATION NEED OF A NEW METRICS TO QUANTIFY!
 From the mix of old and new capabilities new complex product may appear This explain why rich countries (with many and advanced capabilities) export both complex and simple products The larger is the basket of capabilities the larger is the effect of adding a new advanced capability (combinatorics): NON-LINEAR RELATION NEED OF A NEW METRICS TO QUANTIFY!.")
6
Methods of Reflections (Hidalgo-Hausmann, PNAS, 2009) k c (n) and k p (n) give more an more refined information on the “competitveness” of countries and products k c provides only a “zero order” information on the wealth and competitiveness of the country c. Each product is weighted 1 or 0 independently of its complexity k p provides a zero order measure of the “disquality” of product p New iterative linear algorithm to weight self-consistently

7
The Building Blocks of Economic Complexity (C. Hidalgo, R. Hausmann,PNAS,2009) Starting information Ubiquity of exports Differentiation of exports Differentiated countries export less available products Not differentiated countries export ubiquitous products Odd and even iterations have anticorrelated meanings
 Starting information Ubiquity of exports Differentiation of exports Differentiated countries export less available products Not differentiated countries export ubiquitous products Odd and even iterations have anticorrelated meanings.")
8
Correlation log(GDP)- k c (2n) Once k c (2n) is so renormalized one observes a positive correlations with the log of the GDP per capita WARNING: such a renormalization is Necessary (see next slide) Countries departing from average line are interpreted to converge in some way in the future.
- k c (2n) Once k c (2n) is so renormalized one observes a positive correlations with the log of the GDP per capita WARNING: such a renormalization is Necessary (see next slide) Countries departing from average line are interpreted to converge in some way in the future.")
9
Algebraic analysis of the Method of Reflections (in publ. PlosOne) Even (odd) iterations are a sort of refinement of the previous even (odd) iterations C and P are ergodic Markov matrix (largest eigenvalue 1 =1 and | n |<1) However f (2n) and u (2n) are not Markov chains! C and P operate in the wrong direction
 Even (odd) iterations are a sort of refinement of the previous even (odd) iterations C and P are ergodic Markov matrix (largest eigenvalue 1 =1 and | n |<1) However f (2n) and u (2n) are not Markov chains. C and P operate in the wrong direction.")
10
Algebraic explanation is a measure of the component along c of the second right eigenvector of matrix C : The information in the bipartite graph is averaged and equally redistributed over all the nodes Consequence: f (2n) and u (2n) converge to uniform vectors !!!!! The main right eigenvector (eigenvalue =1) of an E.M.M. is uniform
 of an E.M.M. is uniform.")
11
Weakness of the Methods of Reflections (submitted to PLOSone) Convergence to a uniform fixed point of k c (2n) for all c (fundamental right eigenvector of an ergodic left Markov chain) Odd and even iterations have different meanings Mathematical/economical meaning lost with iterations Need to subtract the mean of k c (2n) to find correlations with log(GDP): second eigenvector of the ergodic Markov matrix Only a small fluctuation of the iterated variables k c (2n) is meaningful: but it is an heuristic algorithm for such empirical variables Transformations are linear while a non-linear relation between fitness of countries and complexity of products is expected: almost extremal feedback is expected from triangularity of M and capability th.!
 Convergence to a uniform fixed point of k c (2n) for all c (fundamental right eigenvector of an ergodic left Markov chain) Odd and even iterations have different meanings Mathematical/economical meaning lost with iterations Need to subtract the mean of k c (2n) to find correlations with log(GDP): second eigenvector of the ergodic Markov matrix Only a small fluctuation of the iterated variables k c (2n) is meaningful: but it is an heuristic algorithm for such empirical variables Transformations are linear while a non-linear relation between fitness of countries and complexity of products is expected: almost extremal feedback is expected from triangularity of M and capability th.!")
13
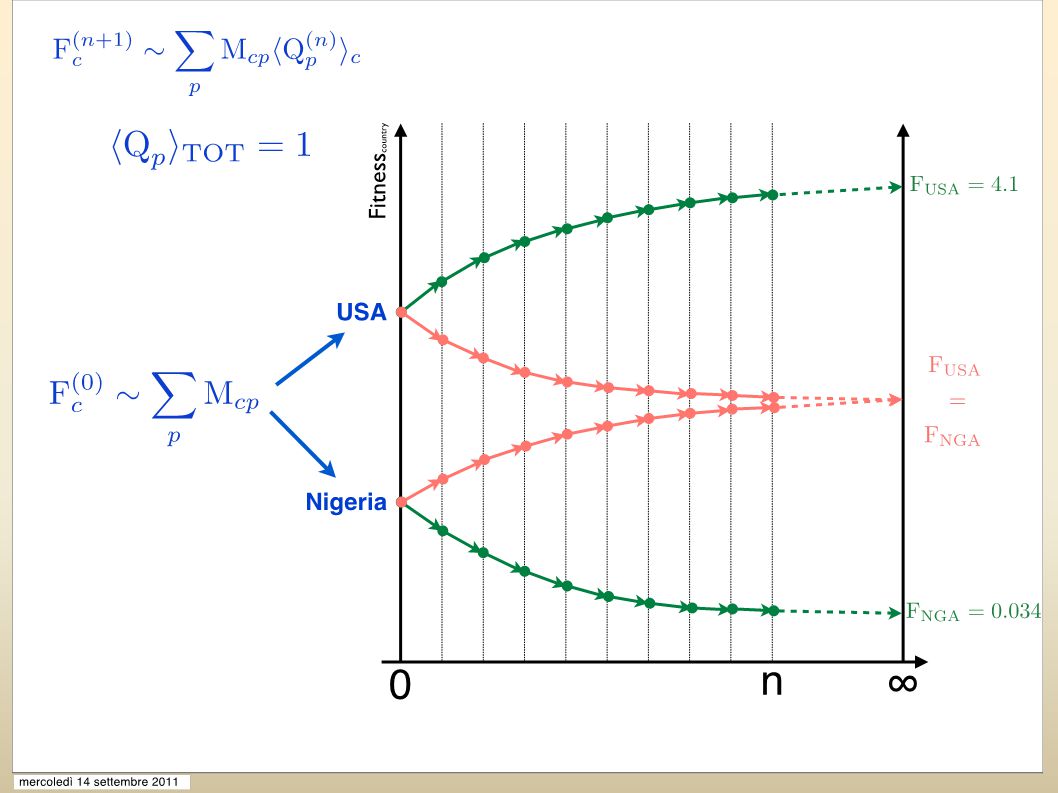
New Approach: Fitness & Quality (in publ., Scientific Reports Nature) High Fitness: a country exporting many products of high quality High Quality: a product which is not exported by any low fitness country Two variables which are improved by iterations, while keeping the same meaning M cp can be taken to be both the binary or the weighted matrix
 High Fitness: a country exporting many products of high quality High Quality: a product which is not exported by any low fitness country Two variables which are improved by iterations, while keeping the same meaning M cp can be taken to be both the binary or the weighted matrix")
14
M cp rerranged for decreasing k c and k p M cp rerranged for decreasing f c * and increasing q p *

15
Comparison with the Method of Reflections Introduce two binary matrices A ck (country-capability) and B kp (capability-product) with random entries A country export a product iif it owns all the capabilities to produce it M cp = k [1- B kp (1-A ck )] We evaluate the correlation respectively between k c (n) and f c (n) and the number of capabilities of c Convergence of all k c compared to the Spread of f c
![Comparison with the Method of Reflections Introduce two binary matrices A ck (country-capability) and B kp (capability-product) with random entries A country export a product iif it owns all the capabilities to produce it M cp = k [1- B kp (1-A ck )] We evaluate the correlation respectively between k c (n) and f c (n) and the number of capabilities of c Convergence of all k c compared to the Spread of f c](http://images.slideplayer.com/13/4167793/slides/slide_15.jpg "Comparison with the Method of Reflections Introduce two binary matrices A ck (country-capability) and B kp (capability-product) with random entries A country export a product iif it owns all the capabilities to produce it M cp = k [1- B kp (1-A ck )] We evaluate the correlation respectively between k c (n) and f c (n) and the number of capabilities of c Convergence of all k c compared to the Spread of f c")
16
Comparison between the new non-linear algorithm and the Method of Reflections: Relative positions of China and Panama

18
Economic evolution: BRIC Countries 4 digits 1160 products

19
FITNESS Absolute value BRIC PIIGS

20
Pareto-Zipf Distributions The binary model correlates with intensive quantities, as Per Capita GDP: it is a measure of efficiency. The weighted model shows a wider distribution and its ranking is close to the GDP ranking.

21
Quality of Products Black: Fitness (Binary) – Red: Fitness (weighted)
 – Red: Fitness (weighted)")
22
1995

23
ECONOMIC DYNAMICS IS HETEROGENEOUS

24
COARSE GRAINED DYNAMICS

25
Capability inspired non-linear algorithm for competitiveness of countries and products Good correlations with GDP and other observables Alternative and more realistic definitions of the variables F and Q Include geographic elements Financial elements (debt, cost of labor) Application to other bipartite networks: Banks, Companies, Providers … Modelization of dynamics for optimal strategies Conclusions
 Application to other bipartite networks: Banks, Companies, Providers … Modelization of dynamics for optimal strategies Conclusions")
Similar presentations


 R. Pastor-Satorras (Barcelona, Spain) A.>")

 We know that every linear transformation T fixes the 0 vector (in R n, fixes the origin). But are there other subspaces.>")


 Definition of moments i-th moment Note that m 1 = Elmore delay when h(t)>")


![How much investment can financial markets cope with? A personal perspective Financial correlations: Why are stocks correlated? [structure/exogenous]](/16/5187461/big_thumb.jpg "How much investment can financial markets cope with? A personal perspective Financial correlations: Why are stocks correlated? [structure/exogenous]>")


