Download presentation
Presentation is loading. Please wait.

1
A study of the relationship between The Southern Resident Killer Whale echolocation click production and depth: A Beam Reach first Anne Harmann 27 October 2007 Beam Reach Marine Science and Sustainability School beamreach.org/071 Salmon!

2
Why Echolocation clicks? The SRKW are listed as an endangered species. prey availability environmental contaminants vessel effects oil spills disease cumulative effects of multiple chronic stressors I wanted to study fish. We only had the equipment to study killer whales.

3
Echolocation Click Production Cranford et al. 1996 Melon Blowhole Phonic Lips A beluga whale (Delphinapterus leucas) Echolocation clicks are typically emitted at a rate that allows the echoes to return to the animal before next click is emitted.
 Echolocation clicks are typically emitted at a rate that allows the echoes to return to the animal before next click is emitted..")
4
Foraging http://www.teara.govt.nz/EarthSeaAndSky/en

5
Foraging http://www.cascadiaresearch.org

6
Foraging www.wildriversoutfitters.com/ rivers.htm

7
My Research Chain of Logic The SRKW forage on fish. These fish swim at various depths in the water column. The SRKW use echolocation clicks to find these fish. So… Is there a relationship between the pattern of SRKW echolocation click production and depth? Remember, this is a novel study. It’s all very simple…

8
Data Collection A B C D E Hph 1 at 5 m Hph 2 at 15 m Hph 3 at 25 m Hph 4 at 35 m Data collected October 7-13, 2007 Positioned ahead of whales when possible Array deployed vertically Minor movements of Gato Verde to maintain vertical orientation Stopped recording if calls or clicks became difficult to hear above background noise A.Starboard hull of GV B.Outrigger C.2 m bungee cord D.Hydrophone array E.12 lb weight attached to rope Diagram not to scale

9
Data Analysis Audacity (Version 1.2.5, Sourceforge.net)
")
10
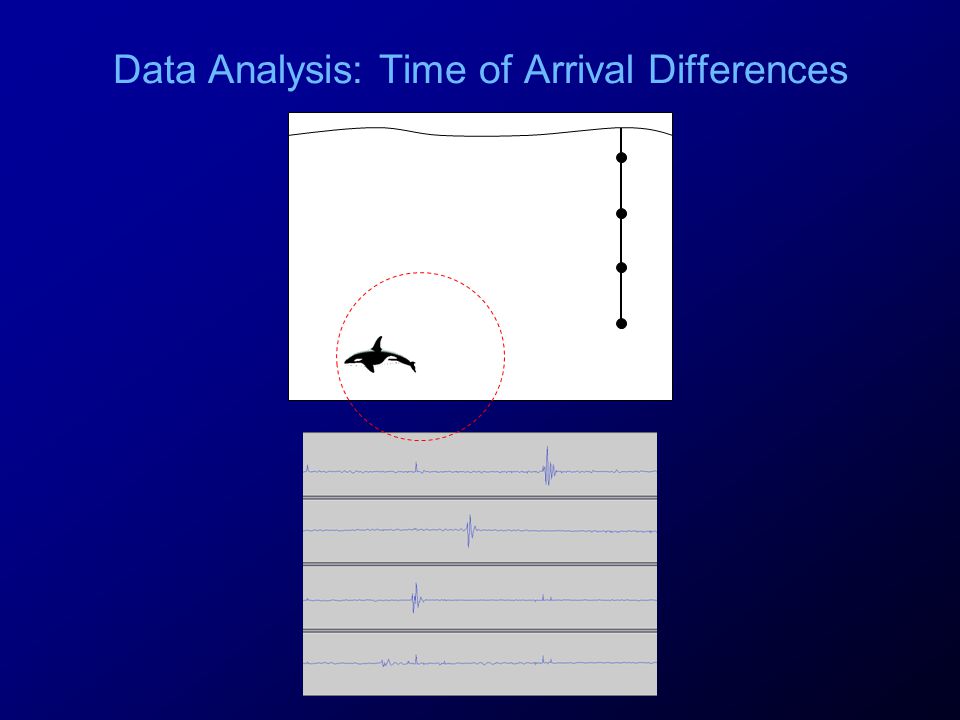
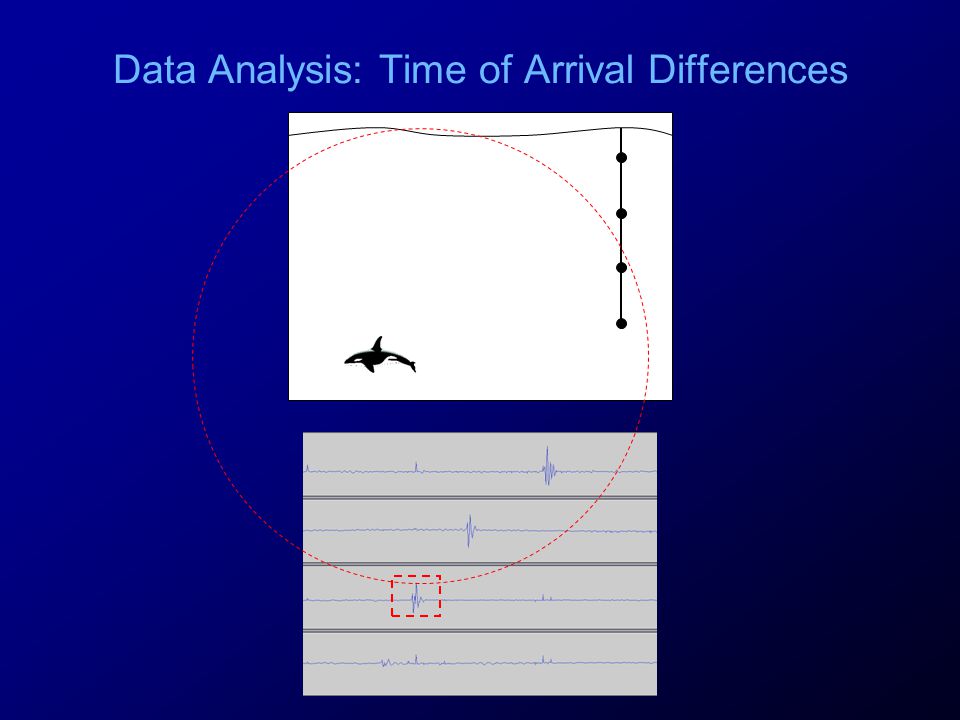
Data Analysis: Time of Arrival Differences

22
Classification of Clicks Shallow Middle Deep 771573 n = 165

23
Foraging Model 1: Repeated Dives for Chinook 5 m 35 m 44.5 m 67.4% 11.2% 21.3% Null hypothesis: Observed distribution of clicks will match distribution predicted by model. Dives made to 44.5 m, average daytime traveling depth for chinook salmon (Candy and Quinn 1999) Swimming at a constant speed Echolocating constantly Diving repeatedly, no lingering at surface or at depth Observed distribution of clicks was significantly different from expected distribution (p <.001, d.f. 2) Null hypothesis: rejected
 Swimming at a constant speed Echolocating constantly Diving repeatedly, no lingering at surface or at depth Observed distribution of clicks was significantly different from expected distribution (p <.001, d.f. 2) Null hypothesis: rejected.")
24
Foraging Model 2: Repeated Deep Dives 35 m 5 m Deep 62.5% Shallow 14.6% Middle 22.9% Null hypothesis: Observed distribution of clicks will match distribution predicted by model. Model based on dive profile from one dive made by L87 (Baird et al. 2003) Echolocating constantly Diving repeatedly No lingering at surface Observed distribution of clicks was significantly different from expected distribution (p <.02, d.f. 2) Null hypothesis: rejected
 Echolocating constantly Diving repeatedly No lingering at surface Observed distribution of clicks was significantly different from expected distribution (p <.02, d.f. 2) Null hypothesis: rejected.")
25
Click Trains and Clicking Rate No significant difference between deep and shallow groups for either click train length or clicking rate SlowFast

26
Clicks with Surface Reflections

27
* ** *

28
Clicks with Surface Reflections D R

29
Summary n= 165 shallow = 77 middle = 15 deep = 73 Do not fit simple dive profile models Array geometry? Directional characteristic of clicks? Deep diving year? Click train length and clicking rate: No significant difference between shallow and deep Foraging at surface for deeper fish? Navigating around boats?

30
Acknowledgements I would like to extend the warmest thank you to Val, Shannon, Todd, Jason, Scott, Team VATO, Team JAMI, Marla Holt, and the good folks at the Whale Museum. This has been an amazing experience. And a special thank you goes to Gilda and Vernon Harmann and to B. Literature Cited Au, W.W.L. 2004. Echolocation signals of wild dolphins. Acoustical Physics, 50:454-462. Au, W.W.L., Ford, J.K.B., Horne, J.K., Newman Allman, K.A. 2004. Echolocation signal of free-ranging killer whales (Orcinus orca) and modeling of foraging for Chinook salmon (Oncorhynchus tshawyscha). Journal of the Acoustical Society of America, 77:726-730. Baird, R.W., Hanson, M.B., Dill, L.M. 2005. Factors influencing the diving behaviour of fish-eating killer whales: sex differences and diel and interannual variation in diving rates. Canadian Journal of Zoology, 83:257-267. Barrett-Lennard, L.G., Ford, J.K.B., Heise, K.A. 1996. The mixed blessing of echolocation: differences in sonar use by fish-eating and mamma-eating killer whales. Animal Behavior, 51:553-565. Candy, J.R. and Quinn, T.P. 1999. Behavior of adult chinook salmon (Oncorhynchus tshawytscha) in British Columbia coastal waters determined from ultrasonic telemetry. Canadian Journal of Zoology, 77(7):1161-1169. Cranford, T.W., Amundin, M., Norris, K.S. 1996. Functional morphology and homology in the odontocete nasal complex: implications for sound generation. Journal of Morphology, 228:223-285. Ford, J.K.B. and Ellis, G.M. 2006. Selective foraging by fish-eating killer whales Orcinus orca in British Columbia. Marine Ecology Progress Series, 316:185-199 Tieman, C.O., Thode, A.M., Straley, J., O’Connell, V., Folkert, K. 2006. Three-dimensional localization of sperm whales using a single hydrophone. Journal of the Acoustical Society of America, 120(4):2355-2365.
 and modeling of foraging for Chinook salmon (Oncorhynchus tshawyscha). Journal of the Acoustical Society of America, 77: Baird, R.W., Hanson, M.B., Dill, L.M Factors influencing the diving behaviour of fish-eating killer whales: sex differences and diel and interannual variation in diving rates. Canadian Journal of Zoology, 83: Barrett-Lennard, L.G., Ford, J.K.B., Heise, K.A The mixed blessing of echolocation: differences in sonar use by fish-eating and mamma-eating killer whales. Animal Behavior, 51: Candy, J.R. and Quinn, T.P Behavior of adult chinook salmon (Oncorhynchus tshawytscha) in British Columbia coastal waters determined from ultrasonic telemetry. Canadian Journal of Zoology, 77(7): Cranford, T.W., Amundin, M., Norris, K.S Functional morphology and homology in the odontocete nasal complex: implications for sound generation. Journal of Morphology, 228: Ford, J.K.B. and Ellis, G.M Selective foraging by fish-eating killer whales Orcinus orca in British Columbia. Marine Ecology Progress Series, 316: Tieman, C.O., Thode, A.M., Straley, J., O’Connell, V., Folkert, K Three-dimensional localization of sperm whales using a single hydrophone. Journal of the Acoustical Society of America, 120(4):")
31
Questions?

32
Overlapping Click Trains

Similar presentations


 + CT scans of a post-mortem and a live dolphins head (Krysl et al., 2008) Make the pair.>")

 in the Salish Sea Heather Hooper Beam Reach.>")


. Human ear The inner ear.>")
 3 types of phonations: Clicks Whistles Pulsed.>")

 –For long (continuous) signals –Average power delivered Peak-to-peak (pp) –Extremely short signals.>")

 of the Pacific Northwest Residents and Transients and Offshores Oh MY! Killer.>")


