Download presentation
Presentation is loading. Please wait.

1
CEE 320 Winter 2006 Traffic Forecasting CEE 320 Steve Muench

2
CEE 320 Winter 2006 Outline 1.Need for Traffic Forecasting 2.Traveler Decisions 3.Trip Generation 4.Mode Choice a.Survey

3
CEE 320 Winter 2006 Need for Traffic Forecasting Impacts of facilities or modes of travel –Lines on existing roads –Roads –Light rail –Bus service Geometric design Pavement design

4
CEE 320 Winter 2006 Traveler Decisions Types of decisions –Time (when do you go?) –Destination (where do you go?) –Mode (how do you get there?) –Route choice (what route do you choose?) Influences –Economic –Social
 –Destination (where do you go ) –Mode (how do you get there ) –Route choice (what route do you choose ) Influences –Economic –Social")
5
CEE 320 Winter 2006 Predicting Travel Decisions Collect data on travel behavior –Observation (number of buses, cars, bikes, etc.) –Surveys Collect data on what travelers have done Collect data on their values and choices (utility) Inexact nature of prediction –Incomplete data –Reporting problems
 –Surveys Collect data on what travelers have done Collect data on their values and choices (utility) Inexact nature of prediction –Incomplete data –Reporting problems")
6
CEE 320 Winter 2006 Trip Generation & Mode Choice

7
CEE 320 Winter 2006 Trip Generation Purpose –Predict how many trips will be made –Predict exactly when a trip will be made Approach –Aggregate decision-making units –Categorized trip types –Aggregate trip times (e.g., AM, PM, rush hour) –Generate Model
 –Generate Model")
8
CEE 320 Winter 2006 Motivations for Making Trips Lifestyle –Residential choice –Work choice –Recreational choice –Kids, marriage –Money Life stage Technology

9
CEE 320 Winter 2006 Reporting of Trips - Issues Under-reporting trivial trips Trip chaining Other reasons (passenger in a car for example)
")
10
CEE 320 Winter 2006 Trip Generation Models Linear (simple) Poisson (a bit better)
 Poisson (a bit better)")
11
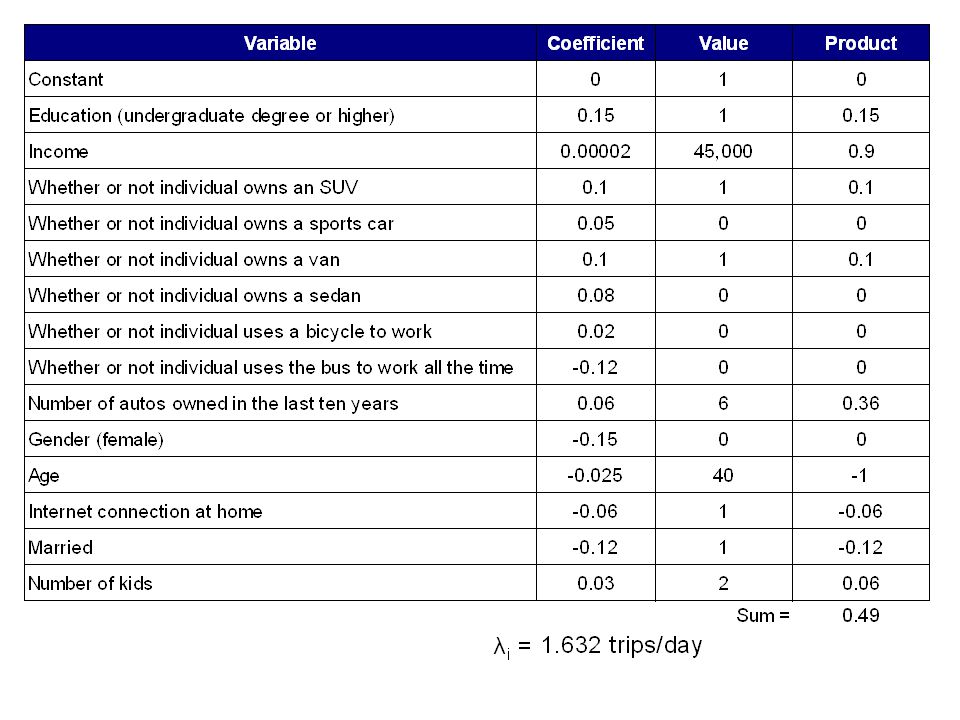
CEE 320 Winter 2006 Example Recreational or pleasure trips measured by λ i (Poisson model):
:")
13
CEE 320 Winter 2006 Example Probability of exactly “n” trips using the Poisson model: Cumulative probability –Probability of one trip or less:P(0) + P(1) = 0.52 –Probability of at least two trips:1 – (P(0) + P(1)) = 0.48 Confidence level –We are 52% confident that no more than one recreational or pleasure trip will be made by the average individual in a day
 + P(1) = 0.52 –Probability of at least two trips:1 – (P(0) + P(1)) = 0.48 Confidence level –We are 52% confident that no more than one recreational or pleasure trip will be made by the average individual in a day")
14
CEE 320 Winter 2006 Mode Choice Purpose –Predict the mode of travel for each trip Approach –Categorized modes (SOV, HOV, bus, bike, etc.) –Generate Model
 –Generate Model")
15
CEE 320 Winter 2006 A Mode Choice Model Logit Model Final form Specifiable partUnspecifiable part s = all available alternatives m = alternative being considered n = traveler characteristic k = traveler

16
CEE 320 Winter 2006 Discrete Choice Example Regarding the TV sitcom Gilligan’s Island, whom do you prefer?

17
CEE 320 Winter 2006 Ginger Model U Ginger = 0.0699728 – 0.82331(carg) + 0.90671(mang) + 0.64341(pierceg) – 1.08095(genxg) carg=Number of working vehicles in household mang=Male indicator (1 if male, 0 if female) pierceg=Pierce Brosnan indicator for question #11 (1 if Brosnan chosen, 0 if not) genxg=generation X indicator (1 if respondent is part of generation X, 0 if not)
 (mang) (pierceg) – (genxg) carg=Number of working vehicles in household mang=Male indicator (1 if male, 0 if female) pierceg=Pierce Brosnan indicator for question #11 (1 if Brosnan chosen, 0 if not) genxg=generation X indicator (1 if respondent is part of generation X, 0 if not)")
18
CEE 320 Winter 2006 Mary Anne Model U Mary Anne = 1.83275 – 0.11039(privatem) – 0.0483453(agem) – 0.85400(sinm) – 0.16781(housem) + 0.67812(seanm) + 0.64508(collegem) – 0.71374(llm) + 0.65457(boomm) privatem=number of years spent in a private school (K – 12) agem=age in years sinm=single marital status indicator (1 if single, 0 if not) housem=number of people in household seanm=Sean Connery indicator for question #11 (1 if Connery chosen, 0 if not) collegem=college education indicator (1 if college degree, 0 if not) llm=long & luxurious hair indicator for question #7 (1 if long, 0 if not) boomm=baby boom indicator (1 if respondent is a baby boomer, 0 if not)
 – (agem) – (sinm) – (housem) (seanm) (collegem) – (llm) (boomm) privatem=number of years spent in a private school (K – 12) agem=age in years sinm=single marital status indicator (1 if single, 0 if not) housem=number of people in household seanm=Sean Connery indicator for question #11 (1 if Connery chosen, 0 if not) collegem=college education indicator (1 if college degree, 0 if not) llm=long & luxurious hair indicator for question #7 (1 if long, 0 if not) boomm=baby boom indicator (1 if respondent is a baby boomer, 0 if not)")
19
CEE 320 Winter 2006 No Preference Model U no preference = – 9.02430x10⁻⁶(incn) – 0.53362(gunsn) + 1.13655(nojames) + 0.66619(cafn) + 0.96145(ohairn) incn=household income gunsn=gun ownership indicator (1 if any guns owned, 0 if no guns owned) nojames=No preference indicator for question #11 (1 if no preference, 0 if preference for a particular Bond) cafn=Caffeinated drink indicator for question #5 (1 if tea/coffee/soft drink, 0 if any other) ohairn=Other hair style indicator for question #7 (1 if other style indicated, 0 if any style indicated)
 – (gunsn) (nojames) (cafn) (ohairn) incn=household income gunsn=gun ownership indicator (1 if any guns owned, 0 if no guns owned) nojames=No preference indicator for question #11 (1 if no preference, 0 if preference for a particular Bond) cafn=Caffeinated drink indicator for question #5 (1 if tea/coffee/soft drink, 0 if any other) ohairn=Other hair style indicator for question #7 (1 if other style indicated, 0 if any style indicated)")
20
CEE 320 Winter 2006 Results Average probabilities of selection for each choice are shown in yellow. These average percentages were converted to a hypothetical number of respondents out of a total of 207.

21
CEE 320 Winter 2006 My Results U ginger =– 1.1075 U mary anne =– 0.2636 U no preference =– 0.3265

22
CEE 320 Winter 2006 Primary References Mannering, F.L.; Kilareski, W.P. and Washburn, S.S. (2005). Principles of Highway Engineering and Traffic Analysis, Third Edition. Chapter 8 Transportation Research Board. (2000). Highway Capacity Manual 2000. National Research Council, Washington, D.C.
. Principles of Highway Engineering and Traffic Analysis, Third Edition. Chapter 8 Transportation Research Board. (2000). Highway Capacity Manual National Research Council, Washington, D.C..")
Similar presentations


>")

