Download presentation
Presentation is loading. Please wait.

1
The European Forum for GeoStatistics and the next step towards an infrastructure of spatial data for sustainable development in Europe Lars H. Backer lars.backer@scb.se lars.backer@scb.se Statistics Sweden Nordic forum for GeoStatistics European forum for GeoStatistics European GridClub

2
INSPIRE Promise “INSPIRE is a directive proposed by the European Commission in July 2004 setting the legal framework for the establishment and operation of an infrastructure for Spatial Information in the European community. The purpose of such infrastructure is to support the formulation, implementation, monitoring activities and evaluation of Community policies and activities that may have a direct impact on the environment at various levels of public authority, European national and local.” (INSPIRE Drafting Team "Data Specifications" 2007 )
.")
4
Indicator (indicator of State?) Microwave data from the Special Sensor Microwave Imaging radiometer was used to create this image of the 2007 Greenland melting anomaly which reflects the difference between the number of melting days occurring in 2007 and the average number of melting days during the period 1988 – 2006. Credit: NASA/Earth Observatory Marco Tedesco, a research scientist at the Joint Center for Earth Systems Technology, cooperatively managed by NASA's Goddard Space Flight Center in Greenbelt, Md., and the University of Maryland at Baltimore County, used satellite data to compare average snow melting from 1988-2006 with what has taken place this summer. He found that in high altitude areas over 1.2 miles above sea level, the melting index -- an indicator of where melting is occurring and for how long - was significantly higher than average. Melting over those areas occurred 25-30 days longer this year than the observed average in the previous 19 years.

5
Global effect (Indicator of Pressure?) Warm ocean waters fuel hurricanes Warm ocean waters fuel hurricanes, and there was plenty of warm water for Hurricane Katrina to build up strength once she crossed over Florida and moved into the Gulf of Mexico. This image depicts a 3-day average of actual sea surface temperatures for the Caribbean Sea and the Atlantic Ocean, from August 25-27, 2005. Every area in yellow, orange or red represents 82 degrees Fahrenheit or above. The data came from the Advanced Microwave Scanning Radiometer (AMSR-E) instrument on NASA's Aqua Http://science.hq.nasa.gov/earth- sun/missions/satellite_17.htm Http://science.hq.nasa.gov/earth- sun/missions/satellite_17.htm
 instrument on NASA s Aqua sun/missions/satellite_17.htm sun/missions/satellite_17.htm.")
6
Disappointments? 1.Dilemma 1: What it is about An infrastructure for Spatial Information, 2.Dilemma 2: The method - to support the formulation, implementation, monitoring activities and evaluation of Community policies and activities 3.Dilemma 3: The contents - that may have a direct impact on the environment 4.Dilemma 4: The user community - at various levels of public authority, European national and local.”

7
Main project: Information for sustainable development Focus on the needs of public authorities “Real User Needs” both monitoring & reporting and formulation & implementation of Policies, programs, plans and projects for sustainable development

8
The challenge 1.Integrated definition of spatial data Solve the “Spatial data” dilemma in favour of a solution that stresses the importance of integrating geography and statistics. 2.Serve public authority needs Information system in response to “Public authority” needs for qualified information systems. 3.Adress the environmental challenge Respond to the need for qualified information systems needed to meet the environmental challenge.

9
Method 1.System delineation and analysis 2.Build semantic model 3.Drop relations, use concept catalogues 4.Transform concepts to objects 5.Model objects with attributes –Concept + Statistics –Concept + Features –(Concept + Method if available) 6.Integrate statistics, feature & method (GIS) 7.Compile model
 6.Integrate statistics, feature & method (GIS) 7.Compile model")
10
Model

11
Objects Statistical Object: 1. NSI objects) –Name, Class (Semantic concept) –Description –Properties (Statistics) –Attributes Attributes 2: Properties Attributes 1: Feature (if needed) –Statistics metadata –Methods (dynamics) Spatial Object: 2. NMA objects –Name, Class (Semantic concept) –Feature (Geometrics) –Attributes Attributes 1: Feature Attributes 2: Properties (If needed) –Feature metadata –Methods (dynamics) Integrated Objects: 3. GridClub (NSI + NMA) objects –Name, Class (Semantic concept) –Attributes 1: Properties (Statistics) Dataset Metadata for Statistics Methods for statistics Descriptions –Attributes 2: Features (Space) Dataaset Metadata for features Methods for features Descriptions –Methods for integrated object –Description
 –Name, Class (Semantic concept) –Description –Properties (Statistics) –Attributes Attributes 2: Properties Attributes 1: Feature (if needed) –Statistics metadata –Methods (dynamics) Spatial Object: 2. NMA objects –Name, Class (Semantic concept) –Feature (Geometrics) –Attributes Attributes 1: Feature Attributes 2: Properties (If needed) –Feature metadata –Methods (dynamics) Integrated Objects: 3. GridClub (NSI + NMA) objects –Name, Class (Semantic concept) –Attributes 1: Properties (Statistics) Dataset Metadata for Statistics Methods for statistics Descriptions –Attributes 2: Features (Space) Dataaset Metadata for features Methods for features Descriptions –Methods for integrated object –Description.")
12
Statistics

13
Space

14
Time

15
Subproject 1: Cooperation with user communities Focus on the needs of public authorities “Real User Needs” both monitoring & reporting and formulation & implementation of Policies, programs, plans and projects for sustainable development

17
Local cause (Indicator of Driving forces?) www.lightpollution.it/dmsp/artbri.html P. Cinzano, F. Falchi (Padua University) and C.D. Elvidge (NOAA Boulder Co, USA) (Radiance-calibrated high resolution DMSP sattelite data, compared with US Department of energy population density database)
 and C.D. Elvidge (NOAA Boulder Co, USA) (Radiance-calibrated high resolution DMSP sattelite data, compared with US Department of energy population density database).")
18
Environment - Society Environment (Natural and Artificial Environment) Society (Sociocultural and Economic systems)
 Society (Sociocultural and Economic systems)")
19
Modelling society A city is not a tree……….

20
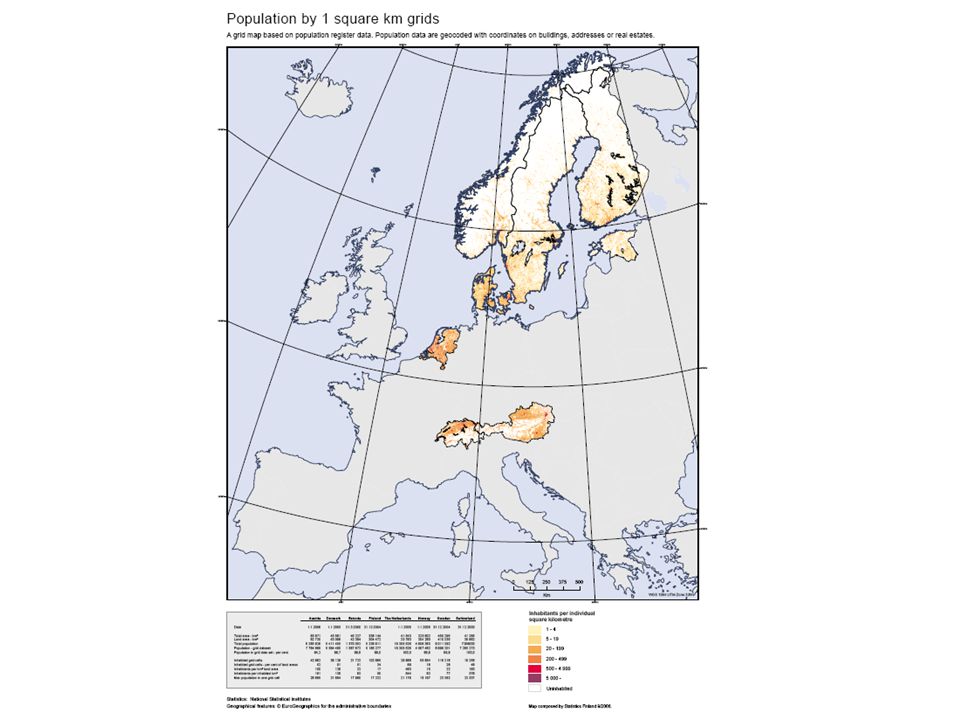
Subproject 2: GeoStatistics for Europe A harmonised foundation for GeoStatistics in Europe (point data or “Grids” or “Blobs” in the scale of 100m2) Socioeconomic GridMap for Europe
 Socioeconomic GridMap for Europe")
24
Subproject 3: A webb portal A Webb portal with WMS and WSS Communication between data producers and data user communities

25
Geografier

26
Contents Webb pages, background information –Introductions –Explanations –Demonstrations Integrated WSS & WMS services –Metadata and search engines to integrated map- statistics data themes –Access to integrated map- statistics data themes WSS (Webb statistical services) –Metadata search engines for Statistics (Yet to be harmonized?) –Access to Statistics (Yet to be developed?) WMS (Webb map service) –Metadata search engines for Cartographies –Access to geographic information Two way communication –Data users to / from Data providers
 –Metadata search engines for Statistics (Yet to be harmonized ) –Access to Statistics (Yet to be developed ) WMS (Webb map service) –Metadata search engines for Cartographies –Access to geographic information Two way communication –Data users to / from Data providers")
27
Subproject 4: A Network of excellence The European Forum for GeoStatistics Direct cooperation with Eurostat and JRC (Ispra) Yearly conferences.
 Yearly conferences.")
28
A Network of Excellence

29
Conclusions 1.The next step 1.Our primary obligation is to public authorities, not the market! 2.We should take the environmental challenge seriously! (If we cannot describe it, we cannot control it! ) 3.We need integrated spatial- temporal descriptions of whole man- environmental systems! 4.We need to agree on a common understanding about key concept like “spatial information” and how to model them 2.A Project for the integration of geography and statistics 1.A case study with environmental content (SP 1) 2.An Extension of the SDI infrastructure for geography and statistics (SP 2) 3.A network of excellence to support a distributed solution also for statistics. (SP 3) 4.A concept for an integrated set of webb services for maps + statistics (SP 4) 3.Shared responsibility 1.Eurostat should be the leading partner responsible for the shared infrastructure for both geography and statistics 2.Joint support from both NSI’s and MNA’s for data and distributed services
 3.We need integrated spatial- temporal descriptions of whole man- environmental systems. 4.We need to agree on a common understanding about key concept like spatial information and how to model them 2.A Project for the integration of geography and statistics 1.A case study with environmental content (SP 1) 2.An Extension of the SDI infrastructure for geography and statistics (SP 2) 3.A network of excellence to support a distributed solution also for statistics. (SP 3) 4.A concept for an integrated set of webb services for maps + statistics (SP 4) 3.Shared responsibility 1.Eurostat should be the leading partner responsible for the shared infrastructure for both geography and statistics 2.Joint support from both NSI’s and MNA’s for data and distributed services.")
30
Thank you! lars.backer@scb.se

Similar presentations


 Lars H. Backer>")
>")
 Project Integration with INSPIRE (ESDI) Lars H. Backer Statistics Sweden and the Tandem consortium.>")


>")