Download presentation
Presentation is loading. Please wait.

1
Micromodel in Porous Flow

2
WHO ARE WE? Prof. Laura Pyrak-Nolte, Purdue University James McClure Ph.D. Student, North Carolina University Mark Porter Ph.D. Student, Oregon State University Hongkyu Yoon Research Scientist, University of Illinois at Urbana-Champaign Fatmir Likrama Ph.D. Student, University of Texas Austin Burcu Uyusur Ph.D. Student, University of Illinois at Chicago Shivam Tripathi Ph.D. Student, Purdue University Wenhao Wang Ph.D. Student, University of Texas at Austin

3
Outline Introduction Experiment Image Analysis Numerical Model Conclusion& Suggestions

4
Microscale Multiphase Physics Pc = Pn – Pw

5
Three phase (wns) systems (2002)
 systems (2002)")
6
Capillary pressure-Saturation- Interfacial Area (P c -S-IAV) relation Traditional closure relationship assumes capillary pressure is a function of saturation alone, leading to the hysteretic moisture function Held and Celia (2001)
 relation Traditional closure relationship assumes capillary pressure is a function of saturation alone, leading to the hysteretic moisture function Held and Celia (2001)")
7
Hysteresis Contact Angle Hysteresis between drainage and imbibition Snap-off of nonwetting phase during imbibition Influence of local fluid configuration on pore-filling during imbibition

8
OVERVIEW OF EXPERIMENT Photo projection lithography Displacement measurements Image Analysis

9
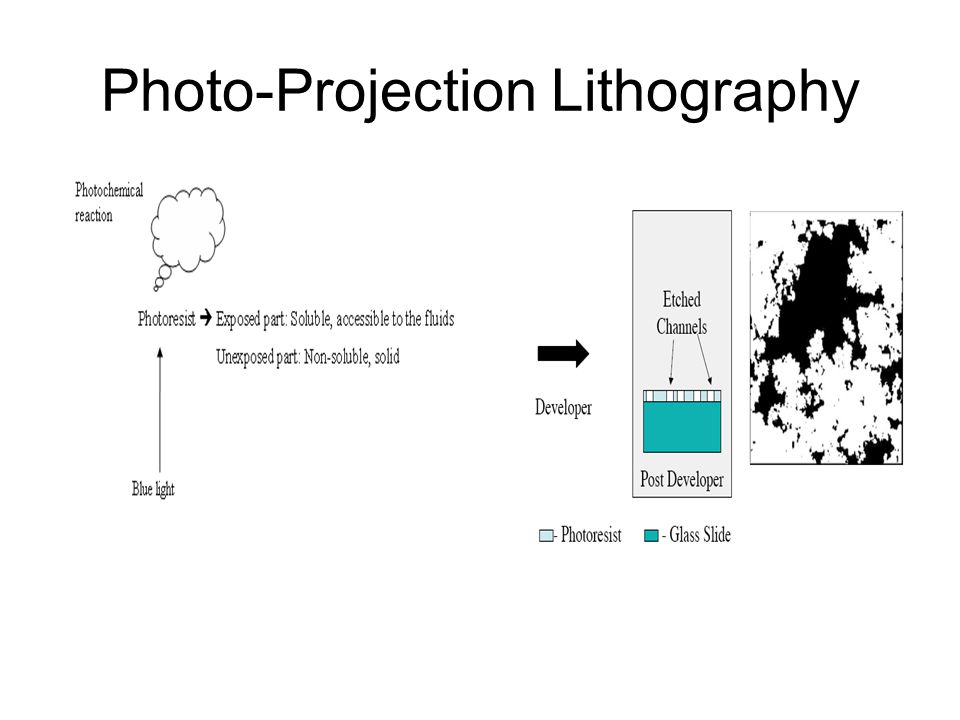
Sample Preparation Photo-Projection Lithography Thin (1.08 microns), transparent photo- sensitive polymer (photoresist)
, transparent photo- sensitive polymer (photoresist)")
10
Photo-Projection Lithography

12
Experimental Set-up Two pressure sensors to monitor input and output pressures A video camera interfaced to an optical microscope to image the two phase displacement experiments.

13
Displacement Measurements 1-Initial saturation with decane (wetting phase) through outlet 2- Introduction of nitrogen (non-wetting phase) through inlet by pressure 3- After each pressure increment the system was allowed to equilibriate 4-Before nitrogen breakthrough, the pressure was reduced stepwise to retreat nitrogen from the system
 through outlet 2- Introduction of nitrogen (non-wetting phase) through inlet by pressure 3- After each pressure increment the system was allowed to equilibriate 4-Before nitrogen breakthrough, the pressure was reduced stepwise to retreat nitrogen from the system")
14
Image Analysis

15
Functional relationship between Capillary Pressure, Saturation and Interfacial Area In the context of Micro Model Data 1. Does there exist such a relationship? 2. Is it unique i.e. a.Same for Drainage and Imbibition ? b.Can it explain both primary and scanning curves? 3. What is its nature (complex or simple) ? 4. Is it complete?
 . 4. Is it complete .")
16
Analytic model for soil characteristic curve van Genuchten Model

18
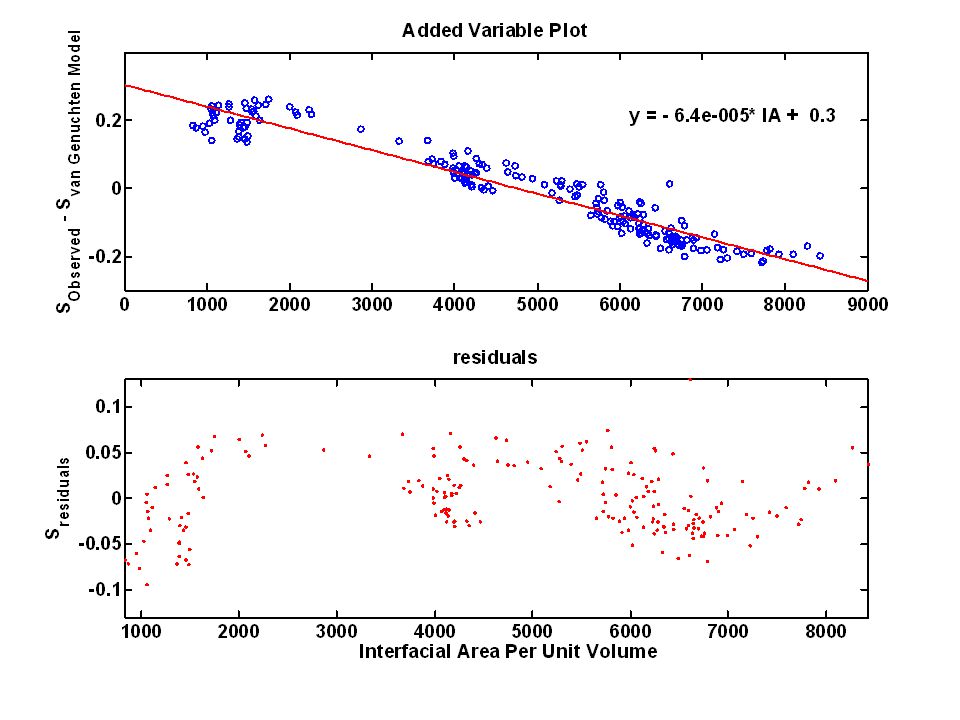
Assumption 1.Analytical form of van Genuchten Model holds for both primary and scanning curves with one set of parameters. 2.What it needs is an additional variable. Added Variable Plot Residuals from existing model New Variable

20
o Drainage Wetting Fluid Saturation Interfacial Area Per Unit Volume : (log transformed) Capillary Pressure
 Capillary Pressure")
21
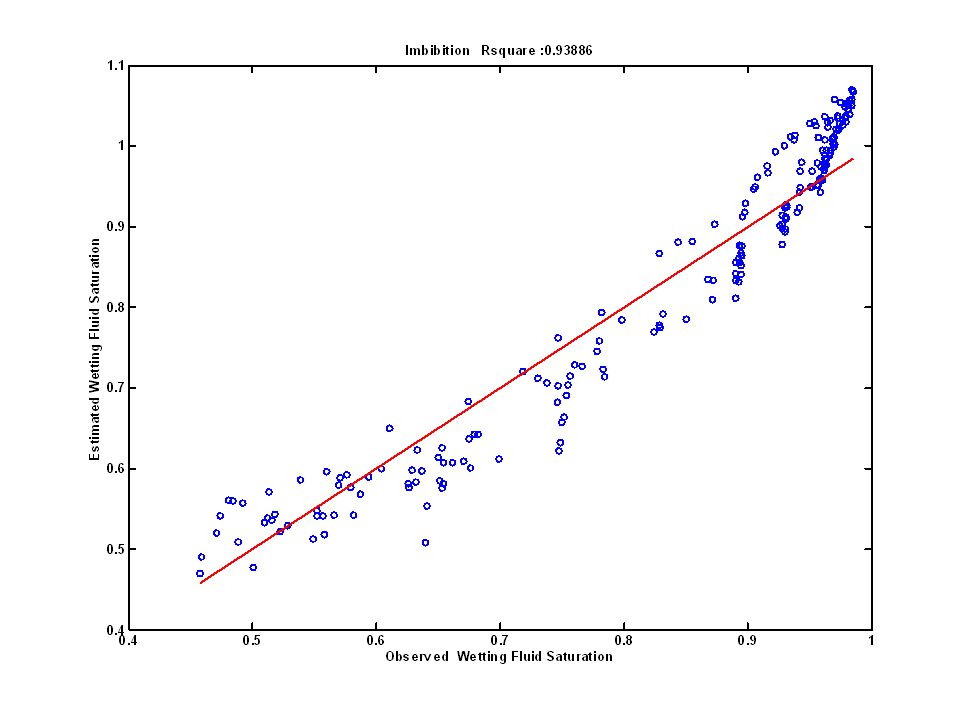
* Imbibition o Drainage Wetting Fluid Saturation Interfacial Area Per Unit Volume : (log transformed) Capillary Pressure
 Capillary Pressure")
23
Interfacial Area Approach Compute each interface within grid cubes (as in the Marching Cubes) Component interfaces extracted from isosurfaces using two data sets
 Component interfaces extracted from isosurfaces using two data sets")
24
Mask

25
Two Phase Data

26
Result:

27
Key Issues: Interfaces run parallel to each other Mesh alignment –makes it difficult to distinguish between wn, ws interfaces –may be more accurate to compute interfaces in a different way Isovalue determination

28
Quantification of Pore Space Extract information from the mask which allows to access information needed to construct a network model –Connectivity –Location of pores and throats –Size of Pores and throats

29
Quantification of Pore Space Compute the solid surface using the MC algorithm Evaluate the signed distance function - local maxima correspond to pores

30
Gradient of Signed Distance Function

31
Obtain Relative Maxima Use signed distance function and its gradient to compute partial Hermite polynomial as a local approximation Newton’s Method to search for maxima

32
Relative Maxima

33
The Long Road Ahead Use local maxima to construct skeleton graph Topological characterization of the pore space Network model implementation and comparison with experimental results

34
Invasion Percolation Model Pore radii generated randomly for each lattice site. No information about the pore geometry. Could use statistical representation of pores (i.e.pore size distribution, connectivity, etc…). Relatively easy to code (20 lines or so). Can extract useful information without detailed knowledge of pore geometry (power law behavior, fractals, etc…)
. Relatively easy to code (20 lines or so). Can extract useful information without detailed knowledge of pore geometry (power law behavior, fractals, etc…).")
35
Capillary Pressure Vs. Saturation

36
Network Modeling Construct “simple” rules for flow through pore bodies and throats. –Laplace’s Law. –Contact angle considerations. –Need detailed information about pore space. –Construct “

37
My Too Weak Model Euclidian distance from solid to estimate pore body radii. Use circles to fill pore bodies. Need more information about the throats (namely throat width). Medial Axis (skeleton of the pore space) could provide this data.
. Medial Axis (skeleton of the pore space) could provide this data..")
38
Too Weak Model Start movie now!

39
Experiment Results Too Weak model Results

40
Conclusions, Open Questions and Future Suggestions Imbibition No Snap off? etc

Similar presentations