Download presentation
Presentation is loading. Please wait.

1
Advancing Our Understanding of Glycemic Control: Refocusing on Glucose Regulation in Type 2 Diabetes
Joe L Reese, M.D. Advancing Our Understanding of Glycemic Control: Refocusing on Glucose Regulation in Type 2 Diabetes

2
Learning Objectives Describe the multiple factors involved in the pathogenesis of type 2 diabetes and explain their contribution over time. Explain the role of incretin hormones in maintaining normal glucose homeostasis. Discuss clinical challenges and guideline recommendations for getting patients to goal. Describe the efficacy, safety/tolerability profile, and place in therapy for sitagliptin in patients with type 2 diabetes. Learning Objectives Welcome to this presentation, entitled Advancing Our Understanding of Glycemic Control: Refocusing on Glucose Regulation in Type 2 Diabetes. During this slide presentation, we will complete the following 4 learning objectives: Describe the multiple factors involved in the pathogenesis of type 2 diabetes and explain their contribution over time. Explain the role of incretin hormones in maintaining normal glucose homeostasis. Discuss clinical challenges and guideline recommendations for getting patients to goal. Describe the efficacy, safety/tolerability profile, and place in therapy for sitagliptin in patients with type 2 diabetes.

3
Type 2 Diabetes: Refocusing Priorities
Diabetes: a multifactorial disease Impairment of insulin secretion coupled with unsuppressed glucagon release Impairment of insulin action (ie, insulin resistance) Pancreatic islet- (alpha- and beta-) cell dysfunction: a central factor in the development of hyperglycemia and progression of type 2 diabetes Major defect in insulin resistance already present at onset of diabetes Type 2 Diabetes: Refocusing Priorities Type 2 diabetes is a multifactorial disease that affects several feedback mechanisms involving insulin and glucagon, which affect the regulation of glucose homeostasis.1,2 In the normal physiologic state, pancreatic beta cells normally increase insulin secretion to compensate for insulin resistance. However, in patients with type 2 diabetes, impaired beta-cell function is associated with insufficient insulin secretion, leading to the development of hyperglycemia.1 By the time diabetes is diagnosed, beta-cell function has already declined considerably, and it continues to decline over time.1 Pancreatic alpha-cell dysfunction contributes an excessive release of glucagon, leading to hepatic glucose overproduction.1 With impaired insulin secretion, an imbalance between insulin and glucagon can develop.1,2 With decreased insulin secretion, glucose uptake by muscle and adipose tissue is decreased.2 Unsuppressed glucagon levels lead to hepatic glucose overproduction and an increase in blood glucose.1 Purpose To examine the multifactorial aspects of type 2 diabetes. Takeaway Insulin resistance is present when diabetes is diagnosed. Beta-cell dysfunction and alpha-cell dysfunction (ie, elevated hepatic glucose production) are also critical factors in the development of hyperglycemia. Progressively reduced insulin secretion from beta cells, contributing to hepatic glucose overproduction Excess glucagon release from alpha cells, leading to hepatic glucose overproduction 1. Del Prato S et al. Horm Metab Res ;36:775–781. 2. Porte D et al. Clin Invest Med. 1995;18:247–254. References 1. Del Prato S, Marchetti P. Beta- and alpha-cell dysfunction in type 2 diabetes. Horm Metab Res ;36:775–781. 2. Porte D Jr, Kahn SE. The key role of islet dysfunction of type II diabetes mellitus. Clin Invest Med. 1995;18:247–254.
 Pancreatic islet- (alpha- and beta-) cell dysfunction: a central factor in the development of hyperglycemia and progression of type 2 diabetes. Major defect in insulin resistance. already present at onset of diabetes. Type 2 Diabetes: Refocusing Priorities. Type 2 diabetes is a multifactorial disease that affects several feedback mechanisms involving insulin and glucagon, which affect the regulation of glucose homeostasis.1,2. In the normal physiologic state, pancreatic beta cells normally increase insulin secretion to compensate for insulin resistance. However, in patients with type 2 diabetes, impaired beta-cell function is associated with insufficient insulin secretion, leading to the development of hyperglycemia.1. By the time diabetes is diagnosed, beta-cell function has already declined considerably, and it continues to decline over time.1. Pancreatic alpha-cell dysfunction contributes an excessive release of glucagon, leading to hepatic glucose overproduction.1. With impaired insulin secretion, an imbalance between insulin and glucagon can develop.1,2 With decreased insulin secretion, glucose uptake by muscle and adipose tissue is decreased.2 Unsuppressed glucagon levels lead to hepatic glucose overproduction and an increase in blood glucose.1. Purpose. To examine the multifactorial aspects of type 2 diabetes. Takeaway. Insulin resistance is present when diabetes is diagnosed. Beta-cell dysfunction and alpha-cell dysfunction (ie, elevated hepatic glucose production) are also critical factors in the development of hyperglycemia. Progressively reduced insulin secretion from beta cells, contributing to. hepatic glucose overproduction. Excess glucagon release from alpha cells, leading to hepatic glucose overproduction. 1. Del Prato S et al. Horm Metab Res. 2004;36:775– Porte D et al. Clin Invest Med. 1995;18:247–254. References. 1. Del Prato S, Marchetti P. Beta- and alpha-cell dysfunction in type 2 diabetes. Horm Metab Res. 2004;36:775– Porte D Jr, Kahn SE. The key role of islet dysfunction of type II diabetes mellitus. Clin Invest Med. 1995;18:247–254.")
4
Manifestations of Beta-Cell Dysfunction in Type 2 Diabetes Mellitus
Abnormal pulsatile insulin response1 Increased proinsulin to insulin ratio1 Beta-Cell Dysfunction Decreased beta-cell responsiveness to glucose2,3 Decreased insulin production4 Decreased insulin content Decreased insulin granule density Manifestations of Beta-Cell Dysfunction in Type 2 Diabetes Mellitus Type 2 diabetes is characterized by progressive deterioriation in beta-cell function.1 A loss in beta-cell function manifests itself by (1) abnormal pulsatile insulin response,1 (2) decreased beta-cell responsiveness to glucose,2,3 (3) an increased proinsulin to insulin ratio,1 and (4) decreased insulin production.4 The secretion of insulin normally occurs in pulses and oscillating patterns. In type 2 diabetes, the pulsatile nature of insulin release is disrupted.1 In type 2 diabetes, the rate of proinsulin conversion to insulin is decreased, resulting in higher proinsulin levels. The higher proinsulin to insulin ratio is directly proportional to the degree of hyperglycemia and is considered a qualitative marker of beta-cell function.1 Insufficient insulin secretion from beta cells contributes to an inability to maintain normal glycemia in fasting or postprandial states, leading to hyperglycemia. With disease progression, beta-cell function deteriorates and insulin secretion decreases, leading to an increase in fasting glucose and hepatic glucose overproduction.1,2,4 Purpose To examine beta-cell dysfunction as an underlying factor contributing to the pathophysiology of type 2 diabetes. Takeaway Beta-cell dysfunction is characterized by altered insulin response, decreased beta-cell responsiveness to glucose, increased proinsulin to insulin ratio, and decreased insulin production. 1. Buchanan TA. Clin Ther. 2003;25:B32–-B46. 2. Buse JB et al. Williams Textbook of Endocrinology. 2003:1427–1483. 3. Ward WK et al. J Clin Invest. 1984;76:1318–1328. 4. Marchetti P et al. J Clin Endocrinol Metab. 2004;89:5535–5541. References 1. Buchanan TA. Pancreatic beta-cell loss and preservation in type 2 diabetes. Clin Ther. 2003;25:B32–B46. 2. Buse JB, Polonsky KS, Burant CF. Type 2 diabetes mellitus. In: Larsen PR, Kronenberg HM, Melmed S, Polonsky KS, eds. Williams Textbook of Endocrinology. 10th ed. Philadelphia: WB Saunders; :1427–1483. 3. Ward WK et al. Diminished B cell secretory capacity in patients with noninsulin-dependent diabetes mellitus. J Clin Invest. 1984;76:1318–1328. 4. Marchetti P, Del Guerra S, Marselli L, et al. Pancreatic islets from type 2 diabetic patients have functional defects and increased apoptosis that are ameliorated by metformin. J Clin Endocrinol Metab ;89:5535–5541.
 abnormal pulsatile insulin response,1 (2) decreased beta-cell responsiveness to glucose,2,3 (3) an increased proinsulin to insulin ratio,1 and (4) decreased insulin production.4. The secretion of insulin normally occurs in pulses and oscillating patterns. In type 2 diabetes, the pulsatile nature of insulin release is disrupted.1. In type 2 diabetes, the rate of proinsulin conversion to insulin is decreased, resulting in higher proinsulin levels. The higher proinsulin to insulin ratio is directly proportional to the degree of hyperglycemia and is considered a qualitative marker of beta-cell function.1. Insufficient insulin secretion from beta cells contributes to an inability to maintain normal glycemia in fasting or postprandial states, leading to hyperglycemia. With disease progression, beta-cell function deteriorates and insulin secretion decreases, leading to an increase in fasting glucose and hepatic glucose overproduction.1,2,4. Purpose. To examine beta-cell dysfunction as an underlying factor contributing to the pathophysiology of type 2 diabetes. Takeaway. Beta-cell dysfunction is characterized by altered insulin response, decreased beta-cell responsiveness to glucose, increased proinsulin to insulin ratio, and decreased insulin production. 1. Buchanan TA. Clin Ther. 2003;25:B32–-B Buse JB et al. Williams Textbook of Endocrinology. 2003:1427– Ward WK et al. J Clin Invest. 1984;76:1318– Marchetti P et al. J Clin Endocrinol Metab. 2004;89:5535–5541. References. 1. Buchanan TA. Pancreatic beta-cell loss and preservation in type 2 diabetes. Clin Ther. 2003;25:B32–B Buse JB, Polonsky KS, Burant CF. Type 2 diabetes mellitus. In: Larsen PR, Kronenberg HM, Melmed S, Polonsky KS, eds. Williams Textbook of Endocrinology. 10th ed. Philadelphia: WB Saunders; 2003:1427– Ward WK et al. Diminished B cell secretory capacity in patients with noninsulin-dependent diabetes mellitus. J Clin Invest. 1984;76:1318– Marchetti P, Del Guerra S, Marselli L, et al. Pancreatic islets from type 2 diabetic patients have functional defects and increased apoptosis that are ameliorated by metformin. J Clin Endocrinol Metab. 2004;89:5535–5541.")
5
Over a 10-year Study, Beta-Cell Function Worsened and Insulin Resistance Remained Relatively Constant Belfast Diet Study Beta-Cell Function Insulin Sensitivity 80 60 60 40 HOMA % β HOMA % S 40 20 Over a 10-Year Study, Beta-Cell Function Worsened and Insulin Resistance Remained Relatively Constant In the Belfast Diet Study, a cohort of patients aged 40 to 69 years (N=432) with newly diagnosed type 2 diabetes was monitored for 10 years to assess the effect of active dietary management on type 2 diabetes. Drug therapy (insulin, tolbutamide, or metformin) was instituted on the basis of weight and blood glucose according to well-defined and uniform criteria. This trial design provided an opportunity to assess the natural history and progression of type 2 diabetes. Ongoing indexes of beta-cell function and insulin sensitivity were based on assessments of fasting glucose and insulin levels from fasting blood samples taken every 3 months over the first 6 years of the study. Beta-cell function and insulin sensitivity were assessed using homeostasis model assessment (HOMA) analysis of fasting plasma glucose (FPG) and insulin concentrations. Beta-cell function and insulin sensitivity were expressed as percentages of values in a lean, young, nondiabetic reference population.1 Patients continuing on diet therapy alone for the first 10 years after diagnosis experienced a small, continuous increase in FPG, a small, continuous decrease in beta-cell function, and no change in obesity or insulin sensitivity. Failure of diet therapy within the first 10 years was associated with higher rates of glucose increase and beta-cell function decrease. Beta-cell function during the first 6 years of follow-up closely mirrored the increase in FPG. There was no difference in insulin sensitivity in any group at months and no change during the further course of diet therapy.1 The 2 graphs on the slide show data for the 67 patients who required additional pharmacotherapy with either oral antihyperglycemic therapy or insulin during years 5 to 7. These data demonstrate the greater contribution of progressive beta-cell dysfunction versus insulin sensitivity to disease progression.1 Beta-cell function was less than 50% at diagnosis and declined continuously thereafter; however, no change in mean insulin sensitivity was observed.1 20 Purpose To demonstrate the relationship between between the progression of type 2 diabetes and 2 core pathophysiologies. Takeaway The progression of type 2 diabetes is more closely associated with a continuous decline in beta-cell function than with a worsening of insulin resistance. 2 4 6 2 4 6 Years From Diagnosis N=432 %β=measure of beta-cell function; %S=measure of insulin sensitivity. Levy J et al. Diabet Med. 1998;15:290–296. Permission requested. Reference 1. Levy J, Atkinson AB, Bell PM, McCance DR, Hadden DR. Beta-cell deterioration determines the onset and rate of progression of secondary dietary failure in type 2 diabetes mellitus: the 10-year follow-up of the Belfast Diet Study Diabet Med. 1998; 15:290–296.
 with newly diagnosed type 2 diabetes was monitored for 10 years to assess the effect of active dietary management on type 2 diabetes. Drug therapy (insulin, tolbutamide, or metformin) was instituted on the basis of weight and blood glucose according to well-defined and uniform criteria. This trial design provided an opportunity to assess the natural history and progression of type 2 diabetes. Ongoing indexes of beta-cell function and insulin sensitivity were based on assessments of fasting glucose and insulin levels from fasting blood samples taken every 3 months over the first 6 years of the study. Beta-cell function and insulin sensitivity were assessed using homeostasis model assessment (HOMA) analysis of fasting plasma glucose (FPG) and insulin concentrations. Beta-cell function and insulin sensitivity were expressed as percentages of values in a lean, young, nondiabetic reference population.1. Patients continuing on diet therapy alone for the first 10 years after diagnosis experienced a small, continuous increase in FPG, a small, continuous decrease in beta-cell function, and no change in obesity or insulin sensitivity. Failure of diet therapy within the first 10 years was associated with higher rates of glucose increase and beta-cell function decrease. Beta-cell function during the first 6 years of follow-up closely mirrored the increase in FPG. There was no difference in insulin sensitivity in any group at 6 months and no change during the further course of diet therapy.1. The 2 graphs on the slide show data for the 67 patients who required additional pharmacotherapy with either oral antihyperglycemic therapy or insulin during years 5 to 7. These data demonstrate the greater contribution of progressive beta-cell dysfunction versus insulin sensitivity to disease progression.1. Beta-cell function was less than 50% at diagnosis and declined continuously thereafter; however, no change in mean insulin sensitivity was observed Purpose. To demonstrate the relationship between between the progression of type 2 diabetes and 2 core pathophysiologies. Takeaway. The progression of type 2 diabetes is more closely associated with a continuous decline in beta-cell function than with a worsening of insulin resistance Years From Diagnosis. N=432. %β=measure of beta-cell function; %S=measure of insulin sensitivity. Levy J et al. Diabet Med. 1998;15:290–296. Permission requested. Reference. 1. Levy J, Atkinson AB, Bell PM, McCance DR, Hadden DR. Beta-cell deterioration determines the onset and rate of progression of secondary dietary failure in type 2 diabetes mellitus: the 10-year follow-up of the Belfast Diet Study. Diabet Med. 1998; 15:290–296.")
6
Alpha-Cell Dysfunction Contributes to Excess Hepatic Glucose Production
Dysregulation of glucagon secretion during fasting Impaired suppression of glucagon secretion after a meal Alpha-Cell Dysfunction Contributes to Excess Hepatic Glucose Production Alpha-cell dysfunction is associated with an inappropriate response to glucose, an increase in glucagon release in the fasting state, and impaired suppression of glucagon secretion after a meal.1 The impaired suppression of glucagon release by alpha cells in response to elevated glucose can result in hepatic glucose overproduction. This dysregulation of glucagon release contributes to the fasting and postprandial hyperglycemia observed in type 2 diabetes.2,3 Purpose To examine the role of alpha-cell dysfunction in the pathophysiology of type 2 diabetes. Takeaway In type 2 diabetes, alpha-cell dysfunction is associated with dysregulation of glucagon release, contributing to hyperglycemia in the fasting and fed states. Fasting and postprandial hyperglycemia in type 2 diabetes 1. Del Prato S et al. Horm Metab Res. 2004;36:775– Clark A et al. Diabetes Res. 1988;9:151–159. 3. Butler PC et al. Diabetes. 1991;40:73–81. References 1. Del Prato S, Marchetti P. Beta- and alpha-cell dysfunction in type 2 diabetes. Horm Metab Res. 2004;36:775–781. 2. Clark A, Wells CA, Buley ID, et al. Islet amyloid, increased A-cells, reduced B-cells and exocrine fibrosis: quantitative changes in the pancreas in type 2 diabetes. Diabetes Res. 1988;9:151–159. 3. Butler PC, Rizza RA. Contribution to postprandial hyperglycemia and effect on initial splanchnic glucose clearance of hepatic glucose cycling in glucose-intolerant or NIDDM patients. Diabetes. 1991;40:73–81.

7
Fasting and Postprandial Hepatic Glucose Output in Type 2 Diabetes
Meal 20 Subjects Without Diabetes (n=12) 18 16 Subjects With Diabetes (n=18) 14 Endogenous Glucose Production, µmol/min/kg 12 10 8 Fasting and Postprandial Hepatic Glucose Output in Type 2 Diabetes In this study, 18 subjects with type 2 diabetes were evaluated. Subjects were instructed to arrive a day early, not to exercise on the day before the study, and to follow a balanced diet containing at least 200 g of carbohydrate for the 3 prior days. On the day of admission, subjects were given a balanced dinner and were told to fast overnight. A 12-hour urine collection was made for measurement of glucose and urea nitrogen levels. At 8:30 AM, subjects ingested a standardized liquid meal within 5 minutes and postprandial measurements of endogenous glucose production were performed for 5 hours.1 This figure shows the endogenous glucose production during basal conditions and for 300 minutes after a meal. The defect of suppression of endogenous glucose production in patients with type 2 diabetes was especially apparent during the first 2 hours after the meal was ingested.1 In subjects without type 2 diabetes, ingested glucose suppresses endogenous glucose production. This study shows that, in contrast, subjects with type 2 diabetes have a blunted suppression of endogenous glucose production and reduced clearance of ingested glucose by insulin-insensitive tissues. These in turn contribute to hyperglycemia.1 6 Purpose To examine postprandial glucose (PPG) utilization in type 2 diabetes. Takeaway Type 2 diabetes is characterized by several abnormalities of the metabolism of postprandial glucose that contribute to hyperglycemia. 4 2 –30 30 60 90 120 150 180 210 240 270 300 Time, min Kelley D et al. Metabolism. 1994;43:1549–1557. Permission requested. Reference 1. Kelley D, Mokan M, Veneman T. Impaired postprandial glucose utilization in non-insulin-dependent diabetes mellitus. Metabolism. 1994;43:1549–1557.
 Subjects With. Diabetes (n=18) 14. Endogenous Glucose. Production, µmol/min/kg Fasting and Postprandial Hepatic Glucose Output in Type 2 Diabetes. In this study, 18 subjects with type 2 diabetes were evaluated. Subjects were instructed to arrive a day early, not to exercise on the day before the study, and to follow a balanced diet containing at least 200 g of carbohydrate for the 3 prior days. On the day of admission, subjects were given a balanced dinner and were told to fast overnight. A 12-hour urine collection was made for measurement of glucose and urea nitrogen levels. At 8:30 AM, subjects ingested a standardized liquid meal within 5 minutes and postprandial measurements of endogenous glucose production were performed for 5 hours.1. This figure shows the endogenous glucose production during basal conditions and for 300 minutes after a meal. The defect of suppression of endogenous glucose production in patients with type 2 diabetes was especially apparent during the first 2 hours after the meal was ingested.1. In subjects without type 2 diabetes, ingested glucose suppresses endogenous glucose production. This study shows that, in contrast, subjects with type 2 diabetes have a blunted suppression of endogenous glucose production and reduced clearance of ingested glucose by insulin-insensitive tissues. These in turn contribute to hyperglycemia Purpose To examine postprandial glucose (PPG) utilization in type 2 diabetes. Takeaway Type 2 diabetes is characterized by several abnormalities of the metabolism of postprandial glucose that contribute to hyperglycemia – Time, min. Kelley D et al. Metabolism. 1994;43:1549–1557. Permission requested. Reference. 1. Kelley D, Mokan M, Veneman T. Impaired postprandial glucose utilization in non-insulin-dependent diabetes mellitus. Metabolism. 1994;43:1549–1557.")
8
Glucoregulatory Role of Key Incretin Hormones
GLP-1 GIP Is released from L cells in ileum and colon1,2 Is released from K cells in duodenum1,2 Stimulates insulin response from beta cells in a glucose-dependent manner1 Stimulates insulin response from beta cells in a glucose-dependent manner1 Inhibits glucagon secretion from alpha cells in a glucose-dependent manner1 Does not affect gastric emptying2 Has no significant effects on satiety or body weight2 Glucoregulatory Role of Key Incretin Hormones GLP-1 (glucagon-like peptide-1) and GIP (glucose-dependent insulinotropic peptide) are incretin hormones and have key roles in glucose homeostasis. GLP-1 is released from L cells in the distal gut (ileum and colon), and GIP is released from K cells in the proximal gut (duodenum).1,2 In a glucose-dependent manner, GLP-1 stimulates insulin response from beta cells1 and inhibits glucagon secretion from alpha cells. GLP-1 also inhibits gastric emptying1,2 and reduces food intake and body weight.2 Similar to GLP-1, GIP stimulates insulin response from beta cells in a glucose-dependent manner.1 GIP has no effect on gastric emptying and no significant effects on satiety or body weight. Inhibits gastric emptying1,2 Purpose To describe the 2 main incretins, GLP-1 and GIP. Takeaway GLP-1 and GIP have key roles in glucose homeostasis. In a glucose-dependent manner, GLP-1 and GIP stimulate insulin secretion, and GLP-1 inhibits glucagon secretion. Reduces food intake and body weight2 GLP-1=glucagon-like peptide-1; GIP=glucose-dependent insulinotropic peptide. 1. Meier JJ et al. Best Pract Res Clin Endocrinol Metab. 2004;18:587–606. 2. Drucker DJ. Diabetes Care. 2003;26:2929–2940. References 1. Drucker DJ. Enhancing incretin action for the treatment of type 2 diabetes. Diabetes Care. 2003;26:2929–2940. 2. Meier JJ, Nauck MA. Glucose-dependent insulinotropic polypeptide/gastric inhibitory polypeptide. Best Pract Res Clin Endocrinol Metab. 2004;18:587–606.
 and GIP (glucose-dependent insulinotropic peptide) are incretin hormones and have key roles in glucose homeostasis. GLP-1 is released from L cells in the distal gut (ileum and colon), and GIP is released from K cells in the proximal gut (duodenum).1,2. In a glucose-dependent manner, GLP-1 stimulates insulin response from beta cells1 and inhibits glucagon secretion from alpha cells. GLP-1 also inhibits gastric emptying1,2 and reduces food intake and body weight.2. Similar to GLP-1, GIP stimulates insulin response from beta cells in a glucose-dependent manner.1 GIP has no effect on gastric emptying and no significant effects on satiety or body weight. Inhibits gastric emptying1,2. Purpose. To describe the 2 main incretins, GLP-1 and GIP. Takeaway. GLP-1 and GIP have key roles in glucose homeostasis. In a glucose-dependent manner, GLP-1 and GIP stimulate insulin secretion, and GLP-1 inhibits glucagon secretion. Reduces food intake and body weight2. GLP-1=glucagon-like peptide-1; GIP=glucose-dependent insulinotropic peptide. 1. Meier JJ et al. Best Pract Res Clin Endocrinol Metab. 2004;18:587– Drucker DJ. Diabetes Care. 2003;26:2929–2940. References. 1. Drucker DJ. Enhancing incretin action for the treatment of type 2 diabetes. Diabetes Care. 2003;26:2929– Meier JJ, Nauck MA. Glucose-dependent insulinotropic polypeptide/gastric inhibitory polypeptide. Best Pract Res Clin Endocrinol Metab. 2004;18:587–606.")
9
The Incretin Effect Is Diminished in Subjects With Type 2 Diabetes
Control Subjects (n=8) Subjects With Type 2 Diabetes (n=14) Normal Incretin Effect Diminished Incretin Effect 80 60 40 20 80 60 40 20 IR Insulin, mU/L The Incretin Effect Is Diminished in Subjects With Type 2 Diabetes In 1964, it was demonstrated that the insulin secretory response was greater when glucose was administered orally through the gastrointestinal tract than when glucose was delivered via IV infusion. The term incretin effect was coined to describe this response involving the stimulatory effect of gut hormones known as incretins on pancreatic secretion.1,2 The incretin effect implies that nutrient ingestion causes the gut to release substances that enhance insulin secretion beyond the release caused by the rise in glucose secondary to absorption of digested nutrients.1 Studies in humans and animals have shown that the incretin hormones GLP-1 and GIP account for almost all of the incretin effect,3 stimulating insulin release when glucose levels are elevated.4,5 Although the incretin effect is detectable both in healthy subjects and in those with diabetes, it is abnormal in those with diabetes, as demonstrated by the study shown on the slide.6 In this study, patients with type 2 diabetes and weight-matched, metabolically healthy control subjects were given glucose either orally or IV to achieve an isoglycemic load. In those individuals without diabetes (shown on the left), the plasma insulin response to an oral glucose load was far greater than the plasma insulin response to an IV glucose load (incretin effect)—that is, the pancreatic beta cells secreted much more insulin when the glucose load was administered through the gastrointestinal tract. In patients with type 2 diabetes (shown on the right), the same effect was observed but was diminished. The diminished incretin effect observed in patients with type 2 diabetes may be due to reduced responsiveness of pancreatic beta cells to GLP-1 and GIP or to impaired secretion of the relevant incretin hormone.7,8 IR Insulin, mU/L Purpose To introduce the concept of the incretin effect in healthy individuals and the abnormality in patients with type 2 diabetes. Takeaway Gastrointestinal ingestion of glucose stimulates a greater insulin response than that seen from IV glucose infusion. This effect is significantly decreased in patients with type 2 diabetes. The response is largely attributed to the effect of incretins. 60 120 180 60 120 180 Time, min Time, min Oral glucose load Intravenous (IV) glucose infusion IR=immunoreactive. Nauck M et al. Diabetologia 1986;29:46–52. Permission requested. References 1. Creutzfeldt W. The incretin concept today. Diabetologia. 1979;16:75–85. 2. Creutzfeldt W. The [pre-] history of the incretin concept. Regul Pept. 2005;128:87–91. 3. Brubaker PL, Drucker DJ. Minireview: glucagon-like peptides regulate cell proliferation and apoptosis in the pancreas, gut, and central nervous system. Endocrinology. 2004;145:2653–2659. 4. Drucker DJ. Biological actions and therapeutic potential of the glucagon-like peptides. Gastroenterology. 2002;122:531–544. 5. Ahrén B. Gut peptides and type 2 diabetes mellitus treatment. Curr Diab Rep. 2003;3:365–372. 6. Nauck M, Stöckmann F, Ebert R, Creutzfeldt W. Reduced incretin effect in type 2 (non-insulin-dependent) diabetes. Diabetologia ;29:46–52. 7. Creutzfeldt W. The entero-insular axis in type 2 diabetes—incretins as therapeutic agents. Exp Clin Endocrinol Diabetes ;109(suppl 2):S288 S303. 8. Nauck MA, Heimesaat MM, Ørskov C, Holst JJ, Ebert R, Creutzfeldt W. Preserved incretin activity of glucagon-like peptide 1 [7-36 amide] but not of synthetic human gastric inhibitory polypeptide in patients with type-2 diabetes mellitus. J Clin Invest. 1993;91:301–307.
 Subjects With Type 2 Diabetes (n=14) Normal Incretin Effect. Diminished Incretin Effect IR Insulin, mU/L. The Incretin Effect Is Diminished in Subjects With Type 2 Diabetes. In 1964, it was demonstrated that the insulin secretory response was greater when glucose was administered orally through the gastrointestinal tract than when glucose was delivered via IV infusion. The term incretin effect was coined to describe this response involving the stimulatory effect of gut hormones known as incretins on pancreatic secretion.1,2 The incretin effect implies that nutrient ingestion causes the gut to release substances that enhance insulin secretion beyond the release caused by the rise in glucose secondary to absorption of digested nutrients.1 Studies in humans and animals have shown that the incretin hormones GLP-1 and GIP account for almost all of the incretin effect,3 stimulating insulin release when glucose levels are elevated.4,5. Although the incretin effect is detectable both in healthy subjects and in those with diabetes, it is abnormal in those with diabetes, as demonstrated by the study shown on the slide.6. In this study, patients with type 2 diabetes and weight-matched, metabolically healthy control subjects were given glucose either orally or IV to achieve an isoglycemic load. In those individuals without diabetes (shown on the left), the plasma insulin response to an oral glucose load was far greater than the plasma insulin response to an IV glucose load (incretin effect)—that is, the pancreatic beta cells secreted much more insulin when the glucose load was administered through the gastrointestinal tract. In patients with type 2 diabetes (shown on the right), the same effect was observed but was diminished. The diminished incretin effect observed in patients with type 2 diabetes may be due to reduced responsiveness of pancreatic beta cells to GLP-1 and GIP or to impaired secretion of the relevant incretin hormone.7,8. IR Insulin, mU/L. Purpose. To introduce the concept of the incretin effect in healthy individuals and the abnormality in patients with type 2 diabetes. Takeaway. Gastrointestinal ingestion of glucose stimulates a greater insulin response than that seen from IV glucose infusion. This effect is significantly decreased in patients with type 2 diabetes. The response is largely attributed to the effect of incretins Time, min. Time, min. Oral glucose load. Intravenous (IV) glucose infusion. IR=immunoreactive. Nauck M et al. Diabetologia 1986;29:46–52. Permission requested. References. 1. Creutzfeldt W. The incretin concept today. Diabetologia. 1979;16:75– Creutzfeldt W. The [pre-] history of the incretin concept. Regul Pept. 2005;128:87– Brubaker PL, Drucker DJ. Minireview: glucagon-like peptides regulate cell proliferation and apoptosis in the pancreas, gut, and central nervous system. Endocrinology. 2004;145:2653– Drucker DJ. Biological actions and therapeutic potential of the glucagon-like peptides. Gastroenterology. 2002;122:531– Ahrén B. Gut peptides and type 2 diabetes mellitus treatment. Curr Diab Rep. 2003;3:365– Nauck M, Stöckmann F, Ebert R, Creutzfeldt W. Reduced incretin effect in type 2 (non-insulin-dependent) diabetes. Diabetologia. 1986;29:46– Creutzfeldt W. The entero-insular axis in type 2 diabetes—incretins as therapeutic agents. Exp Clin Endocrinol Diabetes. 2001;109(suppl 2):S288 S Nauck MA, Heimesaat MM, Ørskov C, Holst JJ, Ebert R, Creutzfeldt W. Preserved incretin activity of glucagon-like peptide 1 [7-36 amide] but not of synthetic human gastric inhibitory polypeptide in patients with type-2 diabetes mellitus. J Clin Invest. 1993;91:301–307.")
10
GLP-1 and GIP Are Degraded by the DPP-4 Enzyme
Meal Intestinal GLP-1 and GIP release DPP-4 enzyme GLP-1 and GIP Are Degraded by the DPP-4 Enzyme GLP-1 and GIP, which are rapidly degraded by the enzyme DPP-4, have short biological half-lives.1–3 After a meal, GLP-1 and GIP are released in the distal gut (ileum and colon) and the proximal gut (duodenum), respectively. Under normal conditions after their release into the circulation, GLP-1 and GIP are rapidly degraded by the DPP-4 enzyme to their inactive forms.1–3 Purpose To discuss the importance of the DDP-4 enzyme to the biological activity of the incretin hormones GLP-1 and GIP. Takeaway The relatively short biological half-lives of GLP-1 and GIP are attributed primarily to their rapid inactivation by the DPP-4 enzyme. Active GLP-1 and GIPa Inactive metabolites Rapid inactivation aHalf-lives: GLP-1 ~2 minutes; GIP ~5 minutes. 1. Deacon CF et al. Diabetes. 1995;44:1126–1131. 2. Meier JJ et al. Diabetes. 2004;53:654–662. References 1. Deacon CF, Nauck MA, Toft-Nielsen M, Pridal L, Willms B, Holst JJ. Both subcutaneously and intravenously administered glucagon-like peptide I are rapidly degraded from the NH2-terminus in type II diabetic patients and in healthy subjects. Diabetes. 1995;44:1126–1131. 2. Meier JJ, Nauck MA, Kranz D, et al. Secretion, degradation, and elimination of glucagon-like peptide 1 and gastric inhibitory polypeptide in patients with chronic renal insufficiency and healthy control subjects. Diabetes. 2004;53:654–662. 3. Drucker DJ. Enhancing incretin action for the treatment of type 2 diabetes. Diabetes Care. 2003;26:2929–2940.
 and the proximal gut (duodenum), respectively. Under normal conditions after their release into the circulation, GLP-1 and GIP are rapidly degraded by the DPP-4 enzyme to their inactive forms.1–3. Purpose. To discuss the importance of the DDP-4 enzyme to the biological activity of the incretin hormones GLP-1 and GIP. Takeaway. The relatively short biological half-lives of GLP-1 and GIP are attributed primarily to their rapid inactivation by the DPP-4 enzyme. Active GLP-1 and GIPa. Inactive metabolites. Rapid inactivation. aHalf-lives: GLP-1 ~2 minutes; GIP ~5 minutes. 1. Deacon CF et al. Diabetes. 1995;44:1126– Meier JJ et al. Diabetes. 2004;53:654–662. References. 1. Deacon CF, Nauck MA, Toft-Nielsen M, Pridal L, Willms B, Holst JJ. Both subcutaneously and intravenously administered glucagon-like peptide I are rapidly degraded from the NH2-terminus in type II diabetic patients and in healthy subjects. Diabetes. 1995;44:1126– Meier JJ, Nauck MA, Kranz D, et al. Secretion, degradation, and elimination of glucagon-like peptide 1 and gastric inhibitory polypeptide in patients with chronic renal insufficiency and healthy control subjects. Diabetes. 2004;53:654– Drucker DJ. Enhancing incretin action for the treatment of type 2 diabetes. Diabetes Care. 2003;26:2929–2940.")
11
Glucose levels rise Food [Begin speaking]
This animation depicts the role of pancreatic islet cells in maintaining glucose homeostasis. The gut and the pancreas are physiologically linked through the incretin pathway, which modulates the response of beta and alpha cells to oral food intake.1–3 Normally during fasting, alpha cells secrete glucagon, which stimulates hepatic glucose production and release, thus preventing hypoglycemia.1–4 [Click for animation to start] When food enters the digestive system, glucose is subsequently absorbed from the gut, resulting in an increase in plasma glucose levels. [Click for animation to continue] Increased circulating levels of glucose trigger beta-cells to release insulin (which promotes glucose uptake) and also signal the alpha cells to suppress glucagon release and thus decrease hepatic glucose production (HGP). The role that incretins play in maintaining glucose homeostasis after a meal, is depicted on the next animation. [Click for animation to continue] Again, after a meal, glucose absorption results in an increase in circulating plasma glucose levels. As a physiologic response to elevated glucose levels, gut-derived incretin hormones (GLP-1 from the L cells in the ileum and colon and GIP from the K cells in the duodenum) are released into circulation.5,6 Within minutes, the DPP-4 enzyme degrades both incretins. In healthy individuals, GLP-1 and GIP reach the pancreas, where they bind to receptors on the surface of pancreatic islet cells (beta and alpha cells), triggering both insulin secretion and suppression of glucagon release, thus achieving glucose homeoostasis. In patients with type 2 diabetes, alterations in the incretin pathway have been observed that contribute to abnormalities in glucose homeostasis. Postprandial GLP-1 levels are decreased7,8 and insulin response to GIP diminished.9,10 Given the important role that incretins play in maintaining glucose homeostasis, for patients with type 2 diabetes, prolonging the concentrations of active incretins is expected to help improve glucose control. [Click to resume animation] Here we see the effects of a DPP-4 enzyme inhibitor, increasing the half life of GLP-1 and GIP, which can then trigger glucose-dependent insulin secretion from beta cells and suppression of glucagon release from alpha cells. [Animation ends] These actions result in increased glucose uptake by the muscles and tissues and decreased glucose output by the liver, with an overall reduction in circulating glucose levels and a lowering in plasma glucose levels. [Click advance to next slide] References 1. Triplitt C, Wright A, Chiquette E. Incretin mimetics and dipeptidyl peptidase-IV inhibitors: potential new therapies for type 2 diabetes mellitus. Pharmacotherapy. 2006;26:360–374. 2. Aronoff SL, Berkowitz K, Shreiner B, Want L. Glucose metabolism and regulation: beyond insulin and glucagon. Diabetes Spectrum. 2004;17:183–190. 3. Muller WA, Faloona GR, Aguilar-Parada E, Unger RH. Abnormal alpha-cell function in diabetes: response to carbohydrate and protein ingestion. N Engl J Med. 1970;283:109–115. 4. Unger RH. Alpha- and beta-cell interrelationships in health and disease. Metabolism. 1974;23:581–593. 5. Meier JJ, Nauck MA. Secretion, degradation, and elimination of glucagon-like peptide 1 and gastric inhibitory polypeptide in patients with chronic renal insufficiency and healthy control subjects. Best Pract Res Clin Endocrinol Metab. 2004;18:587–606. 6. Drucker DJ. Enhancing incretin action for the treatment of type 2 diabetes. Diabetes Care. 2003;26:2929–2940. 7. Toft-Nielsen MB, Damholt MB, Madsbad S, et al. Determinants of the impaired secretion of glucagon-like peptide-1 in type 2 diabetic patients. J Clin Endocrinol Metab. 2001;86:3717–3723. 8. Vilsboll T, Krarup T, Deacon CF, Madsbad S, Holst JJ. Reduced postprandial concentrations of intact biologically active glucagon-like peptide-1 in type 2 diabetic patients. Diabetes. 2001;50:609–613. 9. Nauck M, Stockmann F, Ebert R, Creutzfeldt W. Reduced incretin effect in type 2 (non-insulin-dependent) diabetes. Diabetologia. 1986;29:46–52. 10.Nauck MA, Heimesaat MM, Orskov C, Holst JJ, Ebert R, Creutzfeldt W. Preserved incretin activity of glucagon-like peptide 1 [7-36 amide] but not of synthetic human gastric inhibitory polypeptide in patients with type-2 diabetes mellitus. J Clin Invest. 1993;91:301–307.
![Glucose levels rise Food [Begin speaking]](http://slideplayer.com/slide/4130060/13/images/11/Glucose+levels+rise+Food+%5BBegin+speaking%5D.jpg "This animation depicts the role of pancreatic islet cells in maintaining glucose homeostasis. The gut and the pancreas are physiologically linked through the incretin pathway, which modulates the response of beta and alpha cells to oral food intake.1–3 Normally during fasting, alpha cells secrete glucagon, which stimulates hepatic glucose production and release, thus preventing hypoglycemia.1–4. [Click for animation to start] When food enters the digestive system, glucose is subsequently absorbed from the gut, resulting in an increase in plasma glucose levels. [Click for animation to continue] Increased circulating levels of glucose trigger beta-cells to release insulin (which promotes glucose uptake) and also signal the alpha cells to suppress glucagon release and thus decrease hepatic glucose production (HGP). The role that incretins play in maintaining glucose homeostasis after a meal, is depicted on the next animation. [Click for animation to continue] Again, after a meal, glucose absorption results in an increase in circulating plasma glucose levels. As a physiologic response to elevated glucose levels, gut-derived incretin hormones (GLP-1 from the L cells in the ileum and colon and GIP from the K cells in the duodenum) are released into circulation.5,6 Within minutes, the DPP-4 enzyme degrades both incretins. In healthy individuals, GLP-1 and GIP reach the pancreas, where they bind to receptors on the surface of pancreatic islet cells (beta and alpha cells), triggering both insulin secretion and suppression of glucagon release, thus achieving glucose homeoostasis. In patients with type 2 diabetes, alterations in the incretin pathway have been observed that contribute to abnormalities in glucose homeostasis. Postprandial GLP-1 levels are decreased7,8 and insulin response to GIP diminished.9,10. Given the important role that incretins play in maintaining glucose homeostasis, for patients with type 2 diabetes, prolonging the concentrations of active incretins is expected to help improve glucose control. [Click to resume animation] Here we see the effects of a DPP-4 enzyme inhibitor, increasing the half life of GLP-1 and GIP, which can then trigger glucose-dependent insulin secretion from beta cells and suppression of glucagon release from alpha cells. [Animation ends] These actions result in increased glucose uptake by the muscles and tissues and decreased glucose output by the liver, with an overall reduction in circulating glucose levels and a lowering in plasma glucose levels. [Click advance to next slide] References. 1. Triplitt C, Wright A, Chiquette E. Incretin mimetics and dipeptidyl peptidase-IV inhibitors: potential new therapies for type 2 diabetes mellitus. Pharmacotherapy. 2006;26:360– Aronoff SL, Berkowitz K, Shreiner B, Want L. Glucose metabolism and regulation: beyond insulin and glucagon. Diabetes Spectrum. 2004;17:183– Muller WA, Faloona GR, Aguilar-Parada E, Unger RH. Abnormal alpha-cell function in diabetes: response to carbohydrate and protein ingestion. N Engl J Med. 1970;283:109– Unger RH. Alpha- and beta-cell interrelationships in health and disease. Metabolism. 1974;23:581– Meier JJ, Nauck MA. Secretion, degradation, and elimination of glucagon-like peptide 1 and gastric inhibitory polypeptide in patients with chronic renal insufficiency and healthy control subjects. Best Pract Res Clin Endocrinol Metab. 2004;18:587– Drucker DJ. Enhancing incretin action for the treatment of type 2 diabetes. Diabetes Care. 2003;26:2929– Toft-Nielsen MB, Damholt MB, Madsbad S, et al. Determinants of the impaired secretion of glucagon-like peptide-1 in type 2 diabetic patients. J Clin Endocrinol Metab. 2001;86:3717– Vilsboll T, Krarup T, Deacon CF, Madsbad S, Holst JJ. Reduced postprandial concentrations of intact biologically active glucagon-like peptide-1 in type 2 diabetic patients. Diabetes. 2001;50:609– Nauck M, Stockmann F, Ebert R, Creutzfeldt W. Reduced incretin effect in type 2 (non-insulin-dependent) diabetes. Diabetologia. 1986;29:46– Nauck MA, Heimesaat MM, Orskov C, Holst JJ, Ebert R, Creutzfeldt W. Preserved incretin activity of glucagon-like peptide 1 [7-36 amide] but not of synthetic human gastric inhibitory polypeptide in patients with type-2 diabetes mellitus. J Clin Invest. 1993;91:301–307.")
12
Insulin secretion Glucagon suppression

14
Food Glucose levels rise

15
Blood Vessel GLP-1 GIP

16
GLP-1 GIP DPP-4

17
GLP-1 GIP DPP-4 DPP-4 Inhibitor

18
GLP-1 GIP DPP-4 Inhibitor

20
Insulin Glucagon

21
ADA and AACE/ACE Guidelines: Treatment Goals for A1C, FPG, and PPG
Parameter Normal1,2 Level ADA3 Goal AACE/ACE2 Goal FPG, mg/dL <100 90–130 <110 PPG, mg/dL <140 <180 A1C, % 4–6 <7a ≤6.5 ADA and AACE Guidelines: Treatment Goals for A1C, FPG, and PPG The table presents guidelines from the American Diabetes Association (ADA) and the American Association of Clinical Endocrinologists (AACE).1–3 ADA and AACE recommend slightly different treatment goals for FPG, PPG, and A1C for patients with type 2 diabetes.1,2 Both organizations emphasize the importance of good glycemic control. The ADA suggests that the goal of treatment in the management of diabetes should be an A1C value less than 7%.1,2 The AACE has recommended an A1C goal of ≤6.5%.1,3 The ADA target of FPG levels between 90 and 130 mg/dL is based on the estimate of the range of average glucose values that would be associated with low risk of hypoglycemia and A1C <7%. The AACE target of <110 mg/dL is an effort to achieve normal levels of glycemia.1 The ADA recommends reducing average PPG values (peak posprandial glucose level <180 mg/dL),2 whereas the AACE recommends targeting 2-hour postchallenge PPG values of <140 mg/dL.1 Purpose To provide a reminder of current guidelines for type 2 diabetes. Takeaway All 3 parameters (A1C, FPG, and PPG) are important in attaining glycemic control. aThe goal for an individual patient is to achieve an A1C as close to normal (<6%) as possible without significant hypoglycemia. FPG=fasting plasma glucose; PPG=postprandial glucose; ADA=American Diabetes Association; AACE=American Association of Clinical Endocrinologists; ACE=American College of Endocrinology. 1. Adapted from Buse J et al. In: Williams Textbook of Endocrinology. 10th ed Permission requested. 2. AACE Diabetes Mellitus Clinical Practice Guidelines Task Force. Endocr Pract. 2007;13:(suppl 1)3–68. 3. ADA. Diabetes Care. 2007;30:S4–S41. References 1. Buse JB, Polonsky KS, Burant CF. Type 2 diabetes mellitus. In: Larsen PR, Kronenberg HM, Melmed S, Polonsky KS, eds. Williams Textbook of Endocrinology. 10th ed. Philadelphia: WB Saunders; 2003:1427–1483. 2. ADA. Standards of Medical Care in Diabetes–2007. Diabetes Care. 2007;30:S4–S41. 3. AACE Diabetes Mellitus Clinical Practice Guidelines Task Force. American Association of Clinical Endocrinologists Medical Guidelines for Clinical Practice for the Management of Diabetes Mellitus. Endocrine Practice. 2007;13(suppl 1):3–68.
 and the American Association of Clinical Endocrinologists (AACE).1–3. ADA and AACE recommend slightly different treatment goals for FPG, PPG, and A1C for patients with type 2 diabetes.1,2 Both organizations emphasize the importance of good glycemic control. The ADA suggests that the goal of treatment in the management of diabetes should be an A1C value less than 7%.1,2 The AACE has recommended an A1C goal of ≤6.5%.1,3. The ADA target of FPG levels between 90 and 130 mg/dL is based on the estimate of the range of average glucose values that would be associated with low risk of hypoglycemia and A1C <7%. The AACE target of <110 mg/dL is an effort to achieve normal levels of glycemia.1. The ADA recommends reducing average PPG values (peak posprandial glucose level <180 mg/dL),2 whereas the AACE recommends targeting 2-hour postchallenge PPG values of <140 mg/dL.1. Purpose. To provide a reminder of current guidelines for type 2 diabetes. Takeaway. All 3 parameters (A1C, FPG, and PPG) are important in attaining glycemic control. aThe goal for an individual patient is to achieve an A1C as close to normal (<6%) as possible without significant hypoglycemia. FPG=fasting plasma glucose; PPG=postprandial glucose; ADA=American Diabetes Association; AACE=American Association of Clinical Endocrinologists; ACE=American College of Endocrinology. 1. Adapted from Buse J et al. In: Williams Textbook of Endocrinology. 10th ed Permission requested. 2. AACE Diabetes Mellitus Clinical Practice Guidelines Task Force. Endocr Pract. 2007;13:(suppl 1)3– ADA. Diabetes Care. 2007;30:S4–S41. References. 1. Buse JB, Polonsky KS, Burant CF. Type 2 diabetes mellitus. In: Larsen PR, Kronenberg HM, Melmed S, Polonsky KS, eds. Williams Textbook of Endocrinology. 10th ed. Philadelphia: WB Saunders; 2003:1427– ADA. Standards of Medical Care in Diabetes–2007. Diabetes Care. 2007;30:S4–S AACE Diabetes Mellitus Clinical Practice Guidelines Task Force. American Association of Clinical Endocrinologists Medical Guidelines for Clinical Practice for the Management of Diabetes Mellitus. Endocrine Practice. 2007;13(suppl 1):3–68.")
22
Relative Contribution of FPG and PPG to Overall Hyperglycemia Depending on A1C Quintiles
This study evaluated the relative contributions of FPG and PPG to overall hyperglycemia in 290 non–insulin-, non–acarbose-using patients with type 2 diabetes. The analysis suggested that both FPG and PPG contribute to overall hyperglycemia.1 The relative contribution of PPG levels decreased progressively from the lowest to the highest quintile of A1C.1 In contrast, the relative contribution of FPG showed a gradual increase with increasing levels of A1C.1 Thus, targeting both FPG and PPG may be required to optimize blood glucose levels.1 Purpose To demonstrate that both FPG and PPG contribute to elevated A1C in patients with type 2 diabetes. Takeaway The relative contribution of FPG and PPG may vary by level of A1C, and both FPG and PPG may have to be addressed to get the patient to goal. n = 58 n = 58 n = 58 n = 58 n = 58 A1C Monnier L et al. Diabetes Care. 2003;26:881–885. Permission requested. Reference 1. Monnier L, Lapinski H, Colette C. Contributions of fasting and postprandial plasma glucose increments to the overall diurnal hyperglycemia of type 2 diabetic patients: variations with increasing levels of HbA1c. Diabetes Care. 2003;26:881–885.

23
Published Conceptual Approach
Earlier and More Aggressive Intervention May Improve Patients’ Chances of Reaching Goal Published Conceptual Approach OAD + multiple daily insulin injections Diet and exercise OAD monotherapy OAD up-titration OAD combination OAD + basal insulin 10 A1C, % 9 8 Earlier and More Aggressive Intervention May Improve Treating to Target Compared With Conventional Therapy The yellow line depicts a conceptual view of a conventional stepwise treatment approach. Hypothetically, patients treated with this approach would have a considerable glycemic burden (time spent above A1C goals). The orange line depicts a conceptual view of an aggressive A1C goal-oriented approach that would initiate changes in therapy earlier (within several months of goals not met). Hypothetically, patients treated with this approach might be able to achieve A1C results such as those depicted by the straight orange line. This approach also calls for earlier use of combination therapy in appropriate patients.1 Mean A1C of patients Purpose To show conceptually that early, aggressive intervention may reduce the glycemic burden of type 2 diabetes. Takeaway A treat-to-goal therapeutic approach with aggressive treatment and a low threshold for action (A1C >7%) may reduce the glycemic burden of type 2 diabetes. 7 6 Duration of Diabetes Adapted from Del Prato S et al. Int J Clin Pract. 2005;59:1345–1355. Permission requested. Reference 1. Del Prato S, Felton A-M, Munro N, Nesto R, Zimmet P, Zinman B, on behalf of the Global Partnership for Effective Diabetes Management. Improving glucose management: ten steps to get more patients with type 2 diabetes to glycaemic goal. Int J Clin Pract. 2005;59:1345–1355.
. The orange line depicts a conceptual view of an aggressive A1C goal-oriented approach that would initiate changes in therapy earlier (within several months of goals not met). Hypothetically, patients treated with this approach might be able to achieve A1C results such as those depicted by the straight orange line. This approach also calls for earlier use of combination therapy in appropriate patients.1. Mean A1C of patients. Purpose. To show conceptually that early, aggressive intervention may reduce the glycemic burden of type 2 diabetes. Takeaway. A treat-to-goal therapeutic approach with aggressive treatment and a low threshold for action (A1C >7%) may reduce the glycemic burden of type 2 diabetes Duration of Diabetes. Adapted from Del Prato S et al. Int J Clin Pract. 2005;59:1345–1355. Permission requested. Reference. 1. Del Prato S, Felton A-M, Munro N, Nesto R, Zimmet P, Zinman B, on behalf of the Global Partnership for Effective Diabetes Management. Improving glucose management: ten steps to get more patients with type 2 diabetes to glycaemic goal. Int J Clin Pract. 2005;59:1345–1355.")
24
Case Study: Mona Female, 60 years old, obese
Serum creatinine: 1.4 mg/dL A1C: 7.1% Antihypertensive therapy History of inflammatory bowel disease Recent myocardial infarction Treatment-naive for diabetes Case Study: Mona Mona is a 60-year-old obese woman with a serum creatinine level of 1.4 mg/dL and an A1C of 7.1%. She is treatment-naive for diabetes. Her medical history includes hypertension and inflammatory bowel disease, and she had a heart attack 2 years ago. We will return to consider potential oral antihyperglycemic treatment options for this patient later in this presentation. Purpose To discuss current treatment options for patients with type 2 diabetes.

25
Case Study: Archie Male, 54 years old, obese
Serum creatinine: 0.9 mg/dL A1C: 8.0% Has been receiving metformin 1,000 mg twice a day for past 6 months Case Study: Archie Archie is a 54-year-old obese man with a serum creatinine level of 0.9 mg/dL and an A1C of 8.0%. Archie has been receiving metformin 1,000 mg twice daily for the past 6 months. We will return to consider potential oral antihyperglycemic treatment options for this patient later in this presentation. Purpose To discuss current treatment options for patients with type 2 diabetes.

26
Case Study: Nancy Female, 55 years old, obese
Serum creatinine: 1.0 mg/dL A1C: 8.5% Mild edema Antihypertensive therapy Treatment-naive for diabetes Case Study: Nancy Nancy is a 55-year-old obese woman with a serum creatinine level of 1.0 mg/dL and an A1C of 8.5%. She is treatment-naive for diabetes. Her medical history includes hypertension and mild edema. We will return to consider potential oral antihyperglycemic treatment options for this patient later in this presentation. Purpose To discuss current treatment options for patients with type 2 diabetes.

27
Major Targets of Oral Drug Classes
Pancreatic Islet Cells Sulfonylureas Meglitinides DPP-4 inhibitors Liver Muscle and Fat Biguanides TZDs TZDs Biguanides ↓Glucose level DPP-4 inhibitors Major Targets of Oral Drug Classes Available therapeutic agents for the treatment of type 2 diabetes have different mechanisms of action to control hyperglycemia.1,2 Sulfonylureas act on the beta cell, stimulating insulin release by binding to the sulfonylurea receptor of beta-cell membranes.1,2 Meglitinides, another class of short-acting insulin secretagogues, also act in the pancreas, stimulating insulin release by binding to several sites on the beta cells.They are used to control postprandial hyperglycemia.1 Thiazolidinediones (TZDs) are selective peroxisome proliferator-activated receptor gamma (PPARγ) agonists that act in the muscle. They also exert effects in the liver and adipose tissue. These agents reduce insulin resistance and decrease hepatic glucose output.1 Alpha-glucosidase inhibitors lower postprandial blood glucose concentrations by inhibiting disaccharidase enzymes in the gut, thereby delaying carbohydrate absorption. This action prevents glucose entry into the systemic circulation.1 Biguanides (metformin) are believed to act primarily in the liver by decreasing hepatic glucose output through a mechanism that has not been fully elucidated. Metformin also enhances insulin sensitivity in muscle.1,2 DPP-4 inhibitors are another class of agents for the treatment type 2 diabetes that inhibit the enzyme DPP-4 from degrading and inactivating GLP-1 and GIP, incretin hormones produced in the gut. GLP-1 and GIP regulate the production and secretion of insulin through a glucose-dependent mechanism that targets insulin release and hepatic glucose production.3 Purpose To provide an overview of the general mechanisms of action of oral antihyperglycemic drug classes and their effects on the pancreas and the liver. Takeaway Available drug classes have different mechanisms of action. Gut alpha-Glucosidase inhibitors DPP-4=dipeptidyl peptidase-4; TZD=thiazolidinediones. 1. DeFronzo RA. Ann Intern Med. 1999;131:281–303. 2. Buse JB et al. In: Williams Textbook of Endocrinology. 2003:1427–1483. References 1. DeFronzo RA. Pharmacologic therapy for type 2 diabetes mellitus. Ann Intern Med. 1999;131:281–303. 2. Buse JB, Polonsky KS, Burant CF. Type 2 diabetes mellitus. In: Larsen PR, Kronenberg HM, Melmed S, Polonsky KS, eds. Williams Textbook of Endocrinology. 10th ed. Philadelphia: WB Saunders; 2003:1427–1483. 3. Meier JJ, Nauck MA, Kranz D, et al. Secretion, degradation, and elimination of glucagon-like peptide 1 and gastric inhibitory polypeptide in patients with chronic renal insufficiency and healthy control subjects. Diabetes. 2004;53:654–662.
 are selective peroxisome proliferator-activated receptor gamma (PPARγ) agonists that act in the muscle. They also exert effects in the liver and adipose tissue. These agents reduce insulin resistance and decrease hepatic glucose output.1 Alpha-glucosidase inhibitors lower postprandial blood glucose concentrations by inhibiting disaccharidase enzymes in the gut, thereby delaying carbohydrate absorption. This action prevents glucose entry into the systemic circulation.1 Biguanides (metformin) are believed to act primarily in the liver by decreasing hepatic glucose output through a mechanism that has not been fully elucidated. Metformin also enhances insulin sensitivity in muscle.1,2. DPP-4 inhibitors are another class of agents for the treatment type 2 diabetes that inhibit the enzyme DPP-4 from degrading and inactivating GLP-1 and GIP, incretin hormones produced in the gut. GLP-1 and GIP regulate the production and secretion of insulin through a glucose-dependent mechanism that targets insulin release and hepatic glucose production.3. Purpose. To provide an overview of the general mechanisms of action of oral antihyperglycemic drug classes and their effects on the pancreas and the liver. Takeaway. Available drug classes have different mechanisms of action. Gut. alpha-Glucosidase inhibitors. DPP-4=dipeptidyl peptidase-4; TZD=thiazolidinediones. 1. DeFronzo RA. Ann Intern Med. 1999;131:281– Buse JB et al. In: Williams Textbook of Endocrinology. 2003:1427–1483. References. 1. DeFronzo RA. Pharmacologic therapy for type 2 diabetes mellitus. Ann Intern Med. 1999;131:281– Buse JB, Polonsky KS, Burant CF. Type 2 diabetes mellitus. In: Larsen PR, Kronenberg HM, Melmed S, Polonsky KS, eds. Williams Textbook of Endocrinology. 10th ed. Philadelphia: WB Saunders; 2003:1427– Meier JJ, Nauck MA, Kranz D, et al. Secretion, degradation, and elimination of glucagon-like peptide 1 and gastric inhibitory polypeptide in patients with chronic renal insufficiency and healthy control subjects. Diabetes. 2004;53:654–662.")
28
JANUVIA™ (sitagliptin) Tablets
JANUVIA™ (sitagliptin) Tablets: Clinical Overview We will now discuss the clinical overview of JANUVIA. Clinical Overview
 Tablets: Clinical Overview. We will now discuss the clinical overview of JANUVIA. Clinical Overview.")
29
JANUVIA™ (sitagliptin)
Indication JANUVIA is a dipeptidyl peptidase-4 (DPP-4) inhibitor indicated as an adjunct to diet and exercise to improve glycemic control in adults with type 2 diabetes mellitus Important limitations of use JANUVIA should not be used in patients with type 1 diabetes or for the treatment of diabetic ketoacidosis. JANUVIA has not been studied in combination with insulin. JANUVIA has been studied as monotherapy and in combination with metformin, pioglitazone, glimepiride, and glimepiride plus metformin. JANUVIA™ (sitagliptin) Indications Januvia is a dipeptidyl peptidase-4 (DPP-4) inhibitor indicated as an adjunct to diet and exercise to improve glycemic control in adults with type 2 diabetes mellitus Important limitations of use JANUVIA should not be used in patients with type 1 diabetes or for the treatment of diabetic ketoacidosis. JANUVIA has not been studied in combination with insulin. JANUVIA has been studied as monotherapy and in combination with metformin, pioglitazone, glimepiride, and glimepiride plus metformin.
 inhibitor indicated as an adjunct to diet and exercise to improve glycemic control in adults with type 2 diabetes mellitus. Important limitations of use. JANUVIA should not be used in patients with type 1 diabetes or for the treatment of diabetic ketoacidosis. JANUVIA has not been studied in combination with insulin. JANUVIA has been studied as monotherapy and in combination with metformin, pioglitazone, glimepiride, and glimepiride plus metformin. JANUVIA™ (sitagliptin) Indications. Januvia is a dipeptidyl peptidase-4 (DPP-4) inhibitor indicated as an adjunct to diet and exercise to improve glycemic control in adults with type 2 diabetes mellitus. Important limitations of use. JANUVIA should not be used in patients with type 1 diabetes or for the treatment of diabetic ketoacidosis. JANUVIA has not been studied in combination with insulin. JANUVIA has been studied as monotherapy and in combination with metformin, pioglitazone, glimepiride, and glimepiride plus metformin.")
30
Dosage and Administration
Usual Dosing for JANUVIA™ (sitagliptin)a The recommended dose of JANUVIA is 100 mg once a day Patients With Renal Insufficiencya,b 50 mg once a day 25 mg once a day Moderate Severe and ESRD CrCl 30 to <50 mL/min (~Serum Cr levels [mg/dL] Men: >1.7–≤3.0; Women: >1.5–≤2.5) CrCl <30 mL/min Men: >3.0; Women: >2.5; or on dialysis) Dosage and Administration This slide shows the recommended dosage and administration of JANUVIA™ (sitagliptin) in patients with type 2 diabetes. The recommended dose of JANUVIA is 100 mg once daily. JANUVIA can be taken with or without food. For patients with mild renal insufficiency (CrCl 50 mL/min, approximately corresponding to serum creatinine levels of ≤1.7 mg/dL in men and ≤1.5 mg/dL in women), no dosage adjustment for JANUVIA is required. For patients with moderate renal insufficiency (CrCl 30 to <50 mL/min, approximately corresponding to serum creatinine levels of >1.7 to ≤3.0 mg/dL in men and >1.5 to ≤2.5 mg/dL in women), the dosage of JANUVIA is 50 mg once a day. For patients with severe renal insufficiency (CrCl <30 mL/min, approximately corresponding to serum creatinine levels of >3.0 mg/dL in men and >2.5 mg/dL in women) or with end-stage renal disease (ESRD) requiring hemodialysis or peritoneal dialysis, the dosage of JANUVIA is 25 mg once a day. JANUVIA may be administered without regard to the timing of hemodialysis. Because there is a need for dosage adjustment based on renal function, assessment of renal function is recommended before JANUVIA is initiated and periodically thereafter. Creatinine clearance can be estimated from serum creatinine using the Cockcroft-Gault formula. Assessment of renal function is recommended before initiation of JANUVIA and periodically thereafter. aJANUVIA can be taken with or without food. bPatients with mild renal insufficiency—100 mg once a day. ESRD=end-stage renal disease requiring hemodialysis or peritoneal dialysis; CrCl=creatinine clearance.
a. The recommended dose of JANUVIA is 100 mg once a day. Patients With Renal Insufficiencya,b. 50 mg once a day. 25 mg once a day. Moderate. Severe and ESRD. CrCl 30 to <50 mL/min. (~Serum Cr levels [mg/dL] Men: >1.7–≤3.0; Women: >1.5–≤2.5) CrCl <30 mL/min. Men: >3.0; Women: >2.5; or on dialysis) Dosage and Administration This slide shows the recommended dosage and administration of JANUVIA™ (sitagliptin) in patients with type 2 diabetes. The recommended dose of JANUVIA is 100 mg once daily. JANUVIA can be taken with or without food. For patients with mild renal insufficiency (CrCl 50 mL/min, approximately corresponding to serum creatinine levels of ≤1.7 mg/dL in men and ≤1.5 mg/dL in women), no dosage adjustment for JANUVIA is required. For patients with moderate renal insufficiency (CrCl 30 to <50 mL/min, approximately corresponding to serum creatinine levels of >1.7 to ≤3.0 mg/dL in men and >1.5 to ≤2.5 mg/dL in women), the dosage of JANUVIA is 50 mg once a day. For patients with severe renal insufficiency (CrCl <30 mL/min, approximately corresponding to serum creatinine levels of >3.0 mg/dL in men and >2.5 mg/dL in women) or with end-stage renal disease (ESRD) requiring hemodialysis or peritoneal dialysis, the dosage of JANUVIA is 25 mg once a day. JANUVIA may be administered without regard to the timing of hemodialysis. Because there is a need for dosage adjustment based on renal function, assessment of renal function is recommended before JANUVIA is initiated and periodically thereafter. Creatinine clearance can be estimated from serum creatinine using the Cockcroft-Gault formula. Assessment of renal function is recommended before initiation of JANUVIA and periodically thereafter. aJANUVIA can be taken with or without food. bPatients with mild renal insufficiency—100 mg once a day. ESRD=end-stage renal disease requiring hemodialysis or peritoneal dialysis; CrCl=creatinine clearance.")
31
Contraindications/Warnings and Precautions
History of a serious hypersensitivity reaction to sitagliptin, such as anaphylaxis or angioedema Warnings and Precautions Use in patients with renal insufficiency: Dosage adjustment is recommended in patients with moderate or severe renal insufficiency and in patients with ESRD requiring hemodialysis or peritoneal dialysis. Assessment of renal function is recommended prior to initiating JANUVIA™ (sitagliptin) and periodically thereafter. Use with medications known to cause hypoglycemia: As is typical with other antihyperglycemic agents used in combination with a sulfonylurea, when JANUVIA was used in combination with a sulfonylurea, a class of medications known to cause hypoglycemia, the incidence of hypoglycemia was increased over that of placebo. Therefore, a lower dose of sulfonylurea may be required to reduce the risk of hypoglycemia. Contraindications/Warnings and Precautions Contraindications History of a serious hypersensitivity reaction to sitagliptin, such as anaphylaxis or angioedema Warnings and Precautions Use in patients with renal insufficiency: Dosage adjustment is recommended in patients with moderate or severe renal insufficiency and in patients with ESRD requiring hemodialysis or peritoneal dialysis. Assessment of renal function is recommended prior to initiating JANUVIA™ (sitagliptin) and periodically thereafter. Use with medications known to cause hypoglycemia: As is typical with other antihyperglycemic agents used in combination with a sulfonylurea, when JANUVIA was used in combination with a sulfonylurea, a class of medications known to cause hypoglycemia, the incidence of hypoglycemia was increased over that of placebo. Therefore, a lower dose of sulfonylurea may be required to reduce the risk of hypoglycemia.
 and periodically thereafter. Use with medications known to cause hypoglycemia: As is typical with other antihyperglycemic agents used in combination with a sulfonylurea, when JANUVIA was used in combination with a sulfonylurea, a class of medications known to cause hypoglycemia, the incidence of hypoglycemia was increased over that of placebo. Therefore, a lower dose of sulfonylurea may be required to reduce the risk of hypoglycemia. Contraindications/Warnings and Precautions. Contraindications. History of a serious hypersensitivity reaction to sitagliptin, such as anaphylaxis or angioedema. Warnings and Precautions. Use in patients with renal insufficiency: Dosage adjustment is recommended in patients with moderate or severe renal insufficiency and in patients with ESRD requiring hemodialysis or peritoneal dialysis. Assessment of renal function is recommended prior to initiating JANUVIA™ (sitagliptin) and periodically thereafter. Use with medications known to cause hypoglycemia: As is typical with other antihyperglycemic agents used in combination with a sulfonylurea, when JANUVIA was used in combination with a sulfonylurea, a class of medications known to cause hypoglycemia, the incidence of hypoglycemia was increased over that of placebo. Therefore, a lower dose of sulfonylurea may be required to reduce the risk of hypoglycemia.")
32
Contraindications/Warnings and Precautions (cont)
Hypersensitivity reactions: There have been postmarketing reports of serious hypersensitivity reactions in patients treated with JANUVIA™ (sitagliptin). Reactions include anaphylaxis, angioedema, and exfoliative skin conditions including Stevens-Johnson syndrome. Because these reactions are reported voluntarily from a population of uncertain size, it is generally not possible to reliably estimate their frequency or establish a causal relationship to drug exposure. Onset of these reactions occurred within the first 3 months after initiation of treatment with JANUVIA, with some reports occurring after the first dose. If a hypersensitivity reaction is suspected, discontinue JANUVIA, assess for other potential causes for the event, and institute alternative treatment for diabetes. Contraindications/Warnings and Precautions (cont) Warnings and Precautions (cont) Hypersensitivity reactions There have been postmarketing reports of serious hypersensitivity reactions in patients treated with JANUVIA™ (sitagliptin). Reactions include anaphylaxis, angioedema, and exfoliative skin conditions including Stevens-Johnson syndrome. Because these reactions are reported voluntarily from a population of uncertain size, it is generally not possible to reliably estimate their frequency or establish a causal relationship to drug exposure. Onset of these reactions occurred within the first 3 months after initiation of treatment with JANUVIA, with some reports occurring after the first dose. If a hypersensitivity reaction is suspected, discontinue JANUVIA, assess for other potential causes for the event, and institute alternative treatment for diabetes. .
. Reactions include anaphylaxis, angioedema, and exfoliative skin conditions including Stevens-Johnson syndrome. Because these reactions are reported voluntarily from a population of uncertain size, it is generally not possible to reliably estimate their frequency or establish a causal relationship to drug exposure. Onset of these reactions occurred within the first 3 months after initiation of treatment with JANUVIA, with some reports occurring after the first dose. If a hypersensitivity reaction is suspected, discontinue JANUVIA, assess for other potential causes for the event, and institute alternative treatment for diabetes. Contraindications/Warnings and Precautions (cont) Warnings and Precautions (cont) Hypersensitivity reactions. There have been postmarketing reports of serious hypersensitivity reactions in patients treated with JANUVIA™ (sitagliptin). Reactions include anaphylaxis, angioedema, and exfoliative skin conditions including Stevens-Johnson syndrome. Because these reactions are reported voluntarily from a population of uncertain size, it is generally not possible to reliably estimate their frequency or establish a causal relationship to drug exposure. Onset of these reactions occurred within the first 3 months after initiation of treatment with JANUVIA, with some reports occurring after the first dose. If a hypersensitivity reaction is suspected, discontinue JANUVIA, assess for other potential causes for the event, and institute alternative treatment for diabetes. .")
33
Adverse Reactions The most common adverse reactions, reported regardless of investigator assessment of causality in ≥5% of patients treated with JANUVIA™ (sitagliptin) as monotherapy or in combination therapy and more commonly than in patients treated with placebo are: Upper respiratory tract infection Nasopharyngitis Headache. Hypoglycemia was also reported regardless of investigation assessment of causality more commonly in patients treated with the combination of JANUVIA and sulfonylurea, with or without metformin, than in patients given the combination of placebo and sulfonylurea, with or without metformin. Additional adverse reactions identified during postapproval use (reported voluntarily from a population of uncertain size) including: Hypersensitivity reactions include anaphylaxis, angioedema, rash, urticaria, and exfoliative skin conditions including Stevens-Johnson syndrome. Adverse Reactions The most common adverse reactions, reported regardless of investigator assessment of causality in ≥5% of patients treated with JANUVIA™ (sitagliptin) as monotherapy or in combination therapy and more commonly than in patients treated with placebo are: Upper respiratory tract infection Nasopharyngitis Headache Hypoglycemia was also reported more commonly in patients treated with the combination of JANUVIA and sulfonylurea, with or without metformin, than in patients given the combination of placebo and sulfonylurea, with or without metformin. Additional adverse reactions identified during postapproval use (reported voluntarily from a population of uncertain size): Hypersensitivity reactions include anaphylaxis, angioedema, rash, urticaria, and exfoliative skin conditions including Stevens-Johnson syndrome.
 as monotherapy or in combination therapy and more commonly than in patients treated with placebo are: Upper respiratory tract infection. Nasopharyngitis. Headache. Hypoglycemia was also reported regardless of investigation assessment of causality more commonly in patients treated with the combination of JANUVIA and sulfonylurea, with or without metformin, than in patients given the combination of placebo and sulfonylurea, with or without metformin. Additional adverse reactions identified during postapproval use (reported voluntarily from a population of uncertain size) including: Hypersensitivity reactions include anaphylaxis, angioedema, rash, urticaria, and exfoliative skin conditions including Stevens-Johnson syndrome. Adverse Reactions. The most common adverse reactions, reported regardless of investigator assessment of causality in ≥5% of patients treated with JANUVIA™ (sitagliptin) as monotherapy or in combination therapy and more commonly than in patients treated with placebo are: Upper respiratory tract infection. Nasopharyngitis. Headache. Hypoglycemia was also reported more commonly in patients treated with the combination of JANUVIA and sulfonylurea, with or without metformin, than in patients given the combination of placebo and sulfonylurea, with or without metformin. Additional adverse reactions identified during postapproval use (reported voluntarily from a population of uncertain size): Hypersensitivity reactions include anaphylaxis, angioedema, rash, urticaria, and exfoliative skin conditions including Stevens-Johnson syndrome.")
34
Initial Combination With Sitagliptin Plus Metformin Study: Design
Week 24 Patients Not Using OHA or Monotherapy or Low-Dose OHA Combination Placebo Eligible if A1C 7.5%–11% Sitagliptin 100 mg qd Metformin 500 mg bid Metformin 1,000 mg bid Single-Blind Placebo Run-in Period Screening Period Diet and Exercise Run-In Period R Initial Combination Therapy With Sitagliptin Plus Metformin Study: Design This was a multinational, randomized, double-blind, placebo-controlled study. At screening: Patients with an A1C of 7.5% to 11% and not on an oral antihyperglycemic agent (OHA) for ≥8 weeks were eligible to directly enter a 2-week, single-blind, placebo run-in period. Patients with an A1C of >11% and not on an OHA entered a diet and exercise run-in period of up to 6 weeks. Patients on an OHA with an A1C of 7% to 10.5% had the agent(s) discontinued and entered a washout period of 6 to 10 weeks (8–12 weeks for those on thiazolidinediones).1 After the run-in period, patients with an A1C of 7.5% to 11% entered a 2-week, single-blind, placebo run-in period. All patients with adequate compliance during the placebo run-in period were randomly assigned to one of six treatment regimens for 24 weeks. Patients who met nonglycemic eligibility criteria but who had an A1C >11% or a fasting glucose value >280 mg/dL after the run-in period were not eligible for randomization; these patients could participate in an open-label substudy and were treated with sitagliptin 50 mg/metformin 1,000 mg twice daily for 24 weeks.1 Sitagliptin 50 mg/ Metformin 500 mg bid Purpose To provide an overview of a initial combination study of sitagliptin with metformin. Takeaway Sitagliptin was evaluated as initial combination therapy in a large, randomized, double-blind, placebo-controlled study. If on OHA: discontinue therapy Sitagliptin 50 mg/ Metformin 1,000 mg bid Week –2 Day 1 OHA=oral antihyperglycemic; bid=twice a day. Goldstein B et al. Diabetes Care. 2007;30:1979–1987. Reference 1. Goldstein BJ, Feinglos MN, Lunceford JK, Johnson J, Williams-Herman DE; for the Sitagliptin 036 Study Group. Effect of initial combination therapy with sitagliptin, a dipeptidyl peptidase-4 inhibitor, and metformin on glycemic control in patients with type 2 diabetes. Diabetes Care. 2007;30:1979–1987.
 for ≥8 weeks were eligible to directly enter a 2-week, single-blind, placebo run-in period. Patients with an A1C of >11% and not on an OHA entered a diet and exercise run-in period of up to 6 weeks. Patients on an OHA with an A1C of 7% to 10.5% had the agent(s) discontinued and entered a washout period of 6 to 10 weeks (8–12 weeks for those on thiazolidinediones).1. After the run-in period, patients with an A1C of 7.5% to 11% entered a 2-week, single-blind, placebo run-in period. All patients with adequate compliance during the placebo run-in period were randomly assigned to one of six treatment regimens for 24 weeks. Patients who met nonglycemic eligibility criteria but who had an A1C >11% or a fasting glucose value >280 mg/dL after the run-in period were not eligible for randomization; these patients could participate in an open-label substudy and were treated with sitagliptin 50 mg/metformin 1,000 mg twice daily for 24 weeks.1. Sitagliptin 50 mg/ Metformin 500 mg bid. Purpose. To provide an overview of a initial combination study of sitagliptin with metformin. Takeaway. Sitagliptin was evaluated as initial combination therapy in a large, randomized, double-blind, placebo-controlled study. If on OHA: discontinue therapy. Sitagliptin 50 mg/ Metformin 1,000 mg bid. Week –2. Day 1. OHA=oral antihyperglycemic; bid=twice a day. Goldstein B et al. Diabetes Care. 2007;30:1979–1987. Reference. 1. Goldstein BJ, Feinglos MN, Lunceford JK, Johnson J, Williams-Herman DE; for the Sitagliptin 036 Study Group. Effect of initial combination therapy with sitagliptin, a dipeptidyl peptidase-4 inhibitor, and metformin on glycemic control in patients with type 2 diabetes. Diabetes Care. 2007;30:1979–1987.")
35
Initial Combination Therapy With Sitagliptin Plus Metformin Study: A1C Results
Placebo Metformin 1,000 mg bid Sitagliptin 100 mg qd Sitagliptin 50 mg bid + metformin 500 mg bid Metformin 500 mg bid Sitagliptin 50 mg bid + metformin 1,000 mg bid –0.5 LSM A1C Change From Baseline, % –1.0 Initial Combination Therapy With Sitagliptin Plus Metformin: A1C Results This slide demonstrates that after initial therapy with sitagliptin plus metformin, the A1C change from baseline was greater than that achieved when either agent was used alone. Initial combination therapy or maintenance of combination therapy may not be appropriate for all patients. These management options should be left to the discretion of the health care provider. –1.5 Purpose To demonstrate the A1C lowering efficacy of sitagliptin when used in initial combination with metformin. Takeaway Initial combination therapy of sitagliptin with metformin provides significantly greater decrease in A1C from baseline than achieved when either agent is used alone. –2.0 6 12 18 24 Week qd=once a day; bid=twice a day.

36
24-Week Placebo-Adjusted Results LSM A1C Change From Baseline, %
Initial Combination Therapy With Sitagliptin Plus Metformin Study: A1C Results 24-Week Placebo-Adjusted Results Mean A1C = 8.8% 0.5 Open label 117 –2.9a 0.0 n= 175 178 177 183 178 –0.5 Sitagliptin 100 mg qd –0.8 –1.0 –1.0 Metformin 500 mg bid –1.3 LSM A1C Change From Baseline, % –1.5 Metformin 1,000 mg bid –1.6 Initial Combination Therapy With Sitagliptin Plus Metformin Study: A1C Results This slide demonstrates that after initial therapy with sitagliptin plus metformin, the A1C change from baseline was greater than that achieved when either agent was used alone.1 Mean reductions from baseline A1C were generally greater for patients with higher baseline A1C values.1 Initial combination therapy or maintenance of combination therapy may not be appropriate for all patients. These management options should be left to the discretion of the health care provider. –2.0 Sitagliptin 50 mg + metformin 500 mg bid –2.1 Purpose To demonstrate the A1C lowering efficacy of sitagliptin when used in initial combination with metformin. Takeaway Initial combination therapy of sitagliptin with metformin provides significantly greater decrease in A1C from baseline than achieved when either agent is used alone. –2.5 Sitagliptin 50 mg + metformin 1,000 mg bid –3.0 –3.5 aLSM change from baseline without adjustment for placebo. qd=once a day; bid=twice a day. Goldstein B et al. Diabetes Care. 2007;30:1979–1987. Reference 1. Goldstein BJ, Feinglos MN, Lunceford JK, Johnson J, Williams-Herman DE; for the Sitagliptin 036 Study Group. Effect of initial combination therapy with sitagliptin, a dipeptidyl peptidase-4 inhibitor, and metformin on glycemic control in patients with type 2 diabetes. Diabetes Care. 2007;30:1979–1987.

37
Initial Combination Therapy With Sitagliptin Plus Metformin Study: FPG and PPG Results
24-Week Placebo-Adjusted Results Sitagliptin 100 mg qd Metformin 500 mg bid Metformin 1,000 mg bid Sitagliptin 50 mg + metformin 500 mg bid Sitagliptin 50 mg + metformin 1,000 mg bid FPG Mean baseline level: 197–205 mg/dL 2-h PPG Mean baseline level: 283–293 mg/dL n=178 n=179 n=179 n=183 n=180 n=136 n=141 n=138 n=147 n=152 –25 –25 –23a –50 LSM FPG Change, mg/dLb –33a LSM PPG Change, mg/dLb –35a –52a –54a Initial Combination Therapy With Sitagliptin Plus Metformin Study: FPG and PPG Results This was a 24-week, randomized, double-blind, placebo-controlled study evaluating the efficacy of sitagliptin when administered as initial combination with metformin for patients whose diabetes was inadequately controlled on diet and exercise.1 This slide shows the results of glycemic parameters at 24 weeks for combination therapy with sitagliptin and metformin as initial therapy. Sitagliptin and metformin provided significant improvements in FPG and 2-hour PPG compared with metformin monotherapy: FPG: –20 mg/dL to –35 mg/dL, P<0.001 relative to placebo PPG: –39 mg/dL, P<0.001 vs placebo1 –75 –50 –78a Purpose To demonstrate the mean FPG and 2-hour PPG reductions at 24 weeks in the initial combination therapy with sitagliptin and metformin study. Takeaway Sitagliptin combined with metformin provided significant improvements in mean FPG and 2-hour PPG vs metformin monotherapy in patients whose diabetes was inadequately controlled on diet and exercise. –53a –100 –93a –75 –70a –125 –117a aLSM adjusted for baseline value. bDifference from placebo. Goldstein B et al. Diabetes Care. 2007;30:1979–1987. Reference 1. Goldstein BJ, Feinglos MN, Lunceford JK, Johnson J, Williams-Herman DE; for the Sitagliptin 036 Study Group. Effect of initial combination therapy with sitagliptin, a dipeptidyl peptidase-4 inhibitor, and metformin on glycemic control in patients with type 2 diabetes. Diabetes Care. 2007;30:1979–1987.

38
Initial Combination Therapy With Sitagliptin Plus Metformin Study: Percentage of Patients Achieving <7% A1C at 24 Weeks Sitagliptin 50 mg + metformin 1,000 mg bid Metformin 1,000 mg bid Sitagliptin 100 mg qd Sitagliptin 50 mg + metformin 500 mg bid Metformin 500 mg bid Placebo 70 66a 60 50 44a 43a 38 To Goal, % 40 30 Initial Combination Therapy With Sitagliptin Plus Metformin Study: Percentage of Patients Achieving <7% A1C at 24 Weeks This slide shows that significantly more patients receiving combination therapy achieved A1C goals than did those receiving monotherapy (P<0.01).1 20 22a 23 20 20 Purpose To demonstrate the percentage of patients achieving A1C goals in initial combination therapy study. Takeaway Significantly more patients receiving initial combination therapy achieved A1C goals (<6.5% or < 7%) than did those receiving monotherapy. 10 9 9 10 2 165 175 178 177 183 178 165 175 178 177 183 178 A1C <6.5% A1C <7% aP<0.01 vs monotherapy. Goldstein B et al. Diabetes Care. 2007;30:1979–1987. Reference 1. Goldstein BJ, Feinglos MN, Lunceford JK, Johnson J, Williams-Herman DE; for the Sitagliptin 036 Study Group. Effect of initial combination therapy with sitagliptin, a dipeptidyl peptidase-4 inhibitor, and metformin on glycemic control in patients with type 2 diabetes. Diabetes Care. 2007;30:1979–1987.
 a Purpose. To demonstrate the percentage of patients achieving A1C goals in initial combination therapy study. Takeaway. Significantly more patients receiving initial combination therapy achieved A1C goals (<6.5% or < 7%) than did those receiving monotherapy A1C <6.5% A1C <7% aP<0.01 vs monotherapy. Goldstein B et al. Diabetes Care. 2007;30:1979–1987. Reference. 1. Goldstein BJ, Feinglos MN, Lunceford JK, Johnson J, Williams-Herman DE; for the Sitagliptin 036 Study Group. Effect of initial combination therapy with sitagliptin, a dipeptidyl peptidase-4 inhibitor, and metformin on glycemic control in patients with type 2 diabetes. Diabetes Care. 2007;30:1979–1987.")
39
Initial Combination Therapy With Sitagliptin Plus Metformin Study: Change in Body Weight and Incidence of Hypoglycemia Sitagliptin 50 mg + metformin 1,000 mg bid Metformin 1,000 mg bid Sitagliptin 100 mg qd Sitagliptin 50 mg + metformin 500 mg bid Metformin 500 mg bid Placebo 1 LSM Change From Baseline, kg Rates of Hypoglycemia in Combination With Sitagliptin Placebo Sita 100 MF bid MF 1,000 bid Sita 50 + MF 500 bid Hypoglycemia n/N (%) 1/176 (0.6) 1/179 (0.6) 1/182 (0.5) 2/182 (1.1) 2/190 (1.1) 4/182 (2.2) 167 175 179 175 184 178 Initial Combination Therapy With Sitagliptin Plus Metformin Study: Changes in Body Weight and Incidence of Hypoglycemia After 24 weeks of therapy, significant reductions in body weight relative to baseline (–0.6 to –1.3 kg; P<0.05) were observed in all groups except those administered sitagliptin monotherapy, for whom no change in baseline (0.0 kg) was observed.1 The incidence of hypoglycemia was low and similar across treatment groups.1 –1 Purpose To demonstrate the effect of initial combination therapy with sitagliptin and metformin on weight gain and hypoglycemia at 24 weeks. Takeaway Initial combination therapy of sitagliptin and metformin had no effect on weight gain and was associated with a low incidence of hypoglycemia. –2 Sita=sitagliptin; MF=metformin. Goldstein B et al. Diabetes Care. 2007;30:1979–1987. Reference 1. Goldstein BJ, Feinglos MN, Lunceford JK, Johnson J, Williams-Herman DE; for the Sitagliptin 036 Study Group. Effect of initial combination therapy with sitagliptin, a dipeptidyl peptidase-4 inhibitor, and metformin on glycemic control in patients with type 2 diabetes. Diabetes Care. 2007;30:1979–1987.
 1/176 (0.6) 1/179 (0.6) 1/182 (0.5) 2/182 (1.1) 2/190 (1.1) 4/182 (2.2) Initial Combination Therapy With Sitagliptin Plus Metformin Study: Changes in Body Weight and Incidence of Hypoglycemia. After 24 weeks of therapy, significant reductions in body weight relative to baseline (–0.6 to –1.3 kg; P<0.05) were observed in all groups except those administered sitagliptin monotherapy, for whom no change in baseline (0.0 kg) was observed.1. The incidence of hypoglycemia was low and similar across treatment groups.1. –1. Purpose. To demonstrate the effect of initial combination therapy with sitagliptin and metformin on weight gain and hypoglycemia at 24 weeks. Takeaway. Initial combination therapy of sitagliptin and metformin had no effect on weight gain and was associated with a low incidence of hypoglycemia. –2. Sita=sitagliptin; MF=metformin. Goldstein B et al. Diabetes Care. 2007;30:1979–1987. Reference. 1. Goldstein BJ, Feinglos MN, Lunceford JK, Johnson J, Williams-Herman DE; for the Sitagliptin 036 Study Group. Effect of initial combination therapy with sitagliptin, a dipeptidyl peptidase-4 inhibitor, and metformin on glycemic control in patients with type 2 diabetes. Diabetes Care. 2007;30:1979–1987.")
40
Sitagliptin Monotherapy Studies: Design
discontinued Eligible if A1C 7% to 10% Eligible patients: On therapy or not on therapy ≥8 weeks Randomization Screening Diet/exercise run-in Double-blind treatment 7 weeks Washout 2 weeks Single-blind placebo 18 weeks1 or 24 weeks2 2 randomized, double-blind, placebo-controlled studies in patients with type 2 diabetes 18- and 24-week treatment periods (placebo or sitagliptin 100 mg or 200 mg once daily)1,2 Sitagliptin Monotherapy Studies: Design Two randomized, placebo-controlled, double-blind studies were conducted to evaluate the efficacy and safety of monotherapy with sitagliptin in patients with type 2 diabetes and inadequate glycemic control. In 2 multinational studies, one lasting 18 weeks (N=521) and one lasting 24 weeks (N=741), patients received either placebo or sitagliptin 100 mg or 200 mg once daily. Overall, the 200-mg daily dose did not provide greater glycemic efficacy than the 100-mg daily dose. For this reason, this presentation only will focus only on the 100-mg dose. Patients 18 to 75 years who had inadequate glycemic control (defined as A1C 7%–10%) on diet and exercise were eligible for enrollment. Additional inclusion criteria included no antihyperglycemic agent for ≥8 weeks; on a single antihyperglycemic agent; or on a low-dose, dual, oral combination therapy. In both the 18-week and 24-week monotherapy studies, patients taking an antihyperglycemic agent stopped taking it and underwent a diet, exercise, and drug washout period of about 7 weeks. Patients with inadequate glycemic control after the washout period were randomized to treatments after completing a 2-week, single-blind, placebo run-in period. Patients not taking antihyperglycemic agents (off therapy for at least weeks) with inadequate glycemic control were also randomized after completing the 2-week, single-blind, placebo run-in period. Primary end points of each study were change in A1C levels from baseline compared with placebo and safety and tolerability. Purpose To provide an overview of two phase 3 monotherapy studies for sitagliptin. Takeaway The efficacy of sitagliptin was evaluated in 18-week and 24-week placebo-controlled studies in patients with mild to moderate hyperglycemia who were either previously treated or not on therapy ≥8 weeks. 1. Raz I et al. Diabetologia. 2006;49:2564–2571. 2. Aschner P et al. Diabetes Care. 2006;29:2632–2637. References 1. Raz I, Hanefeld M, Xu L, Caria C, Williams-Herman D, Khatami H; for Sitagliptin 023 Study Group. Efficacy and safety of the dipeptidyl peptidase-4 inhibitor sitagliptin as monotherapy in patients with type 2 diabetes mellitus. Diabetologia. 2006;49:2564–2571. 2. Aschner P, Kipnes MS, Lunceford JK, Sanchez M, Mickel C, Williams-Herman DE; for the Sitagliptin Study 021 Group. Effect of the dipeptidyl peptidase-4 inhibitor sitagliptin as monotherapy on glycemic control in patients with type 2 diabetes. Diabetes Care. 2006;29:2632–2637.
1,2. Sitagliptin Monotherapy Studies: Design. Two randomized, placebo-controlled, double-blind studies were conducted to evaluate the efficacy and safety of monotherapy with sitagliptin in patients with type 2 diabetes and inadequate glycemic control. In 2 multinational studies, one lasting 18 weeks (N=521) and one lasting 24 weeks (N=741), patients received either placebo or sitagliptin 100 mg or 200 mg once daily. Overall, the 200-mg daily dose did not provide greater glycemic efficacy than the 100-mg daily dose. For this reason, this presentation only will focus only on the 100-mg dose. Patients 18 to 75 years who had inadequate glycemic control (defined as A1C 7%–10%) on diet and exercise were eligible for enrollment. Additional inclusion criteria included no antihyperglycemic agent for ≥8 weeks; on a single antihyperglycemic agent; or on a low-dose, dual, oral combination therapy. In both the 18-week and 24-week monotherapy studies, patients taking an antihyperglycemic agent stopped taking it and underwent a diet, exercise, and drug washout period of about 7 weeks. Patients with inadequate glycemic control after the washout period were randomized to treatments after completing a 2-week, single-blind, placebo run-in period. Patients not taking antihyperglycemic agents (off therapy for at least 8 weeks) with inadequate glycemic control were also randomized after completing the 2-week, single-blind, placebo run-in period. Primary end points of each study were change in A1C levels from baseline compared with placebo and safety and tolerability. Purpose. To provide an overview of two phase 3 monotherapy studies for sitagliptin. Takeaway. The efficacy of sitagliptin was evaluated in 18-week and 24-week placebo-controlled studies in patients with mild to moderate hyperglycemia who were either previously treated or not on therapy ≥8 weeks. 1. Raz I et al. Diabetologia. 2006;49:2564– Aschner P et al. Diabetes Care. 2006;29:2632–2637. References. 1. Raz I, Hanefeld M, Xu L, Caria C, Williams-Herman D, Khatami H; for Sitagliptin 023 Study Group. Efficacy and safety of the dipeptidyl peptidase-4 inhibitor sitagliptin as monotherapy in patients with type 2 diabetes mellitus. Diabetologia. 2006;49:2564– Aschner P, Kipnes MS, Lunceford JK, Sanchez M, Mickel C, Williams-Herman DE; for the Sitagliptin Study 021 Group. Effect of the dipeptidyl peptidase-4 inhibitor sitagliptin as monotherapy on glycemic control in patients with type 2 diabetes. Diabetes Care. 2006;29:2632–2637.")
41
Sitagliptin Monotherapy Studies: A1C Reductions
Placebo-Adjusted Results Inclusion criteria A1C: 7%–10% Mean baseline A1C: 8.0% P < 0.001a Prespecified pooled analysis at 18 weekse Baseline A1C, % Overall < ≥8–< ≥9 0.0 0.0 –0.2 –0.2 –0.4 n=411d –0.4 –0.6 n=769d n=239d –0.6 Mean Change in A1C, %c n=193 –0.8 –0.7 –0.7 –0.6 Mean Change in A1C, % –0.6b –1.0 n=229 –0.8 Sitagliptin Monotherapy Studies: A1C Reductions Monotherapy with sitagliptin significantly reduced A1C compared with placebo.1,2 In the 18-week study, the average baseline A1C in the group treated with sitagliptin 100 mg was 8%. At week 18, patients receiving sitagliptin 100 mg achieved significant (P<0.001) placebo-subtracted A1C reductions (–0.6%) compared with those receiving placebo.1 In the 24-week study, the average baseline A1C in the group treated with sitagliptin 100 mg was 8%. At week 24, patients receiving sitagliptin 100 mg achieved significant (P<0.001) placebo-subtracted A1C reductions (–0.8%) compared with those receiving placebo.2 For both studies, the A1C-lowering effects of sitagliptin 100 mg were consistent across demographic, anthropometric, and disease characteristics subgroups.1,2 As is typical of agents used to treat type 2 diabetes, the mean response to sitagliptin appeared to be related to the degree of A1C elevation at baseline. In a pooled analysis of these monotherapy studies at week 18, the overall patient population demonstrated a 0.7% decrease in mean placebo-subtracted A1C. Additionally, in a prespecified subgroup analysis, the study showed that when patients were grouped by baseline A1C into those with mildly elevated A1C levels (<8%, n=411), moderately elevated A1C levels (≥8%–<9%, n=239), and highest elevated A1C levels (≥9%, n=119), mean placebo-subtracted reductions in A1C after 18 weeks were –0.6%, –0.7%, and –1.4%, respectively (P<0.001 overall and for treatment by subgroup interactions). –1.2 –0.8b n=119d Purpose To demonstrate the A1C reductions in the 2 trials of sitagliptin monotherapy and in a prespecified subgroup analysis by baseline A1C. Takeaway Monotherapy with sitagliptin significantly reduced A1C compared with placebo, and the magnitude of the mean response appeared to be related to the degree of A1C elevation at baseline. –1.4 –1.0 24-week monotherapy study2 (95% CI: –1.0, –0.6) 18-week monotherapy study1 (95% CI: –0.8, –0.4) –1.4 –1.6 –1.8 aCompared with placebo. bLeast squares mean (LSM) adjusted for prior antihyperglycemic therapy status and baseline value. cDifference from placebo. dCombined number of patients on sitagliptin or placebo. eP<0.001 overall and for treatment-by-subgroup interactions. CI, confidence interval. 1. Raz I et al. Diabetologia. 2006;49:2564–2571. 2. Aschner P et al. Diabetes Care. 2006;29:2632–2637. Study 021 and 023 References 1. Raz I, Hanefeld M, Xu L, Caria C, Williams-Herman D, Khatami H; for Sitagliptin 023 Study Group. Efficacy and safety of the dipeptidyl peptidase-4 inhibitor sitagliptin as monotherapy in patients with type 2 diabetes mellitus. Diabetologia. 2006;49:2564–2571. 2. Aschner P, Kipnes MS, Lunceford JK, Sanchez M, Mickel C, Williams-Herman DE; for the Sitagliptin Study 021 Group. Effect of the dipeptidyl peptidase-4 inhibitor sitagliptin as monotherapy on glycemic control in patients with type 2 diabetes. Diabetes Care. 2006;29:2632–2637.
 placebo-subtracted A1C reductions (–0.6%) compared with those receiving placebo.1. In the 24-week study, the average baseline A1C in the group treated with sitagliptin 100 mg was 8%. At week 24, patients receiving sitagliptin 100 mg achieved significant (P<0.001) placebo-subtracted A1C reductions (–0.8%) compared with those receiving placebo.2. For both studies, the A1C-lowering effects of sitagliptin 100 mg were consistent across demographic, anthropometric, and disease characteristics subgroups.1,2. As is typical of agents used to treat type 2 diabetes, the mean response to sitagliptin appeared to be related to the degree of A1C elevation at baseline. In a pooled analysis of these monotherapy studies at week 18, the overall patient population demonstrated a 0.7% decrease in mean placebo-subtracted A1C. Additionally, in a prespecified subgroup analysis, the study showed that when patients were grouped by baseline A1C into those with mildly elevated A1C levels (<8%, n=411), moderately elevated A1C levels (≥8%–<9%, n=239), and highest elevated A1C levels (≥9%, n=119), mean placebo-subtracted reductions in A1C after 18 weeks were –0.6%, –0.7%, and –1.4%, respectively (P<0.001 overall and for treatment by subgroup interactions). –1.2. –0.8b. n=119d. Purpose. To demonstrate the A1C reductions in the 2 trials of sitagliptin monotherapy and in a prespecified subgroup analysis by baseline A1C. Takeaway. Monotherapy with sitagliptin significantly reduced A1C compared with placebo, and the magnitude of the mean response appeared to be related to the degree of A1C elevation at baseline. –1.4. – week monotherapy study2. (95% CI: –1.0, –0.6) 18-week monotherapy study1 (95% CI: –0.8, –0.4) –1.4. –1.6. –1.8. aCompared with placebo. bLeast squares mean (LSM) adjusted for prior antihyperglycemic therapy status and baseline value. cDifference from placebo. dCombined number of patients on sitagliptin or placebo. eP<0.001 overall and for treatment-by-subgroup interactions. CI, confidence interval. 1. Raz I et al. Diabetologia. 2006;49:2564– Aschner P et al. Diabetes Care. 2006;29:2632–2637. Study 021 and 023. References. 1. Raz I, Hanefeld M, Xu L, Caria C, Williams-Herman D, Khatami H; for Sitagliptin 023 Study Group. Efficacy and safety of the dipeptidyl peptidase-4 inhibitor sitagliptin as monotherapy in patients with type 2 diabetes mellitus. Diabetologia. 2006;49:2564– Aschner P, Kipnes MS, Lunceford JK, Sanchez M, Mickel C, Williams-Herman DE; for the Sitagliptin Study 021 Group. Effect of the dipeptidyl peptidase-4 inhibitor sitagliptin as monotherapy on glycemic control in patients with type 2 diabetes. Diabetes Care. 2006;29:2632–2637.")
42
LSM Change From Baseline, %
Initial Combination Therapy With Sitagliptin Plus Metformin Study: A1C Results From Patients not on Antihyperglycemic Therapy at Study Entry Placebo Sitagliptin 100 mg qd Metformin 500 mg bid Metformin 1,000 mg bid Sitagliptin 50 mg + metformin 500 mg bid Sitagliptin 50 mg + metformin 1,000 mg bid –0.2 n=83 –1.1 n=88 –1.1 n=90 n=87 –1.6 n=100 –1.9 n=86 –0.2 –0.4 –0.6 LSM Change From Baseline, % –0.8 –1.0 –1.2 Initial Combination Therapy With Sitagliptin Plus Metformin Study: A1C Results From Patients not on Antihyperglycemic Therapy at Study Entry Initial therapy with the combination of sitagliptin and metformin provided significant improvements in A1C in patients not on an antihyperglycemic agent at study entry. Considerations regarding initial treatment and subsequent management of type 2 diabetes should be left to the discretion of the health care provider. –1.4 –1.2 Purpose To demonstrate the A1C reductions in patients not on antihyperglycemic therapy at study entry. Takeaway Initial therapy with the combination of sitagliptin and metformin provided significant improvements in A1C in patients not on an antihyperglycemic therapy at study entry. –1.6 –1.8 –2.0 LSM=least squares mean change. Data available on request from Merck & Co., Inc. Study 036 Reference 1. Data available on request from Merck & Co., Inc., Professional Services-DAP, WP1-27, PO Box 4, West Point, PA

43
Glipizide-Controlled Sitagliptin Add-on to Metformin Noninferiority Study: Design
Patients with type 2 diabetes (on any monotherapy or dual combination with metformin) Noninferiority design Continue/start metformin monotherapy Week -2: Eligible if A1C 6.5% to 10% Mean baseline A1C: 7.65% Glipizide: 5 mg qd increased to 10 mg bid (held if premeal fingerstick glucose < 6.1 mmol/L or hypoglycemia) Day 1 Randomization Week 52 Screening Period Metformin monotherapy run-in period Double-blind treatment period: glipizide or sitagliptin 100 mg qd Glipizide-Controlled Sitagliptin Add-on to Metformin Noninferiority Study: Design This was a multicenter, double-blind, randomized study to evaluate the safety and efficacy of the addition of sitagliptin compared with sulfonylurea therapy in patients with type 2 diabetes with inadequate glycemic control on metformin monotherapy.1 The goal of the study was to compare the efficacy and safety of sitagliptin vs glipizide when added to the treatment regimen of patients with type 2 diabetes who had inadequate glycemic control on metformin.1 Baseline glycemic and disease characteristics were balanced between groups.1 Note: At any time during the study, glipizide could be down-titrated to prevent recurrent hypoglycemic events. Purpose To provide an overview of a noninferiority study of sitagliptin compared with glipizide. Takeaway Sitagliptin was evaluated relative to glipizide in patients inadequately controlled on metformin monotherapy. Single-blind placebo Metformin (stable dose >1,500 mg/day) Glipizide dosing Mean titrated dose 10 mg/day Per protocol, glipizide was kept constant except for down-titration if needed to prevent hypoglycemia Nauck MA, et al. Diabetes Obes Metab. 2007;9:194–205. Reference 1. Nauck MA, Meininger G, Sheng D, Terranella L, Stein PP; for the Sitagliptin Study 024 Group. Efficacy and safety of the dipeptidyl peptidase-4 inhibitor, sitagliptin, compared with the sulfonylurea, glipizide, in patients with type 2 diabetes inadequately controlled on metformin alone: a randomized, double-blind, non-inferiority trial. Diabetes Obes Metab. 2007;9:
 Noninferiority design. Continue/start. metformin. monotherapy. Week -2: Eligible if A1C. 6.5% to 10% Mean baseline A1C: 7.65% Glipizide: 5 mg qd increased to 10 mg bid (held if premeal fingerstick glucose < 6.1 mmol/L or hypoglycemia) Day 1. Randomization. Week 52. Screening. Period. Metformin monotherapy run-in period. Double-blind treatment period: glipizide or sitagliptin 100 mg qd. Glipizide-Controlled Sitagliptin Add-on to Metformin Noninferiority Study: Design. This was a multicenter, double-blind, randomized study to evaluate the safety and efficacy of the addition of sitagliptin compared with sulfonylurea therapy in patients with type 2 diabetes with inadequate glycemic control on metformin monotherapy.1. The goal of the study was to compare the efficacy and safety of sitagliptin vs glipizide when added to the treatment regimen of patients with type 2 diabetes who had inadequate glycemic control on metformin.1. Baseline glycemic and disease characteristics were balanced between groups.1. Note: At any time during the study, glipizide could be down-titrated to prevent recurrent hypoglycemic events. Purpose. To provide an overview of a noninferiority study of sitagliptin compared with glipizide. Takeaway. Sitagliptin was evaluated relative to glipizide in patients inadequately controlled on metformin monotherapy. Single-blind. placebo. Metformin (stable dose >1,500 mg/day) Glipizide dosing. Mean titrated dose 10 mg/day. Per protocol, glipizide was kept constant except for down-titration if needed to prevent hypoglycemia. Nauck MA, et al. Diabetes Obes Metab. 2007;9:194–205. Reference. 1. Nauck MA, Meininger G, Sheng D, Terranella L, Stein PP; for the Sitagliptin Study 024 Group. Efficacy and safety of the dipeptidyl peptidase-4 inhibitor, sitagliptin, compared with the sulfonylurea, glipizide, in patients with type 2 diabetes inadequately controlled on metformin alone: a randomized, double-blind, non-inferiority trial. Diabetes Obes Metab. 2007;9:")
44
Glipizide-Controlled Sitagliptin Add-on to Metformin Noninferiority Study: Glycemic Parameters (Intent-to-Treat)a Glycemic Parameters at Final Visit (Week 52) Sitagliptin 100 mg Glipizide A1C (%) N=576 N=559 Baseline (mean) 7.7 7.6 Change from baseline (adjusted meanb) –0.5 –0.6 FPG (mg/dL) N=583 N=568 166 164 –8 Glipizide-Controlled Sitagliptin Add-on to Metformin Noninferiority Study: Glycemic Parameters (Intent-to-Treat) Sitagliptin 100 mg once a day with metformin was similar (noninferior) to sulfonylurea (glipizide) with metformin in lowering A1C, the primary efficacy end point of the study. At week 52, the least squares mean (LSM) change from baseline in A1C was –0.5% and –0.6% for the sitagliptin and the glipizide groups, respectively, in the intent-to-treat population. A conclusion in favor of the noninferiority of sitagliptin to glipizide may be limited to patients with A1C comparable to those included in the study (>70% of patients had baseline A1C <8% and >90% had A1C <9%) Purpose To assess the efficacy and safety of sitagliptin compared with glipizide in patients whose type 2 diabetes inadequately controlled on metformin monotherapy. Takeaway Sitagliptin was noninferior to (similar to) glipizide when administered to patients whose type 2 diabetes was inadequately controlled on metformin monotherapy. aThe intent-to-treat analysis used the patients' last observation in the study before discontinuation. bLeast squares means adjusted for prior antihyperglycemic therapy status and baseline A1C value.
 Sitagliptin 100 mg. Glipizide. A1C (%) N=576. N=559. Baseline (mean) Change from baseline (adjusted meanb) –0.5. –0.6. FPG (mg/dL) N=583. N= –8. Glipizide-Controlled Sitagliptin Add-on to Metformin Noninferiority Study: Glycemic Parameters (Intent-to-Treat) Sitagliptin 100 mg once a day with metformin was similar (noninferior) to sulfonylurea (glipizide) with metformin in lowering A1C, the primary efficacy end point of the study. At week 52, the least squares mean (LSM) change from baseline in A1C was –0.5% and –0.6% for the sitagliptin and the glipizide groups, respectively, in the intent-to-treat population. A conclusion in favor of the noninferiority of sitagliptin to glipizide may be limited to patients with A1C comparable to those included in the study (>70% of patients had baseline A1C <8% and >90% had A1C <9%) Purpose. To assess the efficacy and safety of sitagliptin compared with glipizide in patients whose type 2 diabetes inadequately controlled on metformin monotherapy. Takeaway. Sitagliptin was noninferior to (similar to) glipizide when administered to patients whose type 2 diabetes was inadequately controlled on metformin monotherapy. aThe intent-to-treat analysis used the patients last observation in the study before discontinuation. bLeast squares means adjusted for prior antihyperglycemic therapy status and baseline A1C value.")
45
LSM A1C Change From Baseline, %
Glipizide-Controlled Sitagliptin Add-on to Metformin Noninferiority Study: A1C Results (Per-Protocol Population) 0.0 Glipizide Sitagliptin 100 mg –0.3 –0.6 LSM A1C Change From Baseline, % –0.9 Glipizide-Controlled Sitagliptin Add-on to Metformin Noninferiority Study: Glycemic Parameters (Per-Protocol Population) In the per-protocol population, sitagliptin 100 mg once a day with metformin was similar (noninferior) to sulfonylurea (glipizide) with metformin in lowering A1C, the primary efficacy end point of the study. At week 52, the least squares mean (LSM) change from baseline in A1C was –0.7% for both groups. A conclusion in favor of the noninferiority of JANUVIA to glipizide may be limited to patients with baseline A1C comparable to those included in the study (over 70% of patients had baseline A1C <8% and over 90% had A1C <9%) –1.2 Purpose To asses the efficacy and safety of sitagliptin compared with glipizide in patients whose type 2 diabetes inadequately controlled on metformin monotherapy. Takeaway Sitagliptin was noninferior to (similar to) glipizide when administered to patients whose type 2 diabetes was inadequately controlled on metformin monotherapy. –1.5 6 12 18 24 30 38 46 52 Week LSM=least squares mean.
 0.0. Glipizide. Sitagliptin 100 mg. –0.3. –0.6. LSM A1C Change From Baseline, % –0.9. Glipizide-Controlled Sitagliptin Add-on to Metformin Noninferiority Study: Glycemic Parameters (Per-Protocol Population) In the per-protocol population, sitagliptin 100 mg once a day with metformin was similar (noninferior) to sulfonylurea (glipizide) with metformin in lowering A1C, the primary efficacy end point of the study. At week 52, the least squares mean (LSM) change from baseline in A1C was –0.7% for both groups. A conclusion in favor of the noninferiority of JANUVIA to glipizide may be limited to patients with baseline A1C comparable to those included in the study (over 70% of patients had baseline A1C <8% and over 90% had A1C <9%) –1.2. Purpose. To asses the efficacy and safety of sitagliptin compared with glipizide in patients whose type 2 diabetes inadequately controlled on metformin monotherapy. Takeaway. Sitagliptin was noninferior to (similar to) glipizide when administered to patients whose type 2 diabetes was inadequately controlled on metformin monotherapy. – Week. LSM=least squares mean.")
46
Incidence of Hypoglycemia at 52 Weeks LSM Change From Baseline, kg
Glipizide-Controlled Sitagliptin Add-on to Metformin Noninferiority Study: Weight Change and Incidence of Hypoglycemia Glipizide Sitagliptin 100 mg Body Weight at 52 Weeks Incidence of Hypoglycemia at 52 Weeks P<0.001 n=411 LSM Change From Baseline, kg Incidence, % Glipizide-Controlled Sitagliptin Add-on to Metformin Noninferiority Study: Weight Change and Incidence of Hypoglycemia The graph on the left shows that sitagliptin 100 mg once a day with metformin induced a significant decrease in body weight at week 52 of the study (–1.5 kg), whereas glipizide with metformin induced a significant increase in body weight compared with baseline values (1.1 kg). The difference in body weight between sitagliptin 100 mg once a day with metformin and the glipizide with metformin treatment groups was significant (–2.5 kg, P<0.001). The graph on the right shows that sitagliptin 100 mg once a day with metformin was associated with a significantly lower incidence of hypoglycemic episodes than glipizide with metformin (5% vs 32%, respectively). The difference in hypoglycemia between the treatment group receiving sitagliptin 100 mg once a day with metformin and the treatment group receiving glipizide with metformin was significant (27%, P<0.001). Purpose To review some key safety and tolerability findings from the noninferiority study vs glipizide on a background of metformin. Takeaway Patients treated with sitagliptin experienced significant weight loss compared with patients treated with glipizide and a significantly lower rate of hypoglycemia compared with patients treated with glipizide. n=382 n=584 n=588 P<0.001 LSM=least squares mean. Adapted from Nauck et al. Diabetes Obes Metab. 2007;9:194–205. Reference 1. Nauck MA, Meininger G, Sheng D, Terranella L, Stein PP; for the Sitagliptin Study 024 Group. Efficacy and safety of the dipeptidyl peptidase-4 inhibitor, sitagliptin, compared with the sulfonylurea, glipizide, in patients with type 2 diabetes inadequately controlled on metformin alone: a randomized, double-blind, non-inferiority trial. Diabetes Obes Metab. 2007;9:
, whereas glipizide with metformin induced a significant increase in body weight compared with baseline values (1.1 kg). The difference in body weight between sitagliptin 100 mg once a day with metformin and the glipizide with metformin treatment groups was significant (–2.5 kg, P<0.001). The graph on the right shows that sitagliptin 100 mg once a day with metformin was associated with a significantly lower incidence of hypoglycemic episodes than glipizide with metformin (5% vs 32%, respectively). The difference in hypoglycemia between the treatment group receiving sitagliptin 100 mg once a day with metformin and the treatment group receiving glipizide with metformin was significant (27%, P<0.001). Purpose. To review some key safety and tolerability findings from the noninferiority study vs glipizide on a background of metformin. Takeaway. Patients treated with sitagliptin experienced significant weight loss compared with patients treated with glipizide and a significantly lower rate of hypoglycemia compared with patients treated with glipizide. n=382. n=584. n=588. P< LSM=least squares mean. Adapted from Nauck et al. Diabetes Obes Metab. 2007;9:194–205. Reference. 1. Nauck MA, Meininger G, Sheng D, Terranella L, Stein PP; for the Sitagliptin Study 024 Group. Efficacy and safety of the dipeptidyl peptidase-4 inhibitor, sitagliptin, compared with the sulfonylurea, glipizide, in patients with type 2 diabetes inadequately controlled on metformin alone: a randomized, double-blind, non-inferiority trial. Diabetes Obes Metab. 2007;9:")
47
Sitagliptin Add-on to Glimepiride With or Without Metformin Study: Design
Z T Patients with type 2 diabetes mellitus aged 18–75 years Placebo (n=219) Sitagliptin 100 mg once daily (n=222) Stratum 1 Glimepiride (≥4 mg/day) (n=212) Sitagliptin Add-on to Glimepiride With or Without Metformin Study: Design This was a multinational, randomized, double-blind, parallel-group study with a single-blind placebo run-in period followed by a double-blind placebo-controlled treatment period. At the screening visit, patients assigned to receive glimepiride alone (stratum 1) or glimepiride plus metformin (stratum 2) based on their oral antihyperglycemic regimen at the screening visit and their baseline A1C. Patients with A1C ≥7.5% to ≤10.5% who were already taking a stable dose of glimepiride (≥4–8 mg/day) alone or in combination with metformin (≥1,500–3,000 mg/day) for at least 10 weeks entered a 2-week, single-blind placebo run-in period. The following patient types discontinued their prior regimen and were switched to treatment with glimepiride with or without metformin Not on oral antihyperglycemic therapy with A1C ≥9%, Taking other oral antihyperglycemic monotherapy with A1C ≥7.5%, Taking other oral antihyperglycemic therapy in dual or triple therapy with A1C ≥6.5% to ≤10.5%1 Patients entered a dose titration period of up to 4 weeks and then a dose stabilization run-in period of up to 10 weeks. If A1C was ≥7.5% to ≤10.5% after the run-in period, patients entered a 2-week, single-blind placebo run-in period. Patients with adequate compliance (≥75%) during this placebo run-in period underwent baseline evaluations and were assigned randomly to the addition of either sitagliptin 100 mg once daily or placebo to ongoing stable doses of glimepiride, alone or in combination with metformin.1 Screening Period Stratum 2 Glimepiride + Metformin ≥1500 mg/day) (n=229) Purpose To provide an overview of a study evaluating sitagliptin as add-on therapy to a sulfonylurea. Takeaway Sitagliptin was evaluated in a large, randomized, double-blind, parallel-group study as add-on therapy to a sulfonylurea. Single-blind Placebo Double-Blind Week 0 Week 24 Continue/start regimen of glimepiride ± metformin Week –2 eligible if A1C 7.5%–10.5% Hermansen K et al. Diabetes Obes Metab. 2007;9:733–745. Reference 1. Hermansen K, Kipnes M, Luo E, Fanurik D, Khatami H, Stein P; for the Sitagliptin Study 035 Group. Efficacy and safety of the dipeptidyl peptidase-4 inhibitor, sitagliptin, in patients with type 2 diabetes mellitus inadequately controlled on glimepiride alone or on glimepiride and metformin. Diabetes Obes Metab. 2007;9:733–745.
 Sitagliptin 100 mg once daily (n=222) Stratum 1 Glimepiride (≥4 mg/day) (n=212) Sitagliptin Add-on to Glimepiride With or Without Metformin Study: Design. This was a multinational, randomized, double-blind, parallel-group study with a single-blind placebo run-in period followed by a double-blind placebo-controlled treatment period. At the screening visit, patients assigned to receive glimepiride alone (stratum 1) or glimepiride plus metformin (stratum 2) based on their oral antihyperglycemic regimen at the screening visit and their baseline A1C. Patients with A1C ≥7.5% to ≤10.5% who were already taking a stable dose of glimepiride (≥4–8 mg/day) alone or in combination with metformin (≥1,500–3,000 mg/day) for at least 10 weeks entered a 2-week, single-blind placebo run-in period. The following patient types discontinued their prior regimen and were switched to treatment with glimepiride with or without metformin. Not on oral antihyperglycemic therapy with A1C ≥9%, Taking other oral antihyperglycemic monotherapy with A1C ≥7.5%, Taking other oral antihyperglycemic therapy in dual or triple therapy with A1C ≥6.5% to ≤10.5%1. Patients entered a dose titration period of up to 4 weeks and then a dose stabilization run-in period of up to 10 weeks. If A1C was ≥7.5% to ≤10.5% after the run-in period, patients entered a 2-week, single-blind placebo run-in period. Patients with adequate compliance (≥75%) during this placebo run-in period underwent baseline evaluations and were assigned randomly to the addition of either sitagliptin 100 mg once daily or placebo to ongoing stable doses of glimepiride, alone or in combination with metformin.1. Screening. Period. Stratum 2 Glimepiride + Metformin ≥1500 mg/day) (n=229) Purpose. To provide an overview of a study evaluating sitagliptin as add-on therapy to a sulfonylurea. Takeaway. Sitagliptin was evaluated in a large, randomized, double-blind, parallel-group study as add-on therapy to a sulfonylurea. Single-blind. Placebo. Double-Blind. Week 0. Week 24. Continue/start. regimen of glimepiride. ± metformin. Week –2 eligible if. A1C 7.5%–10.5% Hermansen K et al. Diabetes Obes Metab. 2007;9:733–745. Reference. 1. Hermansen K, Kipnes M, Luo E, Fanurik D, Khatami H, Stein P; for the Sitagliptin Study 035 Group. Efficacy and safety of the dipeptidyl peptidase-4 inhibitor, sitagliptin, in patients with type 2 diabetes mellitus inadequately controlled on glimepiride alone or on glimepiride and metformin. Diabetes Obes Metab. 2007;9:733–745.")
48
24-Week Placebo-Adjusted Results
Sitagliptin Add-on to Glimepiride With or Without Metformin Study: A1C Results 24-Week Placebo-Adjusted Results 0.0 –0.1 –0.2 –0.3 –0.4 LSM A1C Change from Baseline, % –0.5 –0.6 –0.6a Sitagliptin Add-on to Glimepiride With or Without Metformin Study: A1C Results This slide demonstrates that, at 24 weeks of therapy, when sitagliptin was added-on to glimepiride alone or to glimiperide plus metformin, sitagliptin provided significant improvements in A1C. In patients treated with sitagliptin and glimepiride (stratum 1), sitagliptin led to a 0.6% placebo-subtracted reduction in A1C. In patients treated with sitagliptin plus glimepiride plus metformin (stratum 2), sitagliptin led to a placebo-subtracted A1C reduction of 0.9%. In the entire cohort, sitagliptin plus glimepiride with or without metformin, there was a placebo-subtracted A1C reduction of 0.7%. –0.7 –0.7a Purpose To demonstrate mean placebo-adjusted A1C reductions from baseline for sitagliptin at 24 weeks in the entire cohort and the subset (stratum) of patients taking glimepiride alone and of those taking glimepiride in combination with metformin. Takeaway When used in combination with glimepiride or glimepiride plus metformin, sitagliptin provided significant improvements in A1C. –0.8 –0.9 –0.9a –1.0 Entire cohort (Sitagliptin + glimepiride ± metformin) Stratum 1 (sitagliptin + glimepiride) LSM=least squares mean. aP<0.001 vs placebo. Hermansen K et al. Diabetes Obes Metab. 2007;9:733–745. Stratum 2 (sitagliptin + glimepiride + metformin) Reference 1. Hermansen K, Kipnes M, Luo E, Fanurik D, Khatami H, Stein P; for the Sitagliptin Study 035 Group. Efficacy and safety of the dipeptidyl peptidase-4 inhibitor, sitagliptin, in patients with type 2 diabetes mellitus inadequately controlled on glimepiride alone or on glimepiride and metformin. Diabetes Obes Metab. 2007;9:733–745.
, sitagliptin led to a 0.6% placebo-subtracted reduction in A1C. In patients treated with sitagliptin plus glimepiride plus metformin (stratum 2), sitagliptin led to a placebo-subtracted A1C reduction of 0.9%. In the entire cohort, sitagliptin plus glimepiride with or without metformin, there was a placebo-subtracted A1C reduction of 0.7%. –0.7. –0.7a. Purpose. To demonstrate mean placebo-adjusted A1C reductions from baseline for sitagliptin at 24 weeks in the entire cohort and the subset (stratum) of patients taking glimepiride alone and of those taking glimepiride in combination with metformin. Takeaway. When used in combination with glimepiride or glimepiride plus metformin, sitagliptin provided significant improvements in A1C. –0.8. –0.9. –0.9a. –1.0. Entire cohort (Sitagliptin + glimepiride ± metformin) Stratum 1 (sitagliptin + glimepiride) LSM=least squares mean. aP<0.001 vs placebo. Hermansen K et al. Diabetes Obes Metab. 2007;9:733–745. Stratum 2 (sitagliptin + glimepiride + metformin) Reference. 1. Hermansen K, Kipnes M, Luo E, Fanurik D, Khatami H, Stein P; for the Sitagliptin Study 035 Group. Efficacy and safety of the dipeptidyl peptidase-4 inhibitor, sitagliptin, in patients with type 2 diabetes mellitus inadequately controlled on glimepiride alone or on glimepiride and metformin. Diabetes Obes Metab. 2007;9:733–745.")
49
LSM Change From Baseline, kg
Sitagliptin Add-on to Glimepiride With or Without Metformin Study: Change in Body Weight Change in Body Weight at 24 Weeksa Sitagliptin + glimepiride ± metformin Placebo + glimepiride ± metformin LSM Change From Baseline, kg Sitagliptin Add-on to Glimepiride With or Without Metformin Study: Change in Body Weight at Week 24 The addition of sitagliptin 100 mg to ongoing therapy with glimepiride, alone or in combination with metformin, was generally well tolerated. This slide shows the effect of sitagliptin on body weight after 24 weeks. When sitagliptin was used in combination with glimepiride with or without metformin, an increase in body weight (1.1 kg) was noted compared with placebo. Purpose To demonstrate the effect of sitagliptin on body weight compared with active placebo. Takeaway In this study, weight gain was observed in patients receiving sitagliptin plus glimepiride with or without metformin in comparison with patients receiving placebo in combination with glimepiride with or without metformin. P=0.016 LSM=least squares mean. aDifference in LSM change from baseline 1.1 kg. Hermansen K et al. Diabetes Obes Metab. 2007;9:733–745. Reference 1. Hermansen K, Kipnes M, Luo E, Fanurik D, Khatami H, Stein P; for the Sitagliptin Study 035 Group. Efficacy and safety of the dipeptidyl peptidase-4 inhibitor, sitagliptin, in patients with type 2 diabetes mellitus inadequately controlled on glimepiride alone or on glimepiride and metformin. Diabetes Obes Metab. 2007;9:733–745.
 was noted compared with placebo. Purpose. To demonstrate the effect of sitagliptin on body weight compared with active placebo. Takeaway. In this study, weight gain was observed in patients receiving sitagliptin plus glimepiride with or without metformin in comparison with patients receiving placebo in combination with glimepiride with or without metformin. P= LSM=least squares mean. aDifference in LSM change from baseline 1.1 kg. Hermansen K et al. Diabetes Obes Metab. 2007;9:733–745. Reference. 1. Hermansen K, Kipnes M, Luo E, Fanurik D, Khatami H, Stein P; for the Sitagliptin Study 035 Group. Efficacy and safety of the dipeptidyl peptidase-4 inhibitor, sitagliptin, in patients with type 2 diabetes mellitus inadequately controlled on glimepiride alone or on glimepiride and metformin. Diabetes Obes Metab. 2007;9:733–745.")
50
Sitagliptin Add-on to Glimepiride With or Without Metformin Study: Incidence of Hypoglycemia
Treatment Group N Overall n (%) Sitagliptin + Glimepiride ± Metformin 222 27 (12.2) Placebo + Glimepiride ± Metformin 219 4 (1.8) Sitagliptin Add-on to Glimepiride With or Without Metformin Study: Incidence of Hypoglycemia The addition of sitagliptin 100 mg to ongoing therapy with glimepiride and metformin was generally well tolerated. This slide shows the total number of hypoglycemic episodes. Purpose To discuss the prevalence of hypoglycemic events in patients receiving sitagliptin in combination with glimepiride and metformin. Takeaway As is generally observed when other antihyperglycemic agents are used in combination with a sulfonylurea, the incidence of hypoglycemia (compared with placebo) was increased when sitagliptin was added to glimepiride (27 episodes vs 4). As is typical with other antihyperglycemic agents used in combination with a sulfonylurea, when sitagliptin was used in combination with a sulfonylurea, the incidence of hypoglycemia was increased over that of placebo. Hermansen K et al. Diabetes Obes Metab. 2007;9:733–745. Reference 1. Hermansen K, Kipnes M, Luo E, Fanurik D, Khatami H, Stein P; for the Sitagliptin Study 035 Group. Efficacy and safety of the dipeptidyl peptidase-4 inhibitor, sitagliptin, in patients with type 2 diabetes mellitus inadequately controlled on glimepiride alone or on glimepiride and metformin. Diabetes Obes Metab. 2007;9:733–745.
 Sitagliptin + Glimepiride ± Metformin (12.2) Placebo + Glimepiride ± Metformin (1.8) Sitagliptin Add-on to Glimepiride With or Without Metformin Study: Incidence of Hypoglycemia. The addition of sitagliptin 100 mg to ongoing therapy with glimepiride and metformin was generally well tolerated. This slide shows the total number of hypoglycemic episodes. Purpose. To discuss the prevalence of hypoglycemic events in patients receiving sitagliptin in combination with glimepiride and metformin. Takeaway. As is generally observed when other antihyperglycemic agents are used in combination with a sulfonylurea, the incidence of hypoglycemia (compared with placebo) was increased when sitagliptin was added to glimepiride (27 episodes vs 4). As is typical with other antihyperglycemic agents used in combination with a sulfonylurea, when sitagliptin was used in combination with a sulfonylurea, the incidence of hypoglycemia was increased over that of placebo. Hermansen K et al. Diabetes Obes Metab. 2007;9:733–745. Reference. 1. Hermansen K, Kipnes M, Luo E, Fanurik D, Khatami H, Stein P; for the Sitagliptin Study 035 Group. Efficacy and safety of the dipeptidyl peptidase-4 inhibitor, sitagliptin, in patients with type 2 diabetes mellitus inadequately controlled on glimepiride alone or on glimepiride and metformin. Diabetes Obes Metab. 2007;9:733–745.")
51
Treatment Paradigm Challenge
Case Studies Group Discussion

52
Case Study: Mona (cont)
Female, 60 years old, obese Serum creatinine: 1.4 mg/dL A1C: 7.1% Treatment-naive for diabetes Antihypertensive therapy History of inflammatory bowel disease Recent myocardial infarction Case Study: Mona (cont) What treatment options would you consider? ? Treatment option(s):
 What treatment options would you consider Treatment option(s):")
53
Case Study: Archie (cont)
Male, 54 years old, obese Serum creatinine: 0.9 mg/dL A1C: 8.0% Has been receiving metformin ,000 mg twice a day for past 6 months Case Study: Archie (cont) What treatment options would you consider? ? Treatment option(s):
 What treatment options would you consider Treatment option(s):")
54
Case Study: Nancy (cont)
Female, 55 years old, obese Serum creatinine: 1.0 mg/dL A1C: 8.5% Treatment-naive for diabetes Mild edema Antihypertensive therapy Case Study: Nancy (cont) What treatment options would you consider? ? Treatment option(s):
 What treatment options would you consider Treatment option(s):")
55
Before prescribing JANUVIA™ (sitagliptin), please read the Prescribing Information available with this presentation. Merck & Co., Inc., does not recommend the use of any product in any manner different than as described in the Prescribing Information. Before prescribing JANUVIA™ (sitagliptin), please read the Prescribing Information, available with this presentation. Merck & Co., Inc., does not recommend the use of any product in any manner different than as described in the Prescribing Information. JANUVIA is a trademark of Merck & Co., Inc Copyright © 2007 Merck & Co., Inc. All rights reserved (1)-10/07-JAN Printed in USA. Minimum 10% Recycled Paper Januvia.com 55 JANUVIA is a trademark of Merck & Co., Inc Copyright © 2007 Merck & Co., Inc. All rights reserved (1)-10/07-JAN Printed in USA. Minimum 10% Recycled Paper Januvia.com
, please read the Prescribing Information, available with this presentation. Merck & Co., Inc., does not recommend the use of any product in any manner different than as described in the Prescribing Information. JANUVIA is a trademark of Merck & Co., Inc. Copyright © 2007 Merck & Co., Inc. All rights reserved (1)-10/07-JAN. Printed in USA. Minimum 10% Recycled Paper. Januvia.com. 55. JANUVIA is a trademark of Merck & Co., Inc. Copyright © 2007 Merck & Co., Inc. All rights reserved (1)-10/07-JAN. Printed in USA. Minimum 10% Recycled Paper. Januvia.com.")
Similar presentations

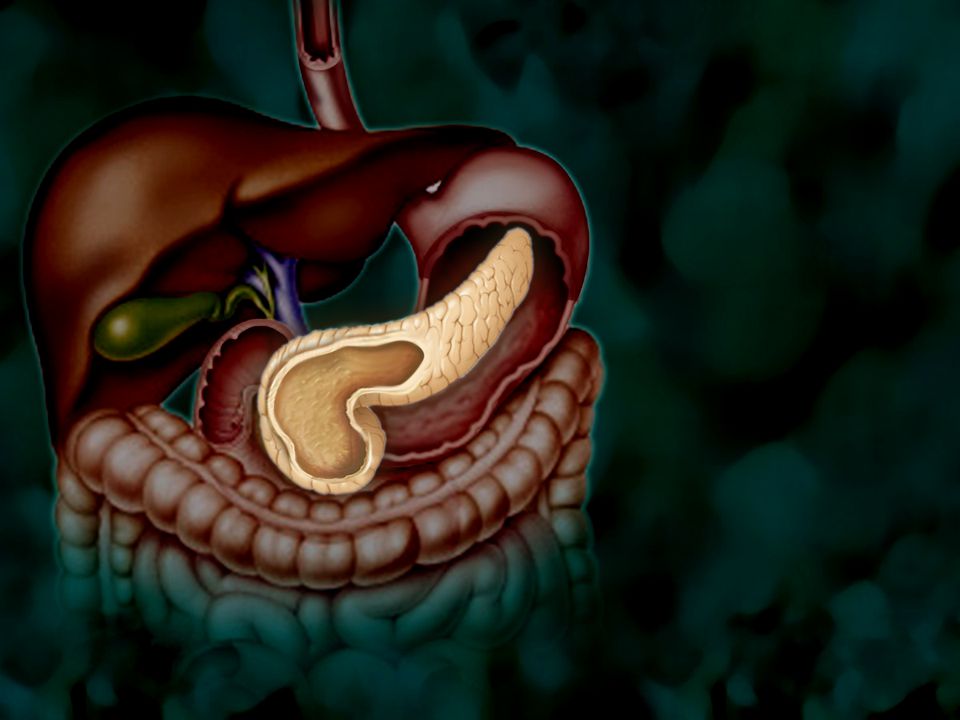


 8 : 20 ~ 8 : 50 B 棟 8 階カンファレンスルーム 薬剤部 TTSP 石井 英俊.>")

