Download presentation
Presentation is loading. Please wait.

1
1st year meeting --- Progress Report wp-2: Satellite observations of vegetation cover, of surface albedo and temperature over the Plateau Guangjian Yan State Key Laboratory of Remote Sensing Science, School of Geography, Beijing Normal University 2009-6-29

2
Objectives Develop algorithms to retrieve vegetation cover, LAI, surface albedo, emissivity and land surface temperatures from measurements by polar and/or geostationary satellites; Produce a consistent data set for the land surface variables over the region of Tibetan Plateau.

3
Partners LSIIT - Université Louis Pasteur (ULP) The International Institute for Geo-information Science and Earth Observation (ITC) Alterra Green World Research - Wageningen University and Research Centre (Alterra) University of Valencia(UVEG) Beijing Normal University(BNU) Institute of Geographic Sciences and Natural Resources Research (IGSNRR) Institute of Remote Sensing Applications(IRSA)
 The International Institute for Geo-information Science and Earth Observation (ITC) Alterra Green World Research - Wageningen University and Research Centre (Alterra) University of Valencia(UVEG) Beijing Normal University(BNU) Institute of Geographic Sciences and Natural Resources Research (IGSNRR) Institute of Remote Sensing Applications(IRSA)")
4
Tasks Task 2.1. A generic algorithm for the retrieval of important surface properties from a multitude satellite sensors (ULP, ITC, IRSA) Task 2.2 Developing an algorithm for simultaneous retrievals of atmospheric variables, land surface variables using AATSR bi- angular/multi-spectral radiometric observations (Alterra, IGSNRR). Task 2.3. Improving MODIS LAI and albedo products by combining remote sensing model and dynamic process model (BNU, IRSA) Task 2.4. Developing an algorithm to produce a consistent LST from polar satellites (LSIIT, UVEG, BNU, IGSNRR, IRSA). Task 2.5. Estimation of LSE, LST and albedo from Geostationary Satellite (GS) data (LSIIT, Alterra, IGSNRR)
 Task 2.2 Developing an algorithm for simultaneous retrievals of atmospheric variables, land surface variables using AATSR bi- angular/multi-spectral radiometric observations (Alterra, IGSNRR). Task 2.3. Improving MODIS LAI and albedo products by combining remote sensing model and dynamic process model (BNU, IRSA) Task 2.4. Developing an algorithm to produce a consistent LST from polar satellites (LSIIT, UVEG, BNU, IGSNRR, IRSA). Task 2.5. Estimation of LSE, LST and albedo from Geostationary Satellite (GS) data (LSIIT, Alterra, IGSNRR).")
5
Task 2.1. A generic algorithm for the retrieval of important surface properties from a multitude satellite sensors ModelAlgorithmdataparameter ★★ ★ Partly finished ★

6
Task 2.2. Developing an algorithm for simultaneous retrievals of atmospheric variables, land surface variables using AATSR data ModelAlgorithmdataparameter

7
Task 2.3. Improving MODIS LAI and albedo products by combining remote sensing model and dynamic process model ModelAlgorithmdataparameter ★★★ ★ Partly finished ★★

8
Task 2.4. Developing an algorithm to produce a consistent LST from polar satellites ModelAlgorithmdataparameter ★★ ★ Partly finished ★

9
Task 2.5. Estimation of LSE, LST and albedo from Geostationary Satellite (GS) data ModelAlgorithmdataparameter
 data ModelAlgorithmdataparameter.")
10
Main goals: measuring ice sheet mass balance, cloud and aerosol heights, land topography and vegetation characteristics. Organization:NASA Altitude:600km Launch:2003 Life time:5 years Payload:GLAS instrument Elevation retrieval - ICESat Facts

12
Greenland 5 km DEM

13
Processing steps Gaussian FittingPre-processingWaveform Dataset Normalization Conversion Bin-ASCII Counts-Voltage Smoothing GLA01 GLA14 Extraction of Elevation Points Initial estimation of Gaussians Gaussian Fitting Parameters Applications Parameters

14
Results of Gaussian decomposition Red:raw waveform Green: Gaussian components First mode: left most Gaussian component Last mode: right most

16
Angular&spectral kernel model to describe land surface BRDF Albedo retrieval using HJ-1 data Here,C 0 C g C v,are kernel coefficients independent from wavelength and stand for the weights of different scattering parts. They are all related to the structure of canopy or mixed pixel. Although all the kernel coefficients have clear physical meaning, they can also be treated as empirical parameters.

17
Compute the pixel-average slope and aspect angle for each 500m grid Compute the subpixel correction factor T for each 5km grid Compute the pixel-average slope and aspect angle for each 5km grid 90m resolution DEM over the Plateau Store the results in database Flow chart for setting up a database for topography effect correction.

18
500m/5km resolution direction reflectance from MODIS or HJ-1A/1B Correct the pixel level topography effect, using slope and aspect angle. Inversion of ASK BRDF model Derive spectral albedo and broadband albedo 500m/5km resolution topography corrected albedo Database of topographic parameters Flow chart for topography effect correction for 500m albedo products.

19
LAI retrieval -- a priori knowledge based inversion parameter space time series

20
NW5 NW4 NW3 NW2 NW1 Shunyi county, Beijing, 2001.

21
NW5 NW4 NW3 NW2 NW1 (using only red band ) (using only NIR band) LAI maps without VI-based a priori knowledge
 (using only NIR band) LAI maps without VI-based a priori knowledge")
22
NW5 NW4 NW3 NW2 NW1 (using 2 bands with VI-based a priori knowledge) (using both red and NIR but without VI- based a priori knowledge)
 (using both red and NIR but without VI- based a priori knowledge)")
23
Time series LAI retrieval by coupling crop growth model Relative leaf area index (RLAI: LAI/LAImax) from 865 ground measurements in Shunyi and Changping of Beijing were fitted with relative accumulation temperature (DVS). Empirical LOGISTIC model for crop growth

24
Time series LAI retrieval -- flowchart

25
Result Validation using ground measured LAI values in Shunyi, Beijing, 2001

26
LAI retrieval -- Data assimilation Developing a priori LAI trend from several years ’ MODIS LAI product the adaptive Savitzky-Golay filtering to eliminate the contaminated pixels. the SARIMA method is used to construct the dynamic model. The Ensemble Kalman Filter technique is discussed to estimate real-time LAI from time series MODIS reflectance data.

27
Adaptive Savitzky-Golay (SG)
")
28
NDVI temporal profiles with circles to mark the contaminated data

29
Dynamic model the following dynamic model is constructed based on the climatology to evolve LAI in time and used to provide the short-range forecast of LAI

30
Bondville Tonzi Ranch Linze Yingke

31
(MODIS+MISR)
")
32
Fractional vegetation cover retrieval – angular correction A general formula to calculate fCover A simple model for mixing pixles: 1-SS θ

33
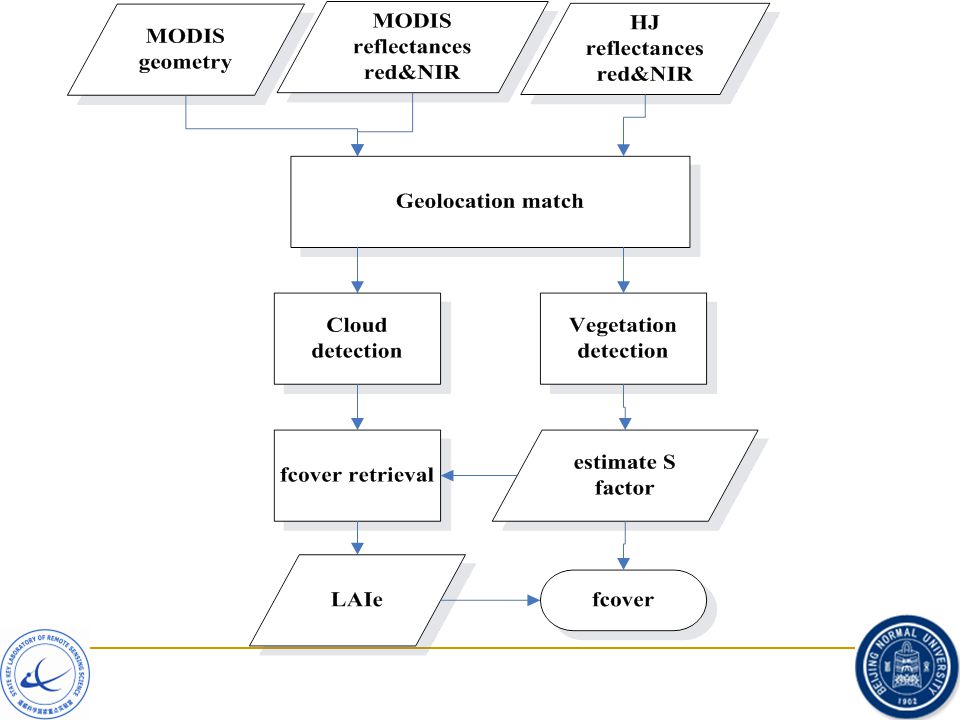
Model inversion using multitude remote sensing data with two spatial resolutions MODIS observations are used for their angular information Higher resolution images (HJ-1, TM) are used to get S solve equations for a, b, LAI e, then calculate fcover
 are used to get S solve equations for a, b, LAI e, then calculate fcover")
35
Study area (Heihe basin) Gebi desert Zhangye City
 Gebi desert Zhangye City")
36
Angular effects corrected fCover (Mar. 07 2009)
")
37
LAI and fCover generation using high resolution images To evaluate the uncertainty in the prediction of the biophysical variables (LAI and fCover) due to the coarse spatial resolution of the MODIS sensor by using high resolution optical data Particular relevance will be given to the temporal profile of LAI and fCover along the different seasons and according to the main and back-up MODIS algorithms.
 due to the coarse spatial resolution of the MODIS sensor by using high resolution optical data Particular relevance will be given to the temporal profile of LAI and fCover along the different seasons and according to the main and back-up MODIS algorithms.")
38
LAI and fCover estimation procedure High resolution LAI and fCover maps LUT based RTM inversion (PROSPECT+SAILH) High resolution TOC reflectance
 High resolution TOC reflectance")
39
Validation procedure Field measurements ? High resolution LAI and fCover maps Aggregated LAI and fCover maps Uncertainties assessment Comparison with MODIS LAI and fCover products More data available ?

40
Comparison: MODIS – high resolution data Probability density functions (pdf) of LAI and fCover estimated from high resolution data are determined for a sufficient number of MODIS pixels of different land use. Based on these analyses, uncertainty assessment of parameter retrievals is carried out separately for the four major native pasturelands, identified from the southeast to northwest: bush-meadow, alpine meadow, alpine grassland and desert grassland.

41
Physics-based Radiation Transfer Canopy Model for All Growth Stages LST retrieval -- Modeling Top view of the wheat canopy

42
a periodic function to discuss the mutual overlaps between the neighboring rows. simplify the row planted wheat canopy as foliage gather whose density is unchanged along row direction and in the vertical direction, and is changed gradually in the crossing-row direction.

44
Brightness temperature directional distribution simulated by the new model.

45
Directional thermal radiation from rugged terrain affect spatial distribution of vegetation obstruct sky radiance geometric effect on surface radiation shadowing effect increase environmental radiation temperature difference on shadowed and sunlit surfaces

46
A parameterization scheme for coarse resolution pixels 1 ) emitted radiation of surface 2 ) environmental and sky radiation calculate the statistics in a coarse pixel introduce an effective view angle average ratio that obstruction surroundings occupied in view hemisphere of surface averaged sky factor
 emitted radiation of surface 2 ) environmental and sky radiation calculate the statistics in a coarse pixel introduce an effective view angle average ratio that obstruction surroundings occupied in view hemisphere of surface averaged sky factor")
47
account for emitted directional radiation of a coarse pixel θ 1. S a simple model for angular anisotropy effect supposed L( θ ) has a linear relationship with cos, with Hapke formula (1993)
 has a linear relationship with cos, with Hapke formula (1993).")
48
parameterization for sky factor vd and terrain configuration factor C t slope S, azimuth A is the horizon angle for direction ( Dozier and Frew, 1990 )。 integrating over the coarse pixel pdf of elevation pdf of horizon angle H φ pdf of slope angle
。 integrating over the coarse pixel pdf of elevation pdf of horizon angle H φ pdf of slope angle")
49
preliminary validation error caused by simplized form of surface emitted radiance (K) error of radiance measured at surface (K) 1 、 Followed by a statistical parameterization scheme, a model was developed for remote sensing retrieval. 2 、 All the simplifications calculate statistics of the topographic effects exerted on radiative transfer. 3 、 The parameterized model cost much less time with an acceptable accuracy lost.

50
HJ-1 150m LST products was proposed by the IRSA/CAS as a daytime land product over the Tibet Plateau. A view angle dependent single channel LST algorithm has been developed for correcting atmospheric and emissivity effects for all land cover types. HJ satellite constellation LST retrieval using HJ-1 data CCD resolution : 30m bands : 0.43-0.52μm , 0.52-0.60μm , 0.63-0.69μm , 0.76-0.90μm swath : ≥700km IRS resolution : 150m ( NIR MIR ) /300m ( TIR ) bands : 0.75-1.10μm , 1.55-1.75μm , 3.50-3.90μm , 10.5-12.5μm swath : 720km
 /300m ( TIR ) bands : μm , μm , μm , μm swath : 720km.")
51
Supposing that the atmosphere is uniform on spherical surface and layered vertically, the atmospheric transmittance can be expressed as (Fan et al, 2007): where η is the path factor, R is the earth radius, s 0 is the atmosphere layer thickness, θ is the view zenith angle. (1) Obtaining the atmospheric parameters simulation results indicate that there are strong linear relationships between different L↑(θ) and L↑(0) (nadir view)
 Obtaining the atmospheric parameters simulation results indicate that there are strong linear relationships between different L↑(θ) and L↑(0) (nadir view).")
52
HJ-1 LST Plots of Atmospheric parameters against the water vapor content (a)atmospheric transmittance (b)atmospheric upwelling radiance (c)atmospheric downwelling radiance
atmospheric transmittance (b)atmospheric upwelling radiance (c)atmospheric downwelling radiance")
53
(2) Obtaining the land surface emissivity For HJ-1 IRS data we will use the NDVI method to estimate land surface emissivity. (3) Retrieving the land surface temperature HJ-1 LST
 Retrieving the land surface temperature HJ-1 LST.")
54
Validation related works

55
Ground-based LAI measurement methods comparison LAI-2000 Direct LAI measurement Indirect LAI measurement Digital Hemisphreical Photography (DHP)
")
56
The comparision of LAI2000 data and FishEye data with moving average fitting. Obviously , the variance of LAI2000 data is littler than that of Hemispherical photography data.

57
:is the woody-to-total area ratio, it was used to correct the woody components effects in LAI measurements. :the effective LAI :the needle-to-shoot area ratio :is the elements clumping index Indirect estimation of forest canopy LAI correct forest LAI by Multispectral Canopy Imager (MCI)
.")
58
1st year meeting --- Progress Report VIS NIR Classified image Sky fraction Woody components fraction Leafy fraction statistical methods for:

59
:the effective plant area index at zenith angle :the effective woody area index at zenith angle :the proportion of elements within the image :the proportion of woody components within the image Sky Fraction, Woody components Fraction, Leafy Fraction (VZN 0~90°interval 10°) : The effective PAI: The effective WAI: :the effective PAI at zenith angle :the weight at zenith angle
 : The effective PAI: The effective WAI: :the effective PAI at zenith angle :the weight at zenith angle")
60
Stand 1: 0.1909 Stand 10: 0.1798 α : 0.1816 :the woody area index :the plant area index

61
1st year meeting --- Progress Report Thank you!

Similar presentations


 Kirsten de Beurs.>")

. Why TRMM? n Tropical Rainfall Measuring Mission (TRMM) is a joint US-Japan study initiated in 1997 to study.>")


-Polar Orbiting Environmental Satellite (POES) Orbital characteristics.>")


 Lammert Kooistra Contact:>")

 realistic modeling of canopy.>")
