Download presentation
Presentation is loading. Please wait.

1
Water Quality Data Interpretation College Creek Case Study

6
Response of indicators to pollution or negative alterations IndicatorIncreaseDecrease Alkalinity Dissolved Oxygen Fecal Coliform Nitrates pH Temperature Total Suspended Solids Macroinverterbrates

7
Response of indicators to pollution or negative alterations IndicatorIncreaseDecrease AlkalinityX Dissolved OxygenX Fecal ColiformX NitratesX pHX TemperatureX Total Suspended SolidsX MacroinverterbratesAbundance Pollution tolerant species Diversity Pollution intolerant species

12
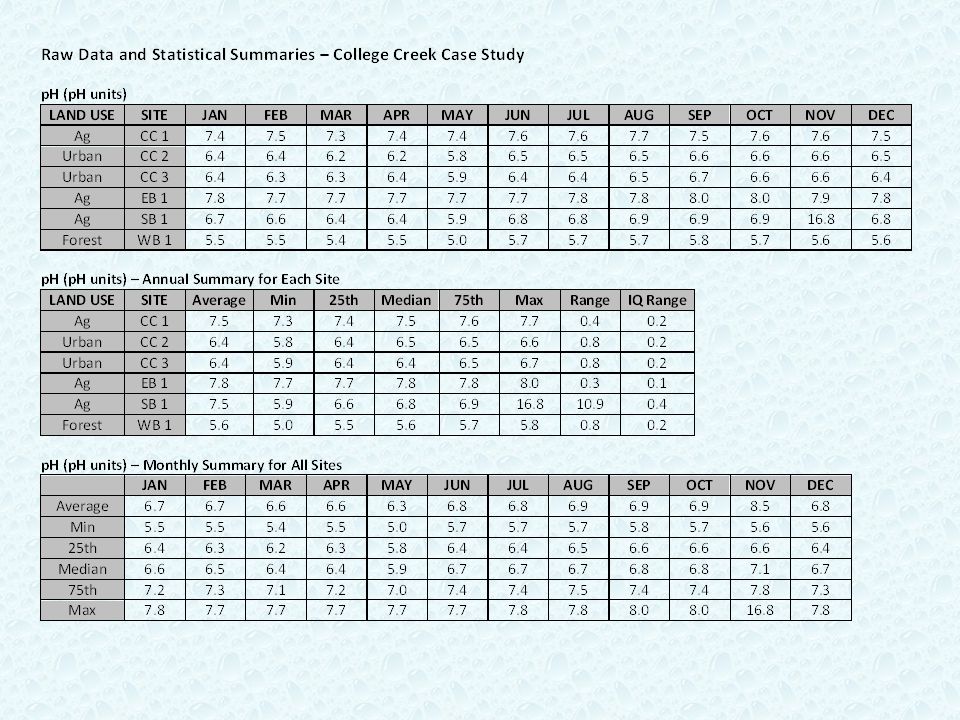
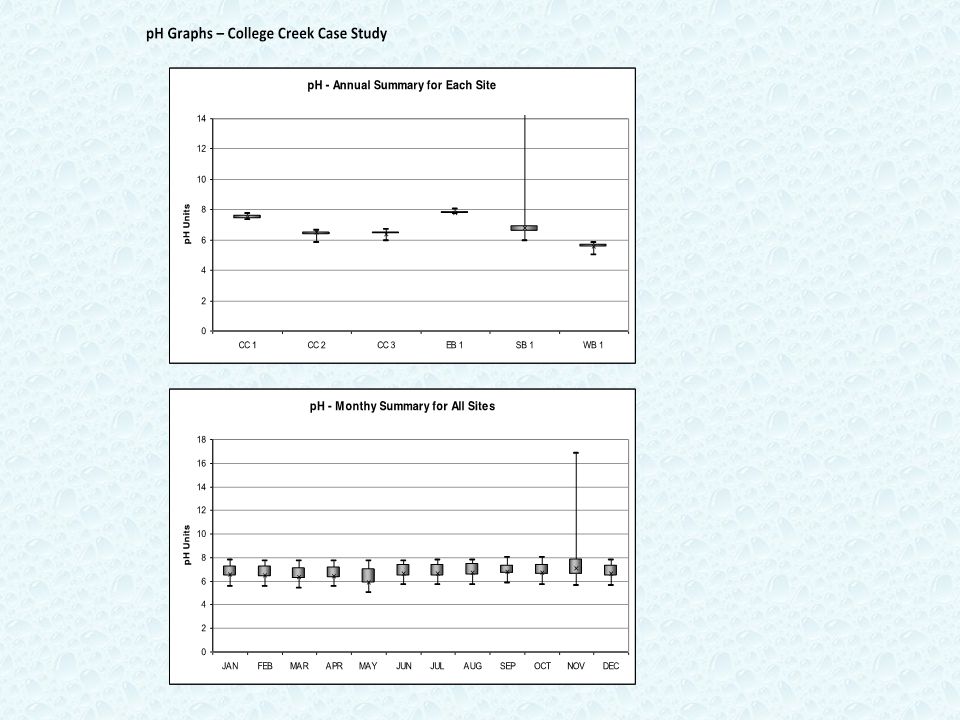
ParameterMin. ValueMin. SiteMin. Month Site with Lowest Values Overall Site with Highest Values Overall Site with Greatest IQ Range Can Sites be Grouped? Alkalinity (ppm) DO (ppm) pH
 DO (ppm) pH.")
15
ParameterMin. Value Min. Site Min. Month Site with Lowest Values Overall Site with Highest Values Overall Site with Greatest IQ Range Can Sites be Grouped? Alkalinity (ppm) 5.3WB1MayWB1 (18.3)EB1 (103.2)CC3 (19.2)CC1/EB1 (high) CC2/CC3/SB1 (low) WB1 (large range) DO (ppm) pH
 5.3WB1MayWB1 (18.3)EB1 (103.2)CC3 (19.2)CC1/EB1 (high) CC2/CC3/SB1 (low) WB1 (large range) DO (ppm) pH.")
18
ParameterMin. Value Min. Site Min. Month Site with Lowest Values Overall Site with Highest Values Overall Site with Greatest IQ Range Can Sites be Grouped? Alkalinity (ppm) 5.3WB1MayWB1 (18.3)EB1 (103.2)CC3 (19.2)CC1/EB1 (high) CC2/CC3/SB1 (low) WB1 (large range) DO (ppm) 3.0SB1May (annual min. in Aug!) CC3 (7.1)WB1 (12.0)SB1 (5.0)CC1/WB1 (high) CC2/EB1/SB1 (mid) WB1 (low) pH
 5.3WB1MayWB1 (18.3)EB1 (103.2)CC3 (19.2)CC1/EB1 (high) CC2/CC3/SB1 (low) WB1 (large range) DO (ppm) 3.0SB1May (annual min. in Aug!) CC3 (7.1)WB1 (12.0)SB1 (5.0)CC1/WB1 (high) CC2/EB1/SB1 (mid) WB1 (low) pH.")
21
ParameterMin. Value Min. Site Min. Month Site with Lowest Values Overall Site with Highest Values Overall Site with Greatest IQ Range Can Sites be Grouped? Alkalinity (ppm) 5.3WB1MayWB1 (18.3)EB1 (103.2)CC3 (19.2)CC1/EB1 (high) CC2/CC3/SB1 (low) WB1 (large range) DO (ppm) 3.0SB1May (annual min. in Aug!) CC3 (7.1)WB1 (12.0)SB1 (5.0)CC1/WB1 (high) CC2/EB1/SB1 (mid) WB1 (low) pH 5.0WB1MayWB1 (5.6)SB1 (16.8)* EB1 (8.0) SB1 (0.4)CC1/EB1 (high) CC2/CC3/SB1 (mid) WB1 (low)
 5.3WB1MayWB1 (18.3)EB1 (103.2)CC3 (19.2)CC1/EB1 (high) CC2/CC3/SB1 (low) WB1 (large range) DO (ppm) 3.0SB1May (annual min. in Aug!) CC3 (7.1)WB1 (12.0)SB1 (5.0)CC1/WB1 (high) CC2/EB1/SB1 (mid) WB1 (low) pH 5.0WB1MayWB1 (5.6)SB1 (16.8)* EB1 (8.0) SB1 (0.4)CC1/EB1 (high) CC2/CC3/SB1 (mid) WB1 (low).")
24
ParameterMax. Value Max. Site Max. Month Site with Highest Values Overall Site with Lowest Values Overall Site with Greatest IQ Range Can Sites be Grouped? Bacteria (FC) (col/100 ml) 320CC3Sept. (low flow) CC3 (145) SB1 (140) WB1 (0) Check! CC3 (175)CC3/SB1 (high)
 (col/100 ml) 320CC3Sept. (low flow) CC3 (145) SB1 (140) WB1 (0) Check. CC3 (175)CC3/SB1 (high).")
27
ParameterMax. Value Max. Site Max. Month Site with Highest Values Overall Site with Lowest Values Overall Site with Greatest IQ Range Can Sites be Grouped? Bacteria (FC) (col/100 ml) 320CC3Sept. (low flow) CC3 (145) SB1 (140) WB1 (0) Check! CC3 (175)CC3/SB1 (high) Nitrate (ppm) 17.2EB1May (high flow?) EB1 (8.7) SB1 (8.3) WB1 (0.1) Check! EB1 (2.8)EB1/SB1 (high) WB1 (low)
 (col/100 ml) 320CC3Sept. (low flow) CC3 (145) SB1 (140) WB1 (0) Check. CC3 (175)CC3/SB1 (high) Nitrate (ppm) 17.2EB1May (high flow ) EB1 (8.7) SB1 (8.3) WB1 (0.1) Check. EB1 (2.8)EB1/SB1 (high) WB1 (low).")
30
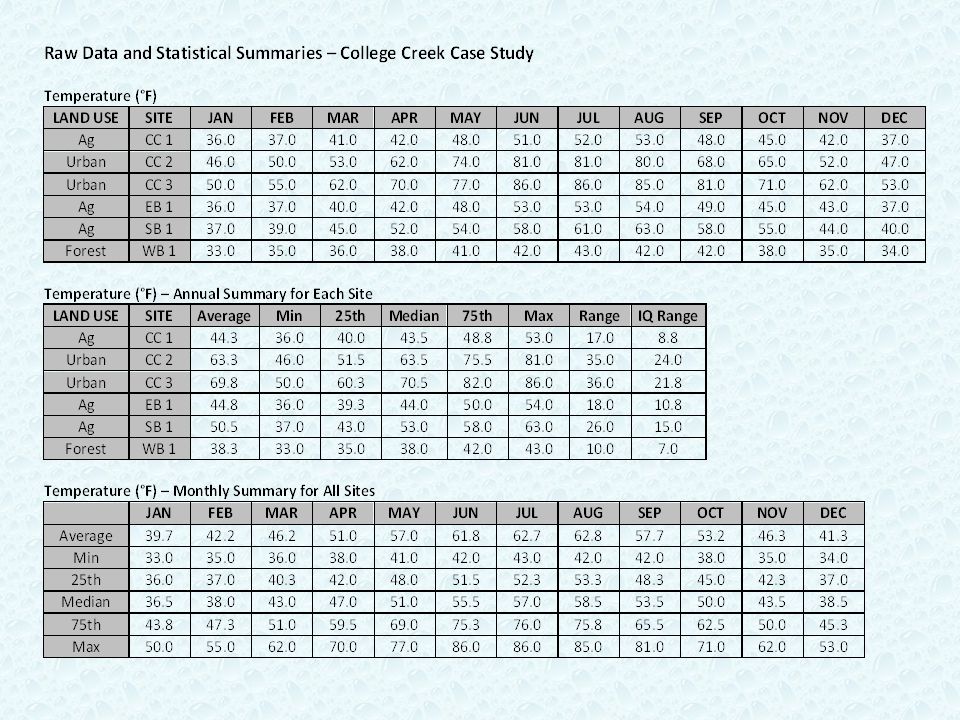
ParameterMax. Value Max. Site Max. Month Site with Highest Values Overall Site with Lowest Values Overall Site with Greatest IQ Range Can Sites be Grouped? Bacteria (FC) (col/100 ml) 320CC3Sept. (low flow) CC3 (145) SB1 (140) WB1 (0) Check! CC3 (175)CC3/SB1 (high) Nitrate (ppm) 17.2EB1May (high flow?) EB1 (8.7) SB1 (8.3) WB1 (0.1) Check! EB1 (2.8)EB1/SB1 (high) WB1 (low) Temp. ( ° F) 86CC3JulyCC3 (70.5)WB1 (38)CC2 (24) Check! CC2/CC3 (high)
 (col/100 ml) 320CC3Sept. (low flow) CC3 (145) SB1 (140) WB1 (0) Check. CC3 (175)CC3/SB1 (high) Nitrate (ppm) 17.2EB1May (high flow ) EB1 (8.7) SB1 (8.3) WB1 (0.1) Check. EB1 (2.8)EB1/SB1 (high) WB1 (low) Temp. ( ° F) 86CC3JulyCC3 (70.5)WB1 (38)CC2 (24) Check. CC2/CC3 (high).")
33
ParameterMax. Value Max. Site Max. Month Site with Highest Values Overall Site with Lowest Values Overall Site with Greatest IQ Range Can Sites be Grouped? Bacteria (FC) (col/100 ml) 320CC3Sept. (low flow) CC3 (145) SB1 (140) WB1 (0) Check! CC3 (175)CC3/SB1 (high) Nitrate (ppm) 17.2EB1May (high flow?) EB1 (8.7) SB1 (8.3) WB1 (0.1) Check! EB1 (2.8)EB1/SB1 (high) WB1 (low) Temp. ( ° F) 86CC3JulyCC3 (70.5)WB1 (38)CC2 (24) Check! CC2/CC3 (high) TSS (ppm) 456CC3May (high flow?) CC3 (130)WB1 (8.6)SB1 (133) Check! CC3 (high) CC2/SB1 (mid) WB1 (low)
 (col/100 ml) 320CC3Sept. (low flow) CC3 (145) SB1 (140) WB1 (0) Check. CC3 (175)CC3/SB1 (high) Nitrate (ppm) 17.2EB1May (high flow ) EB1 (8.7) SB1 (8.3) WB1 (0.1) Check. EB1 (2.8)EB1/SB1 (high) WB1 (low) Temp. ( ° F) 86CC3JulyCC3 (70.5)WB1 (38)CC2 (24) Check. CC2/CC3 (high) TSS (ppm) 456CC3May (high flow ) CC3 (130)WB1 (8.6)SB1 (133) Check. CC3 (high) CC2/SB1 (mid) WB1 (low).")
34
ParameterMin. Value Min. Site Min. MonthSite with Lowest Values Overall Site with Highest Values Overall Site with Greatest IQ Range Can Sites be Grouped? Alkalinity (ppm) 5.3WB1MayWB1 (18.3)EB1 (103.2)CC3 (19.2)CC1/EB1 (high) CC2/CC3/SB1 (low) WB1 (large range) DO (ppm) 3.0SB1May (annual min. in Aug!) CC3 (7.1)WB1 (12.0)SB1 (5.0)CC1/WB1 (high) CC2/EB1/SB1 (mid) WB1 (low) pH 5.0WB1MayWB1 (5.6)SB1 (16.8)* EB1 (8.0) SB1 (0.4)CC1/EB1 (high) CC2/CC3/SB1 (mid) WB1 (low) ParameterMax. Value Max. Site Max. MonthSite with Highest Values Overall Site with Lowest Values Overall Site with Greatest IQ Range Can Sites be Grouped? FC (col/100 ml) 320CC3Sept. (low flow) CC3 (145) SB1 (140) WB1 (0) Check! CC3 (175)CC3/SB1 (high) Nitrate (ppm) 17.2EB1May (high flow?) EB1 (8.7) SB1 (8.3) WB1 (0.1) Check! EB1 (2.8)EB1/SB1 (high) WB1 (low) Temp. ( ° F) 86CC3JulyCC3 (70.5)WB1 (38)CC2 (24) Check! CC2/CC3 (high) TSS (ppm) 456CC3May (high flow?) CC3 (130)WB1 (8.6)SB1 (133) Check! CC3 (high) CC2/SB1 (mid) WB1 (low)
 5.3WB1MayWB1 (18.3)EB1 (103.2)CC3 (19.2)CC1/EB1 (high) CC2/CC3/SB1 (low) WB1 (large range) DO (ppm) 3.0SB1May (annual min. in Aug!) CC3 (7.1)WB1 (12.0)SB1 (5.0)CC1/WB1 (high) CC2/EB1/SB1 (mid) WB1 (low) pH 5.0WB1MayWB1 (5.6)SB1 (16.8)* EB1 (8.0) SB1 (0.4)CC1/EB1 (high) CC2/CC3/SB1 (mid) WB1 (low) ParameterMax. Value Max. Site Max. MonthSite with Highest Values Overall Site with Lowest Values Overall Site with Greatest IQ Range Can Sites be Grouped. FC (col/100 ml) 320CC3Sept. (low flow) CC3 (145) SB1 (140) WB1 (0) Check. CC3 (175)CC3/SB1 (high) Nitrate (ppm) 17.2EB1May (high flow ) EB1 (8.7) SB1 (8.3) WB1 (0.1) Check. EB1 (2.8)EB1/SB1 (high) WB1 (low) Temp. ( ° F) 86CC3JulyCC3 (70.5)WB1 (38)CC2 (24) Check. CC2/CC3 (high) TSS (ppm) 456CC3May (high flow ) CC3 (130)WB1 (8.6)SB1 (133) Check. CC3 (high) CC2/SB1 (mid) WB1 (low).")
35
ParameterMin. Value Min. Site Min. MonthSite with Lowest Values Overall Site with Highest Values Overall Site with Greatest IQ Range Can Sites be Grouped? Alkalinity (ppm) 5.3WB1MayWB1 (18.3)EB1 (103.2)CC3 (19.2)CC1/EB1 (high) CC2/CC3/SB1 (low) WB1 (large range) DO (ppm) 3.0SB1May (annual min. in Aug!) CC3 (7.1)WB1 (12.0)SB1 (5.0)CC1/WB1 (high) CC2/EB1/SB1 (mid) WB1 (low) pH 5.0WB1MayWB1 (5.6)SB1 (16.8)* EB1 (8.0) SB1 (0.4)CC1/EB1 (high) CC2/CC3/SB1 (mid) WB1 (low) ParameterMax. Value Max. Site Max. MonthSite with Highest Values Overall Site with Lowest Values Overall Site with Greatest IQ Range Can Sites be Grouped? FC (col/100 ml) 320CC3Sept. (low flow) CC3 (145) SB1 (140) WB1 (0) Check! CC3 (175)CC3/SB1 (high) Nitrate (ppm) 17.2EB1May (high flow?) EB1 (8.7) SB1 (8.3) WB1 (0.1) Check! EB1 (2.8)EB1/SB1 (high) WB1 (low) Temp. ( ° F) 86CC3JulyCC3 (70.5)WB1 (38)CC2 (24) Check! CC2/CC3 (high) TSS (ppm) 456CC3May (high flow?) CC3 (130)WB1 (8.6)SB1 (133) Check! CC3 (high) CC2/SB1 (mid) WB1 (low)
 5.3WB1MayWB1 (18.3)EB1 (103.2)CC3 (19.2)CC1/EB1 (high) CC2/CC3/SB1 (low) WB1 (large range) DO (ppm) 3.0SB1May (annual min. in Aug!) CC3 (7.1)WB1 (12.0)SB1 (5.0)CC1/WB1 (high) CC2/EB1/SB1 (mid) WB1 (low) pH 5.0WB1MayWB1 (5.6)SB1 (16.8)* EB1 (8.0) SB1 (0.4)CC1/EB1 (high) CC2/CC3/SB1 (mid) WB1 (low) ParameterMax. Value Max. Site Max. MonthSite with Highest Values Overall Site with Lowest Values Overall Site with Greatest IQ Range Can Sites be Grouped. FC (col/100 ml) 320CC3Sept. (low flow) CC3 (145) SB1 (140) WB1 (0) Check. CC3 (175)CC3/SB1 (high) Nitrate (ppm) 17.2EB1May (high flow ) EB1 (8.7) SB1 (8.3) WB1 (0.1) Check. EB1 (2.8)EB1/SB1 (high) WB1 (low) Temp. ( ° F) 86CC3JulyCC3 (70.5)WB1 (38)CC2 (24) Check. CC2/CC3 (high) TSS (ppm) 456CC3May (high flow ) CC3 (130)WB1 (8.6)SB1 (133) Check. CC3 (high) CC2/SB1 (mid) WB1 (low).")
36
ParameterMin. Value Min. Site Min. MonthSite with Lowest Values Overall Site with Highest Values Overall Site with Greatest IQ Range Can Sites be Grouped? Alkalinity (ppm) 5.3WB1MayWB1 (18.3)EB1 (103.2)CC3 (19.2)CC1/EB1 (high) CC2/CC3/SB1 (low) WB1 (large range) DO (ppm) 3.0SB1May (annual min. in Aug!) CC3 (7.1)WB1 (12.0)SB1 (5.0)CC1/WB1 (high) CC2/EB1/SB1 (mid) WB1 (low) pH 5.0WB1MayWB1 (5.6)SB1 (16.8)* EB1 (8.0) SB1 (0.4)CC1/EB1 (high) CC2/CC3/SB1 (mid) WB1 (low) ParameterMax. Value Max. Site Max. MonthSite with Highest Values Overall Site with Lowest Values Overall Site with Greatest IQ Range Can Sites be Grouped? FC (col/100 ml) 320CC3Sept. (low flow) CC3 (145) SB1 (140) WB1 (0) Check! CC3 (175)CC3/SB1 (high) Nitrate (ppm) 17.2EB1May (high flow?) EB1 (8.7) SB1 (8.3) WB1 (0.1) Check! EB1 (2.8)EB1/SB1 (high) WB1 (low) Temp. ( ° F) 86CC3JulyCC3 (70.5)WB1 (38)CC2 (24) Check! CC2/CC3 (high) TSS (ppm) 456CC3May (high flow?) CC3 (130)WB1 (8.6)SB1 (133) Check! CC3 (high) CC2/SB1 (mid) WB1 (low)
 5.3WB1MayWB1 (18.3)EB1 (103.2)CC3 (19.2)CC1/EB1 (high) CC2/CC3/SB1 (low) WB1 (large range) DO (ppm) 3.0SB1May (annual min. in Aug!) CC3 (7.1)WB1 (12.0)SB1 (5.0)CC1/WB1 (high) CC2/EB1/SB1 (mid) WB1 (low) pH 5.0WB1MayWB1 (5.6)SB1 (16.8)* EB1 (8.0) SB1 (0.4)CC1/EB1 (high) CC2/CC3/SB1 (mid) WB1 (low) ParameterMax. Value Max. Site Max. MonthSite with Highest Values Overall Site with Lowest Values Overall Site with Greatest IQ Range Can Sites be Grouped. FC (col/100 ml) 320CC3Sept. (low flow) CC3 (145) SB1 (140) WB1 (0) Check. CC3 (175)CC3/SB1 (high) Nitrate (ppm) 17.2EB1May (high flow ) EB1 (8.7) SB1 (8.3) WB1 (0.1) Check. EB1 (2.8)EB1/SB1 (high) WB1 (low) Temp. ( ° F) 86CC3JulyCC3 (70.5)WB1 (38)CC2 (24) Check. CC2/CC3 (high) TSS (ppm) 456CC3May (high flow ) CC3 (130)WB1 (8.6)SB1 (133) Check. CC3 (high) CC2/SB1 (mid) WB1 (low).")
37
What is the data telling us? 1.How are the indicators related to one another? How do they affect each other?

38
What is the data telling us? 1.How are the indicators related to one another? How do they affect each other? Temp DO Temp FC? Alk pH Nitr TSS?

39
What is the data telling us? 2. Does flow seem to have an effect on WQ indicators? If so, how?

40
What is the data telling us? 2. Does flow seem to have an effect on WQ indicators? If so, how? Increasing flow TSS Alk Nitr Decreasing flow FC

41
What is the data telling us? 3. Do any data suggest that point sources may be impacting the stream? If so, which indicators?

42
What is the data telling us? 3. Do any data suggest that point sources may be impacting the stream? If so, which indicators? Discharge #7 (WWTP) – high FC at CC3
 – high FC at CC3.")
43
4.Do any data suggest that non-point source pollution may be impacting the stream? If so, which indicators?

44
Ag runoff to SB1 – high FC Ag runoff to EB1 – high nitrate with high flow (check into further)
")
45
5.Overall, what would you say about the health of the College Creek Watershed?

46
WB1 (sandstone) & EB1 (limestone) baseline conditions WQ at CC3 significantly degraded
 & EB1 (limestone) baseline conditions WQ at CC3 significantly degraded")
47
6. If this was your watershed, what are some ways to improve the condition of the stream and raise awareness in the community?

48
Investigate non-point source Ag inputs above SB1 – education & outreach? WWTP – investigate summer discharges Protect summer baseflows and water temp – riparian vegetation and wetland creation

Similar presentations


>")


 Intake Stessor.>")


 Temperature ( °C )Average ( °C ) 114.9 °C 14.48 °C 215.5 °C 314.3 °C 414.2 °C 513.5 °C According to.>")