Download presentation
Presentation is loading. Please wait.

1
AP Statistics Inference Review Chapters 18-25

2
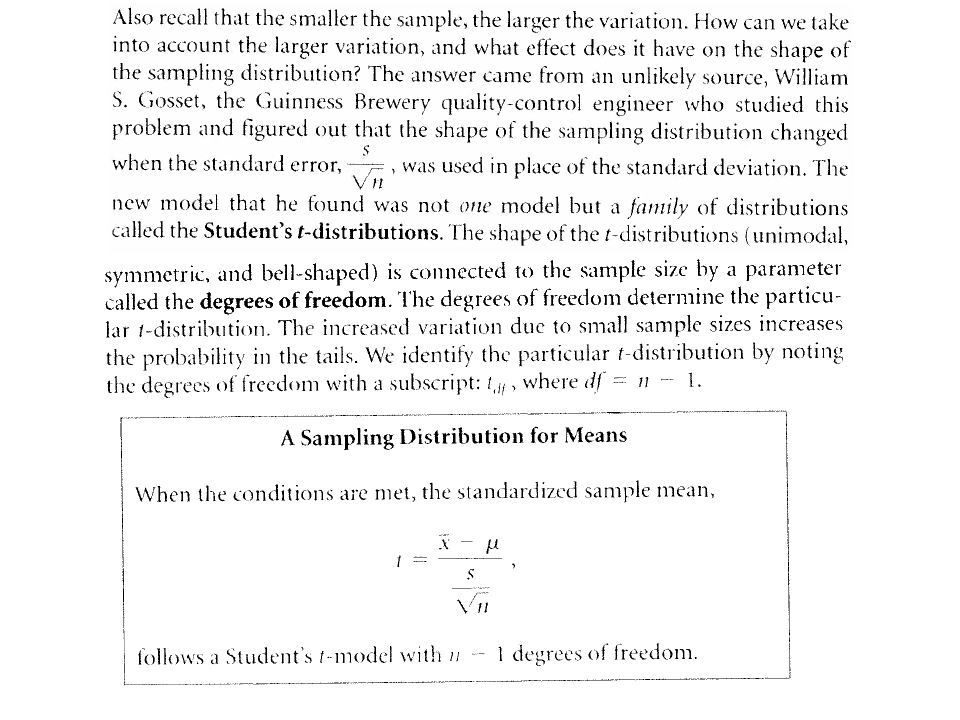
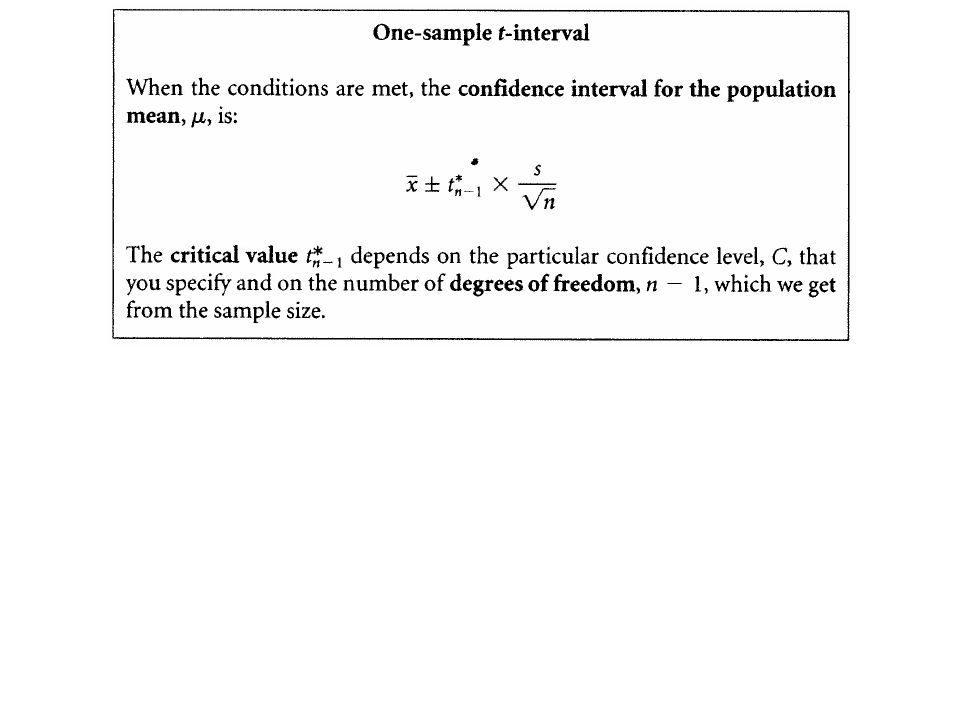
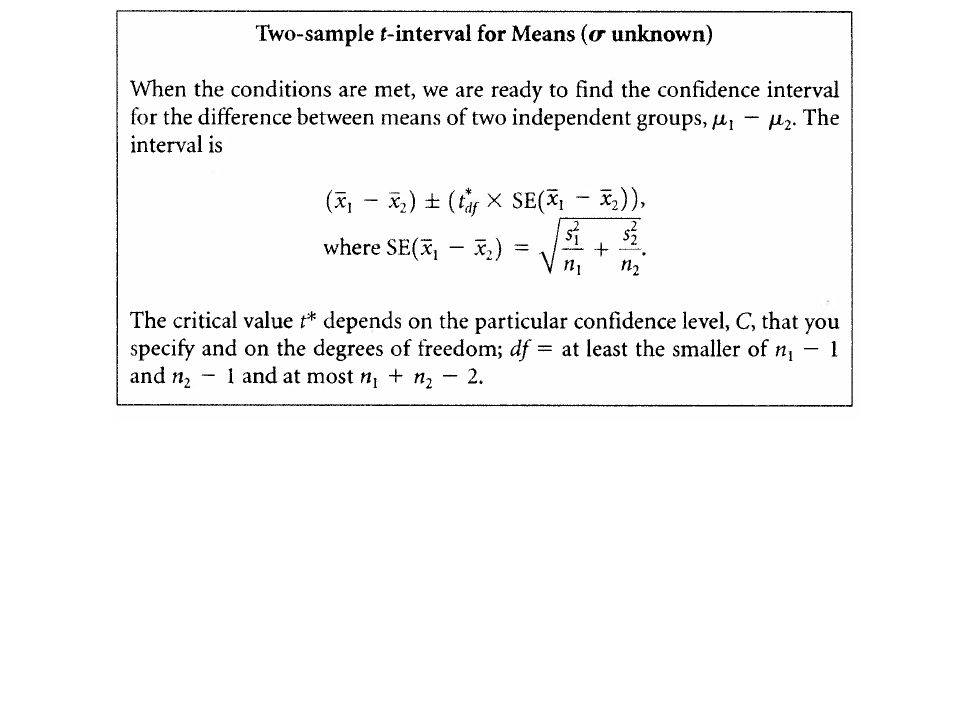
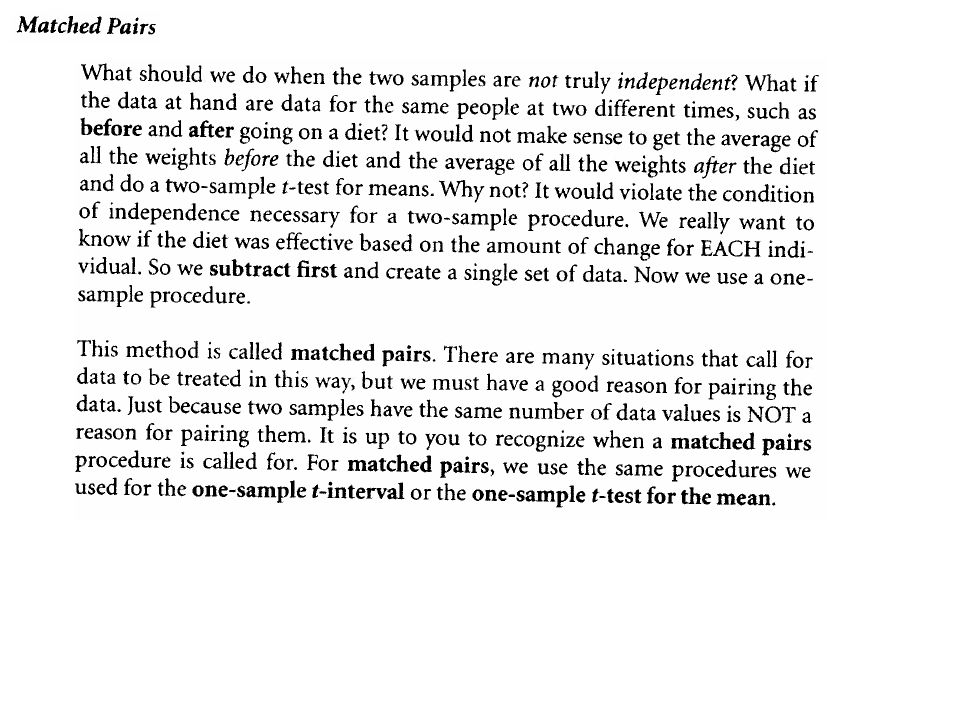
Remember Your Formulas 1 Proportion: CI = Hypothesis Test: z = 2 Proportion: CI = Hypothesis Test: z = 1 Sample or Matched Pairs t-test CI = Hypothesis Test: t df = 2 Sample t-test: CI: Hypothesis Test: t df =

9
Remember PANIC for CI’s and PHANTOMS for Hypothesis Tests Parameter Assumption Name Test and Statistics Interval (Include Formula) Conclusion Parameter Hypothesis (p or mu) Assumptions/Conditions Name Test Test Statistics Obtain P (Include formula and distribution) Make Decision (Never accept H o State Conclusion (In Context)
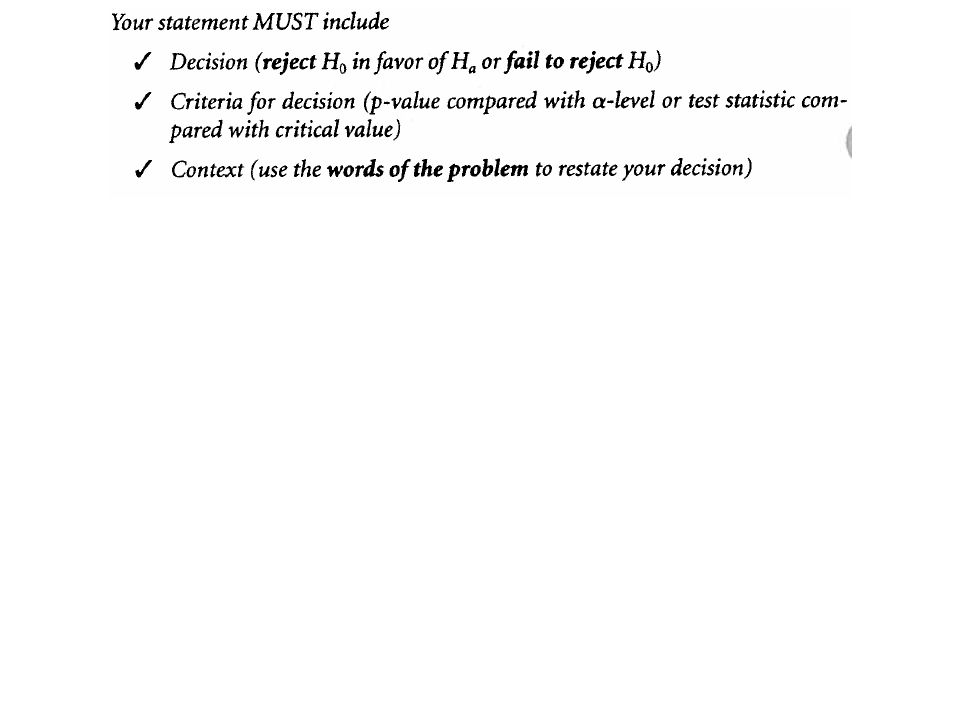
 Conclusion Parameter Hypothesis (p or mu) Assumptions/Conditions Name Test Test Statistics Obtain P (Include formula and distribution) Make Decision (Never accept H o State Conclusion (In Context)")
11
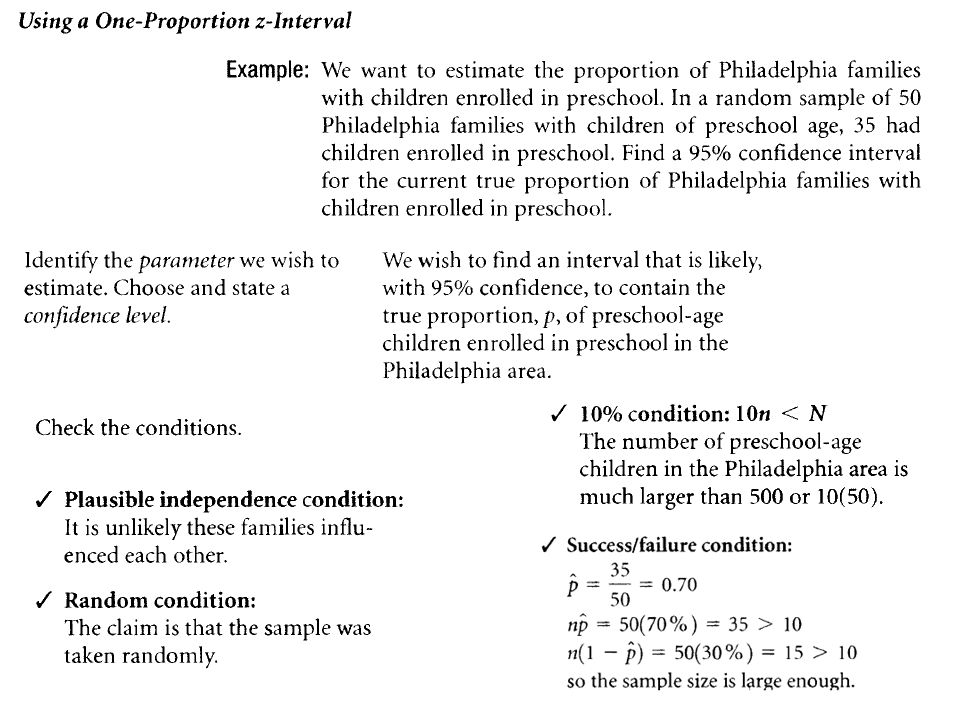
Name Statistics: n = 50, p-hat =.7, q-hat =.3 Interval: Conclusion:

14
Parameter: p = proportion of city workers who are also in the union Hypothesis: Independent: Each person being in The union should be independent

15
Name: One proportion z-test Test Statistics: p-hat =.12, p =.135, q =.865, n = 2000 Obtain P: Decision: Conclusion:

18
Parameter: Assumptions:

19
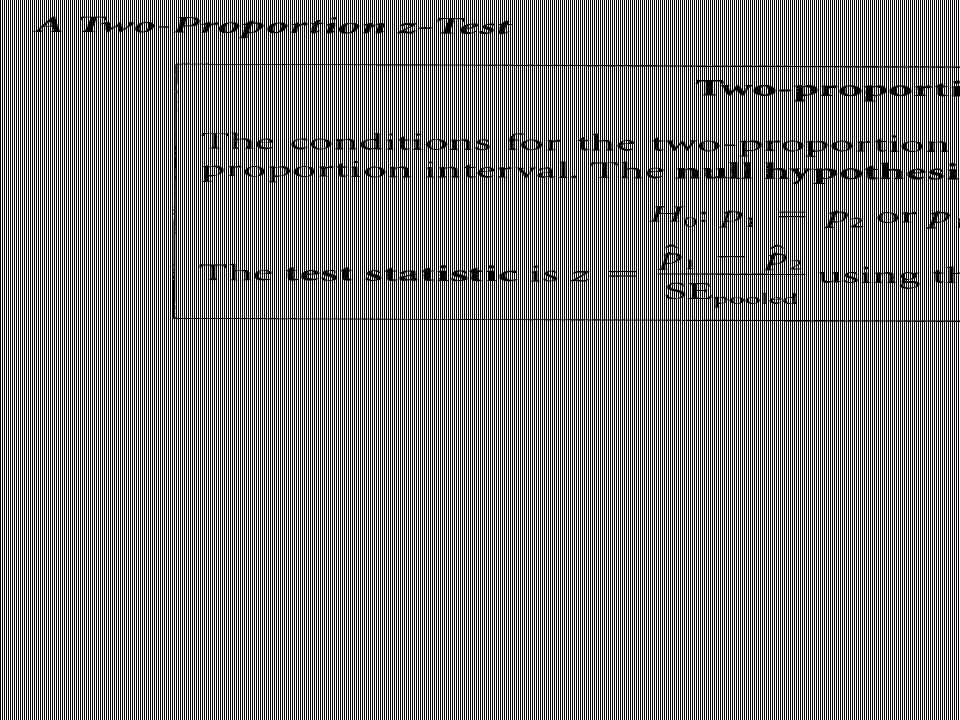
Name: 2 Proportion z-Interval Interval: Conclusion:

21
Parameter: P s = Proportion of suburban students that failed AP exam P r = Proportion of rural students that failed AP exam Hypothesis: H o : P s = P r, H a : P s ≠ P r Assumptions: 10%: Both 107 and 143 are less than 10% of rural and suburban students that took AP exam.

22
Name: 2 Proportion z-test Test Statistics: Obtain P: P =.56 Make Decision: Fail to reject H o State Conclusion:

28
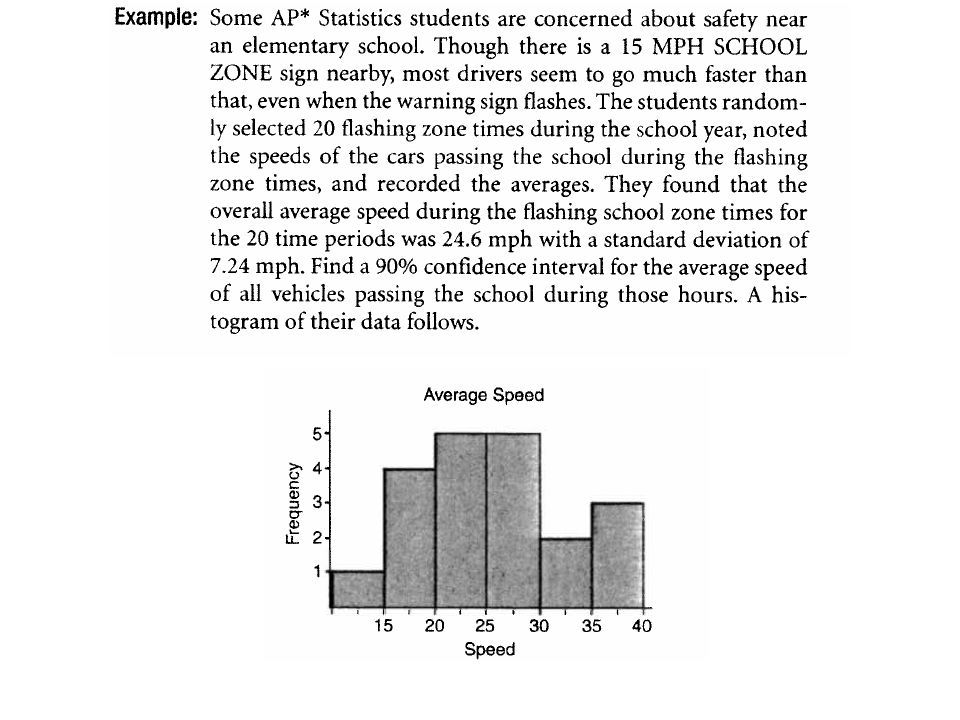
Parameter: Assumptions: Random: It is a random selection of days during the year. Nearly Normal: The histogram is roughly unimodal and symmetric Independent: Each car’s speed should be independent 10%: 20 cars is less than 10% of all cars that pass through when the sign is flashing Name Test: Interval: Conclusion:

30
Parameter: U = average # of hours students watch TV per week from Central High Hypothesis: H o : U = 13, H a : U > 13

31
Assumptions: Nearly Normal: Histogram is roughly unimodal and symmetric. Random: Students were randomly selected Independent: TV watching among students should be independent 10%: 25 students is less than 25% of all students at CHS. Name Test: Test Statistics: Obtain P: Conclusion:

33
Parameter: Assumptions:

34
Name: Interval: Conclusion:

36
Parameter: U m = mean death age of men, U w = mean death age of women Hypothesis: H o : U m = U w, H a : U m < U w Assumptions:

37
Name Test: Test Statistics: Obtain P: Conclusion:

39
Parameter: U d = The mean difference in unemployment rate between Australia and UK Assumptions:

40
Assumptions continued: Nearly Normal: Histogram is roughly unimodal and symmetric 10%: 1990 – 2000 represents less than 10% of All of the years Name: Interval: Conclusion:

42
Parameter: U d = The mean difference in employment rate between Males and Females Hypothesis:

43
Assumptions: Name: Match paired t-test Test Statistics: Obtain P: Make Decision: Fail to reject H o State Conclusion:

Similar presentations


>")


