Download presentation
Presentation is loading. Please wait.

1
Navigating the parameter space of Bayesian Knowledge Tracing models Visualizations of the convergence of the Expectation Maximization algorithm Zachary A. Pardos, Neil T. Heffernan Worcester Polytechnic Institute Department of Computer Science

2
Outline Introduction – Knowledge Tracing/EM – Past work – Research Overview Analysis Procedure Results (pretty pictures) Contributions Presentation available: wpi.edu/~zpardos
 Contributions Presentation available: wpi.edu/~zpardos")
3
Introduction of BKT Bayesian Knowledge Tracing (BKT) is a hidden Markov model that estimates the probability a student knows a particular skill based on: – the student’s past history of incorrect and correct responses to problems of that skill – the four parameters of the skill 1.Prior: The probability the skill was known before use of the tutor 2.Learn rate: the probability of learning the skill between each opportunity 3.Guess: The probability of answering correctly if the skill is not known 4.Slip: the probability of answering incorrectly if the skill is known
 is a hidden Markov model that estimates the probability a student knows a particular skill based on: – the student’s past history of incorrect and correct responses to problems of that skill – the four parameters of the skill 1.Prior: The probability the skill was known before use of the tutor 2.Learn rate: the probability of learning the skill between each opportunity 3.Guess: The probability of answering correctly if the skill is not known 4.Slip: the probability of answering incorrectly if the skill is known")
4
Introduction of EM Expectation Maximization (EM) algorithm is a commonly used algorithm for learning parameters based on maximum likelihood estimates. EM is especially well suited to learn the four BKT parameters because it supports learning parameters for models with unobserved or latent variables Latent

5
Motivation Results of past and emerging work by the authors rely on interpretation of parameters learned with BKT and EM Pardos, Z. A., Heffernan, N. T. (2009). Determining the Significance of Item Order In Randomized Problem Sets. In Barnes, Desmarais, Romero, & Ventura (Eds.). In Proceedings of the 2nd International Conference on Educational Data Mining. pp. 151-160. Cordoba, Spain. *Best Student Paper Pardos, Z. A., Dailey, M. D., Heffernan, N. T. In Press (2010) Learning what works in ITS from non- traditional randomized controlled trial data. In Proceedings of the 10th International Conference on Intelligent Tutoring Systems. Pittsburg, PA. Springer-Verlag: Berlin. *Nominated for Best Student Paper
. Determining the Significance of Item Order In Randomized Problem Sets. In Barnes, Desmarais, Romero, & Ventura (Eds.). In Proceedings of the 2nd International Conference on Educational Data Mining. pp Cordoba, Spain. *Best Student Paper Pardos, Z. A., Dailey, M. D., Heffernan, N. T. In Press (2010) Learning what works in ITS from non- traditional randomized controlled trial data. In Proceedings of the 10th International Conference on Intelligent Tutoring Systems. Pittsburg, PA. Springer-Verlag: Berlin. *Nominated for Best Student Paper.")
6
Motivation Learned parameter values work to dictate when a student should advance in a curriculum in the Cognitive Tutors

7
Past work and relevance Beck et al (2007) expressed caution with using Knowledge Tracing, giving an example of how KT could fit data equally well with two separate sets of learned parameters. One set being the plausible set, the other being the degenerate set. – Proposed using Dirichlet priors to keep parameters close to reasonable values Better fit was not accomplished with this method when learning the parameters from data

8
Past work and relevance Baker (2009) argued that using brute force to fit the parameters of KT results in a better fit than when using Expectation Maximization (personal communication) – Gong et al are challenging this at EDM2010 Work by Baker & Corbett has addressed the degenerate parameter problem by bounding the learned parameter values
 argued that using brute force to fit the parameters of KT results in a better fit than when using Expectation Maximization (personal communication) – Gong et al are challenging this at EDM2010 Work by Baker & Corbett has addressed the degenerate parameter problem by bounding the learned parameter values")
9
Past work and relevance Ritter et al (2009) used visualization of the KT parameters to show how many of the Cognitive tutor skills were being fit with similar parameters. The authors used that information to cluster the learning of groups of skills; saving compute time with negligible impact on accuracy.

10
Initial EM parameters Bad fit Ineffective learning Bad pedagogical decisions Good fit Effective learning Many publications You’re a hero Bayesian Knowledge Tracing: Method for estimating if a student knows a skill or not based on the student’s past responses and the parameter values of the skill Expectation Maximization (EM): Method for estimating the skill parameters for Bayesian Knowledge Tracing EM needs starting values for the parameters to begin its search Research Overview
: Method for estimating the skill parameters for Bayesian Knowledge Tracing EM needs starting values for the parameters to begin its search Research Overview")
11
Initial EM parameters Bad fit Ineffective learning Bad pedagogical decisions Good fit Effective learning Many publications You’re a hero Bayesian Knowledge Tracing: Method for estimating if a student knows a skill or not based on the student’s past responses and the parameter values of the skill Expectation Maximization (EM): Method for estimating the skill parameters for Bayesian Knowledge Tracing EM needs starting values for the parameters to begin its search Are the starting locations that lead to good fit scattered randomly? Research Questions: Research Overview

12
Initial EM parameters Bad fit Ineffective learning Bad pedagogical decisions Good fit Effective learning Many publications You’re a hero Bayesian Knowledge Tracing: Method for estimating if a student knows a skill or not based on the student’s past responses and the parameter values of the skill Expectation Maximization (EM): Method for estimating the skill parameters for Bayesian Knowledge Tracing EM needs starting values for the parameters to begin its search Are the starting locations that lead to good fit scattered randomly? Do they exist within boundaries? Research Questions: Research Overview

13
Initial EM parameters Bad fit Ineffective learning Bad pedagogical decisions Good fit Effective learning Many publications You’re a hero Bayesian Knowledge Tracing: Method for estimating if a student knows a skill or not based on the student’s past responses and the parameter values of the skill Expectation Maximization (EM): Method for estimating the skill parameters for Bayesian Knowledge Tracing EM needs starting values for the parameters to begin its search Are the starting locations that lead to good fit scattered randomly? Do they exist within boundaries? Can good convergence always be achieved? Research Questions: Research Overview

14
Past work and relevance Past work lacks the benefit of knowing the ground truth parameters This makes it difficult to study the behavior of EM and measure the accuracy of learned parameters

15
Our approach: Simulation Approach of this work is to – construct a BKT model with known parameters – simulate student responses by sampling from that model – explore how EM converges or does not converge to the ground truth parameters based a grid- search of initial parameter starting positions – since we know the true parameters we can now study the accuracy of parameter learning in depth

16
Initial EM parameters Bad fit Ineffective learning Bad pedagogical decisions Good fit Effective learning Many publications You’re a hero Research Overview Inaccurate fit Accurate fit

17
Simulation Procedure KTmodel.lrate = 0.09 KTmodel.guess = 0.14 KTmodel.slip = 0.09 KTmodel.num_questions = 4 For user 1 to 100 prior(user) = rand() KTmodel.prior = prior(user) sim_responses(user) = sample.KTmodel End For
 = rand() KTmodel.prior = prior(user) sim_responses(user) = sample.KTmodel End For")
18
Simulation Procedure Simulation produces a vector of responses for each student probabilistically based on underlying parameter values EM can now try to learn back the true parameters from the simulated student data EM allows the user to specify which initialization values of the KT parameters should be fixed and which should be learned

19
Simulation Procedure We can start to build intuition about EM by fixing the prior and learn rate and having only two free parameter to learn (Guess and Slip) – Prior: 0.49 (fixed) – Learn rate: 0.09 (fixed) – Guess: learned – Slip: learned We can see how well EM does with two free parameters and then then later step up to the more complexity four free parameter case
 – Prior: 0.49 (fixed) – Learn rate: 0.09 (fixed) – Guess: learned – Slip: learned We can see how well EM does with two free parameters and then then later step up to the more complexity four free parameter case")
20
Grid-search Procedure GuessT (true parameter)SlipT (true parameter) 0.140.09 GuessI (EM initial parameter) SlipI (EM initial parameter) 0.360.40 GuessL (EM learned parameter) SlipL (EM learned parameter) 0.230.11 Error = (abs(GuessT – GuessL) + abs(SlipT – SlipL)) / 2 Learning the Guess and Slip parameter from Data Prior and Learn rate already known (fixed)
SlipT (true parameter) GuessI (EM initial parameter) SlipI (EM initial parameter) GuessL (EM learned parameter) SlipL (EM learned parameter) Error = (abs(GuessT – GuessL) + abs(SlipT – SlipL)) / 2 Learning the Guess and Slip parameter from Data Prior and Learn rate already known (fixed)")
21
Grid-search Procedure GuessTSlipT GuessISlipI GuessLSlipLErrorLLstartLLend 0.140.090.00 0.1150-1508 0.140.090.000.020.230.140.1390-344-251 0.140.090.000.040.230.140.1390-309-251 ……………………… 0.140.091.00 0.8850-1645 These parameters are iterated in intervals of 0.02 1 / 0.02 + 1 = 51, 51*51 = 2601 total iterations EM log likelihood Higher = better fit to data Resulting data file after all iterations are completed

22
Grid-search Procedure GuessTSlipT GuessISlipI GuessLSlipLErrorLLstartLLend 0.140.090.00 0.1150-1508 0.140.090.000.020.230.140.1390-344-251 0.140.090.000.040.230.140.1390-309-251 ……………………… 0.140.091.00 0.8850-1645 These parameters are iterated in intervals of 0.02 1 / 0.02 + 1 = 51, 51*51 = 2601 total iterations EM log likelihood Higher = better fit to data Initial parameters of 0 or 1 will stay at 0 or 1

23
Grid-search Procedure GuessTSlipT GuessISlipI GuessLSlipLErrorLLstartLLend 0.140.090.00 0.1150-1508 0.140.090.000.020.230.140.1390-344-251 0.140.090.000.040.230.140.1390-309-251 ……………………… 0.140.091.00 0.8850-1645 These parameters are iterated in intervals of 0.02 1 / 0.02 + 1 = 51, 51*51 = 2601 total iterations EM log likelihood Higher = better fit to data Grid-search run in intervals of 0.02

24
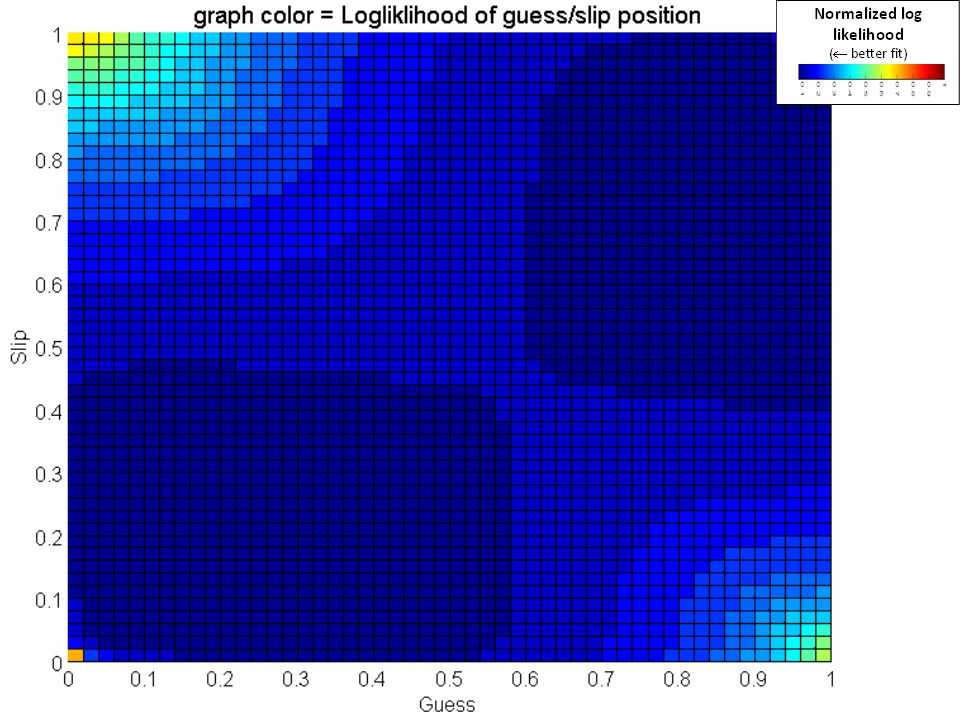
Visualizations What does the parameter space look like? Which starting locations lead to the ground truth parameter values?

27
Analyzing the 3 & 4 parameter case Similar results were found with the 3 parameter case with learn, guess and slip as free parameters. The starting position of the learn parameter wasn’t important as long as guess + slip <= 1 In the four parameter case a grid-search was run at 0.05 resolution and histograms were generated showing the frequency of parameter occurrences. We found that when guess and slip were set to sum to less than 1, the bottom row of histograms were achieved that minimized degenerate parameter occurrences.

28
Pardos, Z. A., Heffernan, N. T. In Press (2010) Modeling Individualization in a Bayesian Networks Implementation of Knowledge Tracing. In Proceedings of the 18 th International Conference on User Modeling, Adaptation and Personalization. Hawaii. *Nominated for Best Student Paper
 Modeling Individualization in a Bayesian Networks Implementation of Knowledge Tracing. In Proceedings of the 18 th International Conference on User Modeling, Adaptation and Personalization. Hawaii. *Nominated for Best Student Paper.")
29
KT vs. PPS visualizations Knowledge TracingPrior Per Student Ground truth parameters: guess/slip = 0.14/0.09

30
KT vs. PPS visualizations Knowledge TracingPrior Per Student Ground truth parameters: guess/slip = 0.30/0.30

31
KT vs. PPS visualizations Knowledge TracingPrior Per Student Ground truth parameters: guess/slip = 0.50/0.50

32
KT vs. PPS visualizations Knowledge TracingPrior Per Student Ground truth parameters: guess/slip = 0.60/0.10

33
PPS in the KDD Cup Prior Per Student model used in KDD Cup competition submission. PPS was the most accurate Bayesian predictor in all 5 of the Cognitive tutor datasets Preliminary leaderboard RMSE: 0.279695 – One place behind the netflix winners, BigChaos This suggests that the positive simulation results are real, substantiated empirically

34
Contributions EM starting parameter values that lead to degenerate learned parameters exist within large boundaries, not scattered randomly throughout the parameter space Using a novel simulation approach and visualizations we were able to clearly depict the multiple maxima characteristics of Knowledge Tracing Using this analysis of algorithm behavior we were able to explain the positive performance of the Prior Per Student model by showing its convergence near the ground truth parameters regardless of starting position Initial values of Guess and Slip are very significant

35
Unknowns / Future Work How does PPS compare to KT when priors are not from a uniform random distribution – Normal distribution – All students have the same prior – Bi-modal (high / low knowledge students) How does length of sequence and number of students affect algorithm behavior?
 How does length of sequence and number of students affect algorithm behavior")
36
Thank you Please find a copy of our paper on the Prior Per Student model at http://wpi.edu/~zpardoshttp://wpi.edu/~zpardos “Modeling Individualization in a Bayesian Networks Implementation of Knowledge Tracing” Acknowledgement: This material is based in part upon work supported by the National Science Foundation under the GK-12 PIMPSE Grant. Disclaimer: Any opinions, findings, and conclusions or recommendations expressed in this material are those of the author(s) and do not necessarily reflect the views of the National Science Foundation.
 and do not necessarily reflect the views of the National Science Foundation..")
37
Limitations of past work – Bounding approach has shown instances where the learned parameters all hit the bounding ceiling indicating that the best fit parameters may be higher than was arbitrarily set – Plausible parameter approach in part relies on domain knowledge to identify what is plausible and what is not Reading tutors may have plausible guess/slip values > 0.70 Cognitive tutors’ plausible guess/slip values are < 0.40

Similar presentations