Download presentation
Presentation is loading. Please wait.

1
Operations Management
Unit 5 Project Management HL ONLY

2
Learning Objectives Construct and interpret a network diagram
Analyse how critical path analysis (CPA) and network diagrams can be used to help with project management Apply CPA to different projects Evaluate the usefulness of a network in the management of projects
 and network diagrams can be used to help with project management. Apply CPA to different projects. Evaluate the usefulness of a network in the management of projects.")
3
Critical Path Analysis (CPA)
A planning technique that identifies all tasks in a project, puts them in the correct sequence and allows for the identification of the critical path Critical Path Analysis is a planning and management tool with the following advantages: Allows a business to plan ahead - efficiency Is time related giving an accurate plan Enables resources to be planned ahead Allows for good management Helps with cash flow management Reduces waste CPA may be used as part of the decision making process to allow a business to plan and monitor operations Time related – identifies the maximum time for an operation to be completed Identify potential problems in implementing operation Identifies where and when resources (including human ones) are needed
 are needed.")
4
Critical Path Analysis
CPA is sometimes called network analysis It’s a tool used to plan activities so that a job can be completed in the SHORTEST time It breaks down a job into a number of tasks and looks at their DEPENDENCIES Used commonly in manufacturing and construction

5
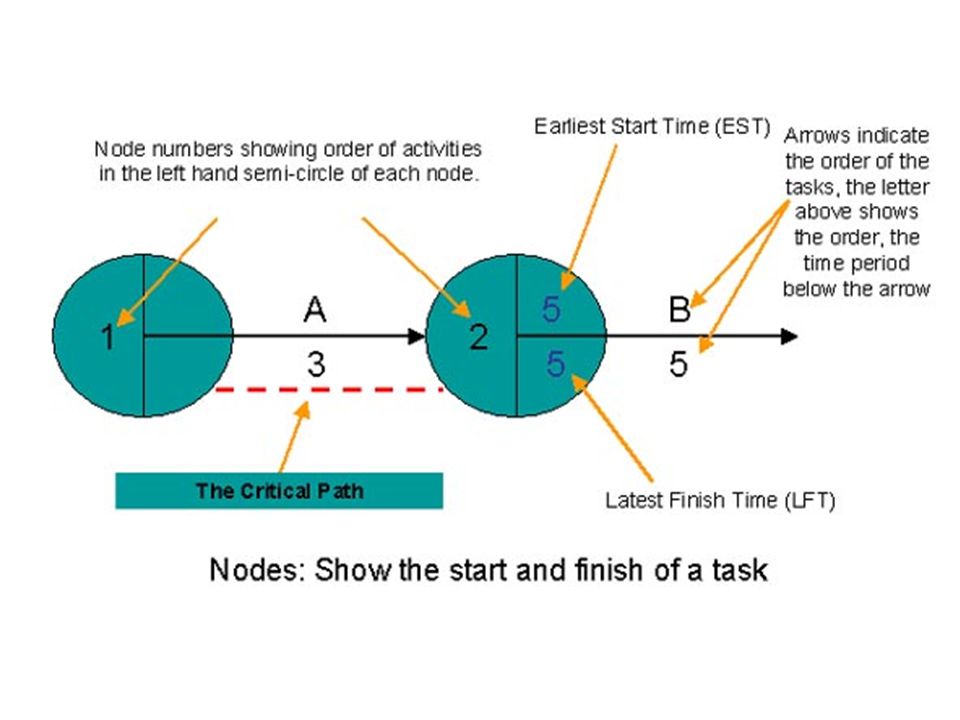
Parts of a Network

7
A simple Network diagram

8
Illustrating simultaneous activities

9
Developing the network

10
Earliest Start Time (EST)
The main reason for drawing a network is to identify the CRITICAL activities To do this we must calculate the earliest time at which any given activity can start This is called the Earliest Start Time (EST) of the activity EST = EST of Previous activity + Duration of previous activity
 of the activity. EST = EST of Previous activity + Duration of previous activity.")
11
Earliest Start Time (EST)
")
12
EST and simultaneous activities

13
EST Recap The EST of the first activity is always ZERO
Calculate the EST by working Left to Right across a network EST = EST of Previous activity + Duration of previous activity When there are 2 simultaneous activities the HIGHEST figure is used as the EST

14
Latest Finish Time (LFT)
There is one final piece of information needed to complete our network diagram To identify the CRITICAL activities we must also know the latest time at which any given activity must end This is called the Latest Finishing Time (LFT) of the activity It is calculated by working BACKWARDS across the network using the following formula LFT = LFT at the end of following activity – Duration of following activity
 of the activity. It is calculated by working BACKWARDS across the network using the following formula. LFT = LFT at the end of following activity – Duration of following activity.")
15
Latest Finish Time (LFT)
")
16
LFT and simultaneous activities

17
LFT Recap The LFT of the last activity is always equal to its EST
The LFT of the first activity is always ZERO Calculate the LFT by working Right to Left across a network LFT = LFT at the end of following activity – Duration of following activity

20
The Float Any activity without spare time is CRITICAL
Spare time is referred to as the FLOAT

21
Calculating the FLOAT FLOAT= LFT – (EST+ Duration) Total FLOAT = the amount of spare time available for an activity without delaying the whole project Activity LFT EST Duration Total FLOAT A 14 12 2 AA B 17 3

22
What does this mean? This data tells us:
Activity LFT EST Duration Total FLOAT A 14 12 2 AA B 17 3 This data tells us: Activity A can be delayed 2 weeks without delaying the whole project Activity AA is CRITICAL any delay will hold up the project Activity B is CRITICAL

24
Dummy Activities Dotted line representing logical dependency

25
Dummy Activities

26
Identifying the Critical Path

28
Advantages of CPA Managers need to consider exactly what activities are involved in a project Managers can identify CRITICAL activities to be completed on time to get the whole project completed ASAP Good use of CPA can enable managers to reduce time to market and costs, and make the business more efficient

29
Disadvantages of CPA Diagrams can become complicated and unmanageable
Relies on good estimates from reliable staff Can be padded to make performance look better than it really is OR can be overoptimistic Can make the company very dependent on suppliers and hence they need to be very reliable

30
Other issues Managers must agree ‘what success looks like’ so that staff do not cut corners Managers must also agree what resources and spend are available to the project Managers must also watch the utilisation of resources throughout the project in order to schedule work to make the most of paid staff

31
CPA and Lean Production
Lean production aims to reduce wastage and thereby make a business more efficient and competitive. Two operational strategies based on CPA to achieve Lean Production: Kaizen (continuous improvement) JIT – Just In Time production
 JIT – Just In Time production.")
32
Kaizen Employees attempt to improve what they do in some small way every day Small regular contributions from the whole firm can have big cumulative effects

33
Raw Materials and components
JIT Holding stock increases costs: Warehousing, breakages, capital JIT aims to minimise the stocks held at any point of the production process: Raw Materials and components Work in progress (unfinished goods) Finished goods
 Finished goods.")
Similar presentations


>")
 In 1986 one well-known software engineer (Tom DeMarco) made the simple but important observation: “You.>")
 4 th Year.>")


