Download presentation
Presentation is loading. Please wait.

1
Radar Meteorology Laboratory Rain from Doppler Radar data Prof. LEE, Dong-In 23 November 2000

2
Object: To get rainfall from radar data

3
Theory: u Add appropriate theory from text or other sources.

4
Radar reflectivity factor where z is radar reflectivity factor (mm 6 /m 3 ), N i is the number of drops per unit volume (m -3 ) and D i is diameter (mm) for drops in the i th size category.
, N i is the number of drops per unit volume (m -3 ) and D i is diameter (mm) for drops in the i th size category.")
5
Rain Rate u Rain rate is the rate at which water volume accumulates over a unit area and is given by where A is the area involved and t is time. u This equation actually calculates the volume of water per unit area per unit time.

6
Liquid Water Content u Liquid water content is the mass of liquid water in a volume in space, given by where v i is the terminal velocity of the i th diameter raindrop, and w is the density of water.

7
Z-R Relationship

8
Procedure: u Get Radar data during rain situation u Trace contours of reflectivity from each time onto a single image. u “Connect the dots” and draw swaths of the path of the storm at each reflectivity level. u Convert Z to R u Get rain at each time by integrating amount over each location at each time.

9
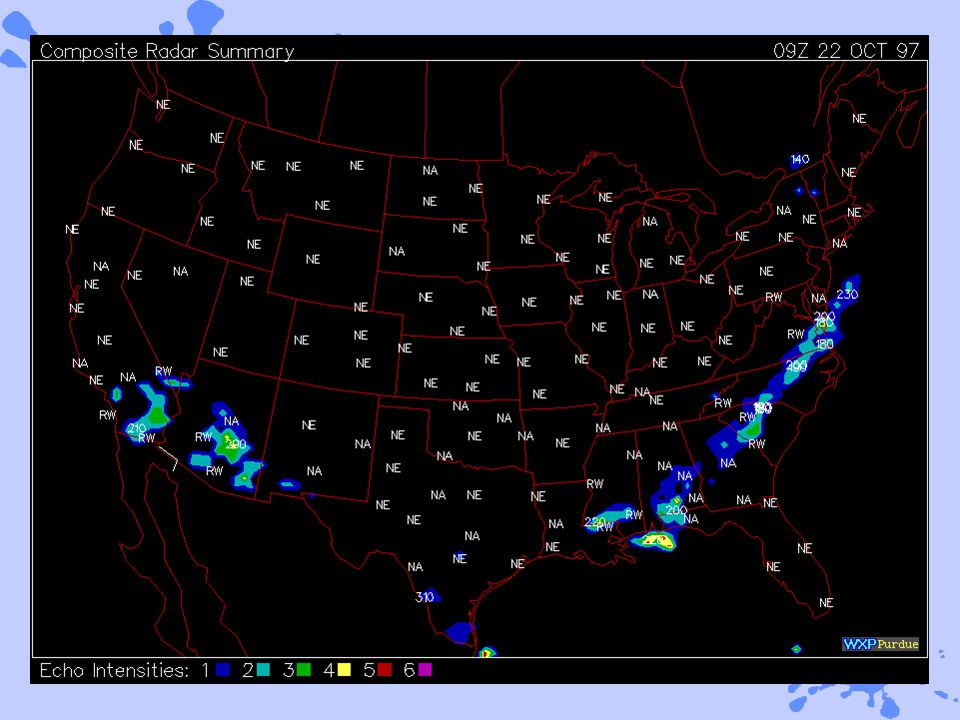
(Ex.) NEXRAD images of rain u Get data at hourly intervals. u One possible way is to get it from: u http://wxp.atms.purdue.edu/radar/previous/rad_ comp-X.gif where X can be 1, 2, 3, 4, 5, or 6. u Alternatively, get more detailed data from a specific site.

16
We can combine these into a single image.

18
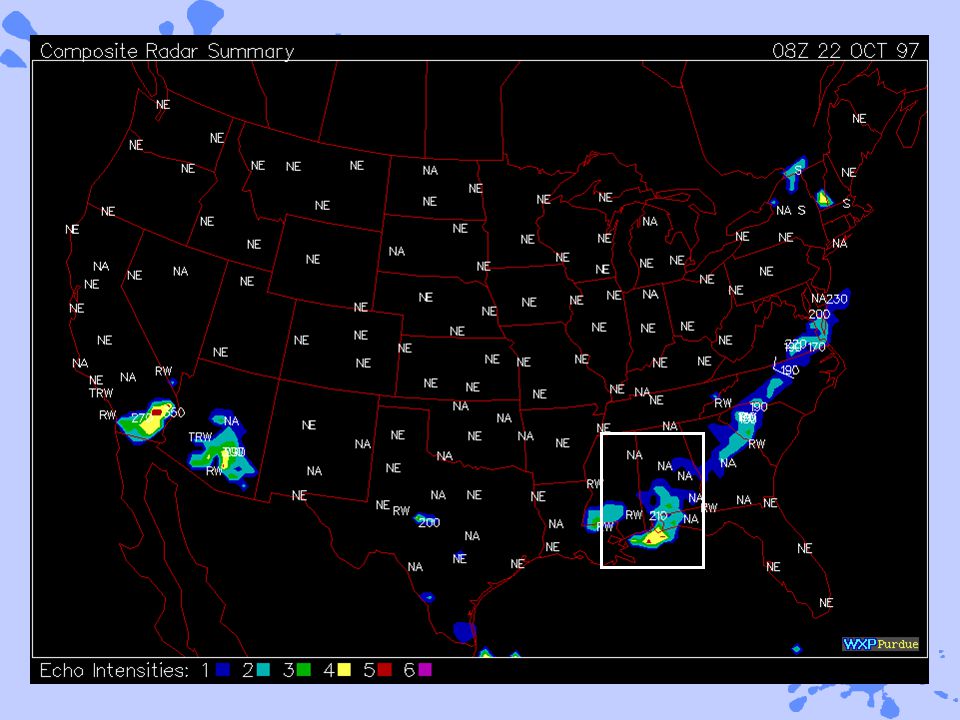
You may want to select a single region for your analysis.

20
Transfer Z data from each image to a common image. u Draw outlines of each reflectivity level onto a single piece of acetate or a separate image. u Then combine these.

23
Now combine individual images into a single image.

25
“Connect the dots” to produce rain swaths.

27
Fill the contours if you like.

28
Convert Z to R u Use Z-R relationship. u z = 300 R 1.5 where R is rainrate in mm/h and z is radar reflectivity factor in mm 6 /m 3

29
Draw new contours of R (parallel to the Z contours already on image)
")
30
Razzelfratz!!! u After spending an hour or so generating all the (ugly) images before this, it finally dawned on me that this is not necessarily going to answer the question: “How much did it rain at point X?” u How can we answer that question?
 images before this, it finally dawned on me that this is not necessarily going to answer the question: How much did it rain at point X u How can we answer that question .")
31
Questions: u Define “rainfall” u How do we go from radar data to rainfall accumulations? u What points (on the ground) are good ones to use? u How much time resolution in the radar data is needed? Does it depend on the kind of rain falling?
 are good ones to use. u How much time resolution in the radar data is needed. Does it depend on the kind of rain falling .")
32
Rainfall total where R is the rainrate (mm/h) at a given place and time, t is the time interval between consecutive radar data sets. R total = the total depth of rain at the location over the entire time interval.

33
How do we get R? u Radar give radar reflectivity factor Z (or z). u From a z-R relationship, we can convert z into R. u z = AR b where A and b are empirical constants, R is rainrate in mm/h, and z is the linear radar reflectivity factor in mm 6 /m 3. u Use: z = 200R 1.6, the Marshall-Palmer z-R relationship.

Similar presentations


: The mass of condensed water substance (water or ice)>")

 Atlas (1989)>")

 Condensation of water vapor onto nuclei (dust,>")

 -12 dBZ. Echoes in clear air from insects Common is summer. Watch for echoes to expand area as sun sets and insects.>")


 in text.>")

