Download presentation
Presentation is loading. Please wait.

1
Health Informatics April 8, 10 2013 Geoffrey Fox gcf@indiana.edu http://www.infomall.org/ Associate Dean for Research and Graduate Studies, School of Informatics and Computing Indiana University Bloomington 2013

3
Big Data and Health

4
Big Data Ecosystem in One Sentence Use Clouds running Data Analytics processing Big Data to solve problems in X-Informatics X = Health, Medical, Bio, Biomedical, Chem, Pathology, Lifestyle

5
Types of Biomedical Big Data Problems Pervasive Health Sensors including data entered into or from smart phones (events) Radiology (images) Genomics/Proteomics Electronic medical records sizewise dominated by omics and images? – Updated by events Classic data access and sophisticated datamining

6
Modality Part B non HMO All Medicare All Population Per 1000 persons Ave study size (GB) Total annual data generated in GB CT22 million 29 million 87 million2870.2521,750,000 MR7 million9 million26 million860.25,200,000 Ultrasound40 million 53 million 159 million5220.115,900,000 Interventional10 million 13 million 40 million1310.28,000,000 Nuclear Medicine10 million 14 million 41 million1350.14,100,000 PET1 million 2 million80.1200,000 Xray, total incl. mammography 84 million 111 million 332 million1,0910.0413,280,000 All Diagnostic Radiology 174 million229 million 687 million2,2590.168,700,000 68.7 PETAbytes Ninety-six percent of radiology practices in the USA are filmless and Table below illustrates the annual volume of data across the types of diagnostic imaging; this does not include cardiology which would take the total to over 10 9 GB (an Exabyte). http://grids.ucs.indiana.edu/ptliupages/publications/Where%20does%20all%20the%20data%20come%20from%20v7.pd
.")
7
Why need cost effective Computing! Full Personal Genomics: 3 petabytes per day http://www.genome.gov/sequencingcosts/

9
http://quantifiedself.c om/larry-smarr/

10
Quantified Self 1.New approach to democratic science 2.“Open access” for medical data 3.Flip side of privacy

11
2005-20011 Job request at European Bioinformatics Institute EBI for Web hits and automated services WS http://www.ebi.ac.uk/Information/Brochures/

12
2005-20011 Data stored at European Bioinformatics Institute EBI http://www.ebi.ac.uk/Inf ormation/Brochures/

13
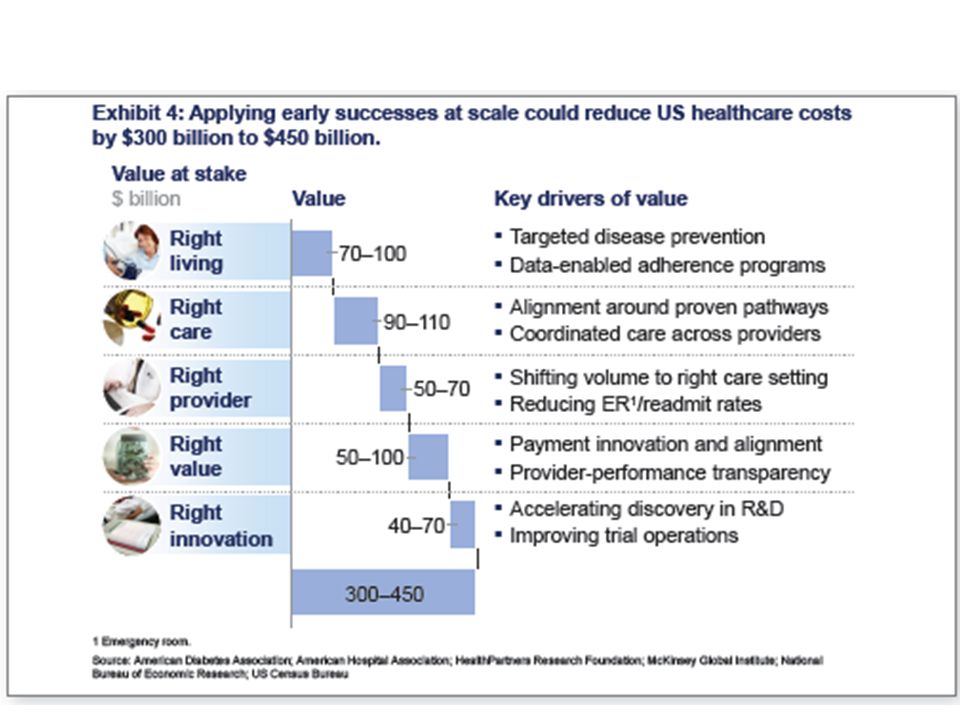
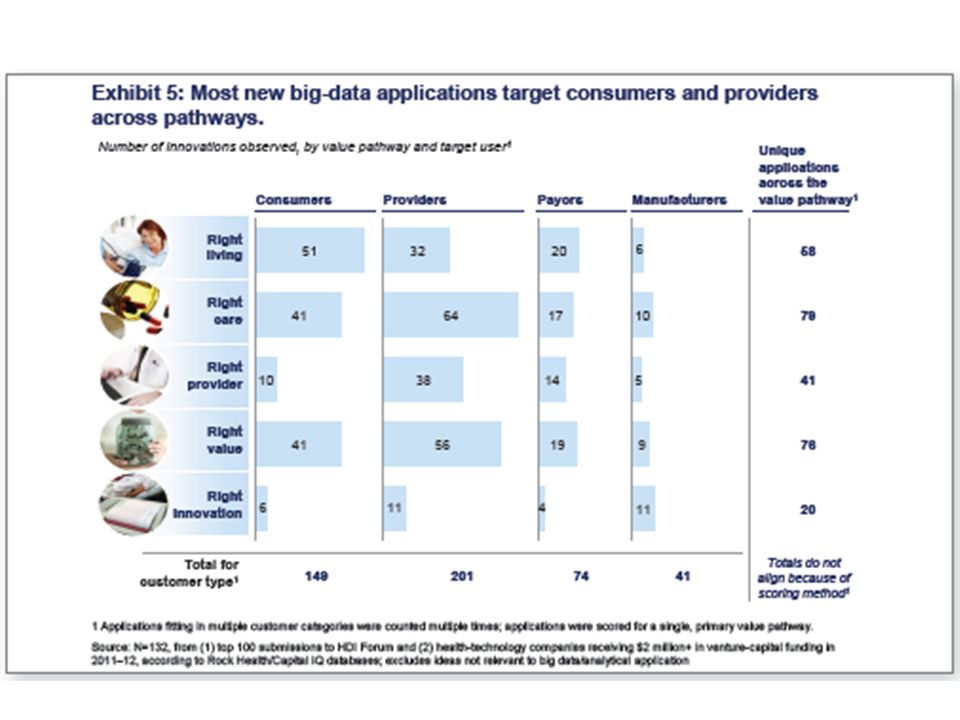
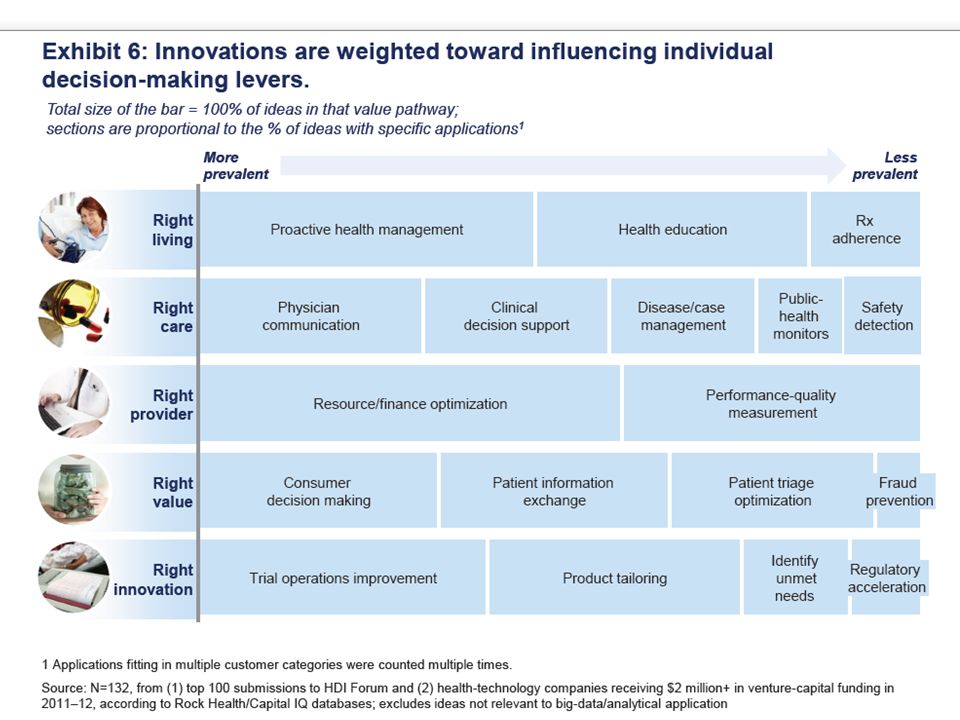
McKinsey Report on The big-data revolution in US health care: Accelerating value and innovation April 2013 Full http://www.mckinsey.com%2F~%2Fmedia%2Fmckinsey%2Fdotcom%2Fclient_service%2FHealthcare%2520Systems %2520and%2520Services%2FPDFs%2FThe_big_data_revolution_in_healthcare.ashx Summary http://www.mckinsey.com/~/media/McKinsey/dotcom/Insights/Health%20care/The%20big- data%20revolution%20in%20US%20health%20care/The%20big- data%20revolution%20in%20US%20health%20care%20Accelerating%20value%20and%20innovation.ashx http://www.mckinsey.com/~/media/McKinsey/dotcom/Insights/Health%20care/The%20big- data%20revolution%20in%20US%20health%20care/The%20big- data%20revolution%20in%20US%20health%20care%20Accelerating%20value%20and%20innovation.ashx

23
Microsoft Report https://partner.microsoft.com/downl oad/global/40193764

24
The promise of Big Data to transform health and social services comes from new capabilities to increases “Data Convergence” opportunities. Section 2: Big Data in Health 24 Table of Contents https://partner.microsoft.com/download/global/40193764

25
Section 2: Big Data in Health 25 Table of Contents https://partner.microsoft.com/download/global/40193764

26
EU Report http://ec.europa.eu/information_society/activities/he alth/docs/policy/taskforce/redesigning_health-eu- for2020-ehtf-report2012.pdf

27
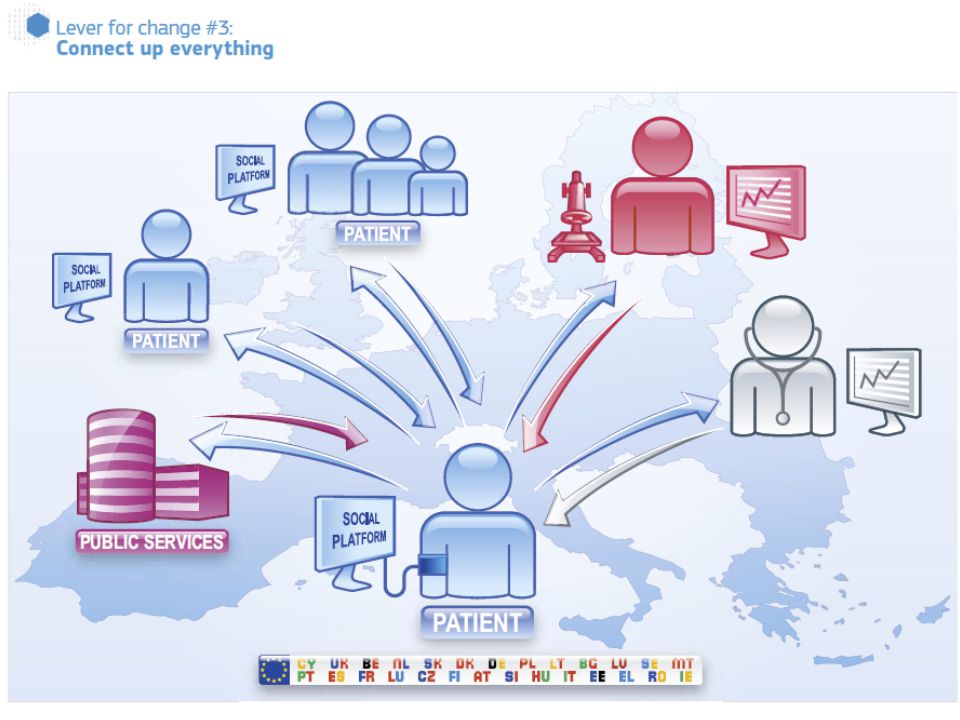
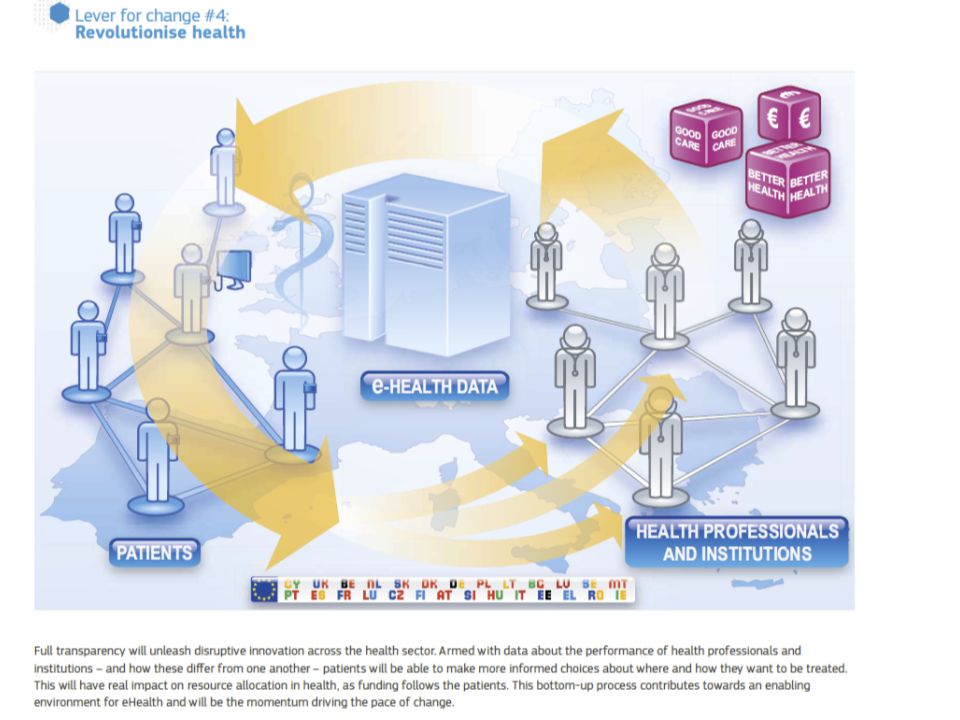
Use the power of data Data often sits in silos in primary, secondary and tertiary health institutions. This silo mentality mirrors the way that health professionals guard their own competence and areas of expertise. In the new era of eHealth, this has to end. Multidisciplinary teams of different actors, not all of whom are healthcare professionals, are part of future picture of health. Currently there is a sharp divide between ‘official’ medical data and the wealth of other health information generated by users that is not used for care. We need to find a way of making this data more trustworthy. The key question is what people do with this information and how they can use it. New rules are needed to define how to integrate official data and user data to create a more holistic picture of patient situation for health care as well provide early feedback for preventive care. Certification of applications is one way forward but it should be based on a set of principles for how health related data should be treated rather than regulation. Health institutions must publish the data on their performance and health outcomes. This information should be regularly collected, comparable and publicly available. This will support a drive to the top as high performing organisations and individuals can be identified and used as an example to inspire change. In health, performance is not just how efficiently the system operates but also the patient experience of the care. Publication of such data in other sectors has led to strong public demand for better performance and a greater focus on accountability and results. http://ec.europa.eu/information_society/activities/health/docs/policy/taskforce/r edesigning_health-eu-for2020-ehtf-report2012.pdf

33
Clouds and Health

34
Medical Cloud Start up

35
Healthcare & Cloud Computing Patient’s information would be stored in a cloud Accessed and managed over the Internet Since we are on a paperless route, this is a great idea to store information Authorized users Information on one cloud is connected to bigger clouds –Ex. Big Bend RHIO connected to the NHIN http://healthinformatics.wikispaces.com/file/view/cloud_computing.ppt

36
Considerations With Cloud Computing in Healthcare Since information is stored over the Internet, precautions must be taken Cloud system must conform to the HIPAA act –Personal Health Information –Secure transmission of PHI over the Internet –Need to maintain a secure, safe, and authorized environment for the prevention of information leakage

37
Advantages of Cloud Computing Low costs –Outsourcing information reduces amount spent on new technology –Easier to maintain More secure –Companies are hired to watch over the information Interoperability –Access information from anywhere –Can be accessed using different devices

38
Advantages of Cloud Computing Increases the adoption of EMRs Beneficial for small companies Easy to share information among different organizations and doctors

39
Cloud Computing Disadvantages Security is the main disadvantage of cloud computing Consumers are worried about Insurance companies getting a hold of there information and discriminating based upon current medical conditions they may have or medical conditions that they could develop later in life. They are also worried about government agencies getting a hold of there information and exploiting it to third party vendors, or there place of work.

40
Disadvantages Cont. The cloud companies do not always handle all of the security themselves and sometimes pass it off to third party vendors Consumers need to make sure to thoroughly check out these companies to see who else they are involved with and check out there reputation to see if you trust them to not share your information with any other outside sources. If the third party vendor looks trustworthy then you are probably safe to send your medical records over the cloud safely.

41
Genomic Proteomics and Information Visualization So far genome not a major part of Big Open Data in medicine

42
Genomics in Personal Health Suppose you measured everybody’s genome every 2 years 30 petabits of new gene data per day factor of 100 more for raw reads with coverage Data surely distributed 1.5*10 8 to 1.5*10 10 continuously running present day cores to perform a simple Blast analysis on this data Amount depends on clever hashing and maybe Blast not good enough as field gets more sophisticated Analysis requirements not well articulated in many fields – See http://www.delsall.org for life scienceshttp://www.delsall.org LHC data analysis well understood – is it typical? LHC Pleasing parallel (PP) – some in Life Sciences like Blast also PP 42
 – some in Life Sciences like Blast also PP 42.")
43
DNA Sequencing Pipeline Visualization Plotviz Blocking Sequence alignment MDS Dissimilarity Matrix N(N-1)/2 values FASTA File N Sequences Form block Pairings Pairwise clustering Illumina/Solexa Roche/454 Life Sciences Applied Biosystems/SOLiD Internet Read Alignment ~300 million base pairs per day leading to ~3000 sequences per day per instrument ? 500 instruments at ~0.5M$ each MapReduce MPI

44
COG: Clusters of Orthologous Groups Visualizing PSU 44 COG database was developed by NCBI. Proteins classified into groups with common function encoded in complete genomes. Prokaryotes (COG): 66 genomes, 200K proteins, 5K clusters. Eukaryotes (KOG): 7 genomes, 113K proteins, 5K clusters. Valuable scientific resource: 5K citations. Last updated: 2006. ECMLS 2012
: 66 genomes, 200K proteins, 5K clusters. Eukaryotes (KOG): 7 genomes, 113K proteins, 5K clusters. Valuable scientific resource: 5K citations. Last updated: ECMLS")
45
Protein Sequence Universe Visualizing PSU 45 PSU Goal: Enhance annotation resources with analytic and visualization (browser) tools. One component of PSU is to project sequence data into 3D using multidimensional scaling (MDS). MDS interpolation allows expanding the universe without time consuming all vs all O(N 2 ) 3D map allows much faster interpolation Use set of pairwise dissimilarities – don’t do MSA – so don’t have vectors in some space ECMLS 2012
. MDS interpolation allows expanding the universe without time consuming all vs all O(N 2 ) 3D map allows much faster interpolation Use set of pairwise dissimilarities – don’t do MSA – so don’t have vectors in some space ECMLS")
46
https://portal.futuregrid.org High Performance Dimension Reduction and Visualization Need is pervasive – Large and high dimensional data are everywhere: biology, physics, Internet, … – Visualization can help data analysis Visualization of large datasets with high performance – Map high-dimensional data into low dimensions (2D or 3D). – Need Parallel programming for processing large data sets – Developing high performance dimension reduction algorithms: MDS(Multi-dimensional Scaling) GTM(Generative Topographic Mapping) DA-MDS(Deterministic Annealing MDS) DA-GTM(Deterministic Annealing GTM) – Interactive visualization tool PlotViz
 GTM(Generative Topographic Mapping) DA-MDS(Deterministic Annealing MDS) DA-GTM(Deterministic Annealing GTM) – Interactive visualization tool PlotViz.")
47
Multi-Dimensional Scaling (MDS) Visualizing PSU 47 Sammon‘s objective function is dissimilarity measure between sequences i and j d is Euclidean distance (here in 3D for visualization) between projections x i and x j Denominator chosen to get larger contribution in objective function from smaller dissimilarities f is monotone transformation of dissimilarity measure chosen “artistically” ECMLS 2012
 Visualizing PSU 47 Sammon‘s objective function is dissimilarity measure between sequences i and j d is Euclidean distance (here in 3D for visualization) between projections x i and x j Denominator chosen to get larger contribution in objective function from smaller dissimilarities f is monotone transformation of dissimilarity measure chosen artistically ECMLS 2012")
48
Typical Metagenomics MDS ECMLS 2012Visualizing PSU 48

49
https://portal.futuregrid.org Metagenomics 49 http://salsahpc.indiana.edu/millionseq/mina/16SrRNA_index.html

50
MDS Details ECMLS 2012Visualizing PSU 50 f chosen heuristically to increase the ratio of standard deviation to mean for and to increase the range of dissimilarity measures. O(n 2 ) complexity to map n sequences into 3D. MDS can be solved using EM (SMACOF – fastest but limited) or directly by Newton's method (it’s just 2 ) Used robust implementation of nonlinear 2 minimization with Levenberg-Marquardt 3D projections visualized in PlotViz
 complexity to map n sequences into 3D. MDS can be solved using EM (SMACOF – fastest but limited) or directly by Newton s method (it’s just 2 ) Used robust implementation of nonlinear 2 minimization with Levenberg-Marquardt 3D projections visualized in PlotViz.")
51
MDS Details ECMLS 2012Visualizing PSU 51 Input Data: 100K sequences from well-characterized prokaryotic COGs. Proximity measure: sequence alignment % scores Scores calculated using Needleman-Wunsch Scores “ sqrt 4D” transformed and fed into MDS Analytic form for transformation to 4D ij n decreases dimension n > 1; increases n < 1 “sqrt 4D” reduced dimension of distance data from 244 for ij to14 for f( ij ) Hence more uniform coverage of Euclidean space
 Hence more uniform coverage of Euclidean space.")
52
3D View of 100K COG Sequences Visualizing PSU 52 ECMLS 2012

53
Cluster Annotation Visualizing PSU 53 COGAnnotationUniref100 COG1131ABC-type multidrug transport system, ATPase component14406 COG1136 ABC-type antimicrobial peptide transport system, ATPase component7306 COG1126ABC-type polar amino acid transport system, ATPase component4061 COG3839ABC-type sugar transport systems, ATPase component4121 COG0444 ABC-type dipeptide/oligopeptide/nickel transport system ATPase comp3520 COG4608ABC-type oligopeptide transport system, ATPase component3074 COG3842ABC-type spermidine/putrescine transport systems, ATPase comp3665 COG0333Ribosomal protein L321148 COG0454Histone acetyltransferase HPA2 and Related acetyltransferases14085 COG0477Permeases of the major facilitator superfamily48590 COG1028Dehydrogenases with different specificities37461 ECMLS 2012

54
Selected Clusters Visualizing PSU 54 ECMLS 2012

55
https://portal.futuregrid.org Metagenomics with 3 Clustering Methods DA-PWC 188 Clusters; CD-Hit 6000; UCLUST 8418 DA-PWC doesn’t need seeding like other methods – All clusters found by splitting 55 # Clusters

56
https://portal.futuregrid.org Advantages of GTM Computational complexity is O(KN), where – N is the number of data points – K is the number of latent variables or clusters. K << N Efficient, compared with MDS which is O(N 2 ) Produce more separable map (right) than PCA (left) 56 PCA GTM Oil flow data 1000 points 12 Dimensions 3 Clusters
 Produce more separable map (right) than PCA (left) 56 PCA GTM Oil flow data 1000 points 12 Dimensions 3 Clusters.")
57
https://portal.futuregrid.org Data Mining Projects using GTM PubChem data with CTD visualization About 930,000 chemical compounds are visualized in a 3D space, annotated by the related genes in Comparative Toxicogenomics Database (CTD) Chemical compounds reported in literatures Visualized 234,000 chemical compounds which may be related with a set of 5 genes of interest (ABCB1, CHRNB2, DRD2, ESR1, and F2) based on the dataset collected from major journal literatures Visualizing 215 solvents by GTM- Interpolation 215 solvents (colored and labeled) are embedded with 100,000 chemical compounds (colored in grey) in PubChem database 57
 Chemical compounds reported in literatures Visualized 234,000 chemical compounds which may be related with a set of 5 genes of interest (ABCB1, CHRNB2, DRD2, ESR1, and F2) based on the dataset collected from major journal literatures Visualizing 215 solvents by GTM- Interpolation 215 solvents (colored and labeled) are embedded with 100,000 chemical compounds (colored in grey) in PubChem database 57")
58
https://portal.futuregrid.org DA-PLSA with DA-GTM Corpus (Set of documents) Corpus (Set of documents) Embedded Corpus in 3D Corpus in K-dimension DA-PLSA DA-GTM
 Corpus (Set of documents) Embedded Corpus in 3D Corpus in K-dimension DA-PLSA DA-GTM")
59
https://portal.futuregrid.org

60
60 Dimension Reduction/MDS helps address You can get answers (from clustering) but do and how do you believe them! LC-MS 2D Pathology 54D Lymphocytes 4D

61
https://portal.futuregrid.org Phylogenetic tree using MDS 61 200 Sequences (126 centers of clusters found from 446K) Tree found from mapping sequences to 10D using Neighbor Joining Whole collection mapped to 3D 2133 Sequences Extended from set of 200 Trees by Neighbor Joining in 3D map Silver Spheres Internal Nodes
 Tree found from mapping sequences to 10D using Neighbor Joining Whole collection mapped to 3D 2133 Sequences Extended from set of 200 Trees by Neighbor Joining in 3D map Silver Spheres Internal Nodes")
Similar presentations


 University.>")


