Download presentation
Presentation is loading. Please wait.

1
The Sun

2
Sun Fact Sheet The Sun is a normal G2 star, one of more than 100 billion stars in our galaxy. Diameter: 1,390,000 km (Earth 12,742 km or nearly 100 times smaller) Mass: x 1030 kg (333,000 times Earth’s mass) Temperature: 5800 K (surface) 15,600,000 K (core) The Sun contains more than 99.8% of the total mass of the Solar System (Jupiter contains most of the rest). Chemical composition: Hydrogen 92.1% Helium 7.8% Rest of the other 90 naturally occurring elements: 0.1%
 Mass: x 1030 kg (333,000 times Earth’s mass) Temperature: 5800 K (surface) 15,600,000 K (core) The Sun contains more than 99.8% of the total mass of the Solar System (Jupiter contains most of the rest). Chemical composition: Hydrogen 92.1% Helium 7.8% Rest of the other 90 naturally occurring elements: 0.1%")
3
The Sun and its Planets to Scale

4
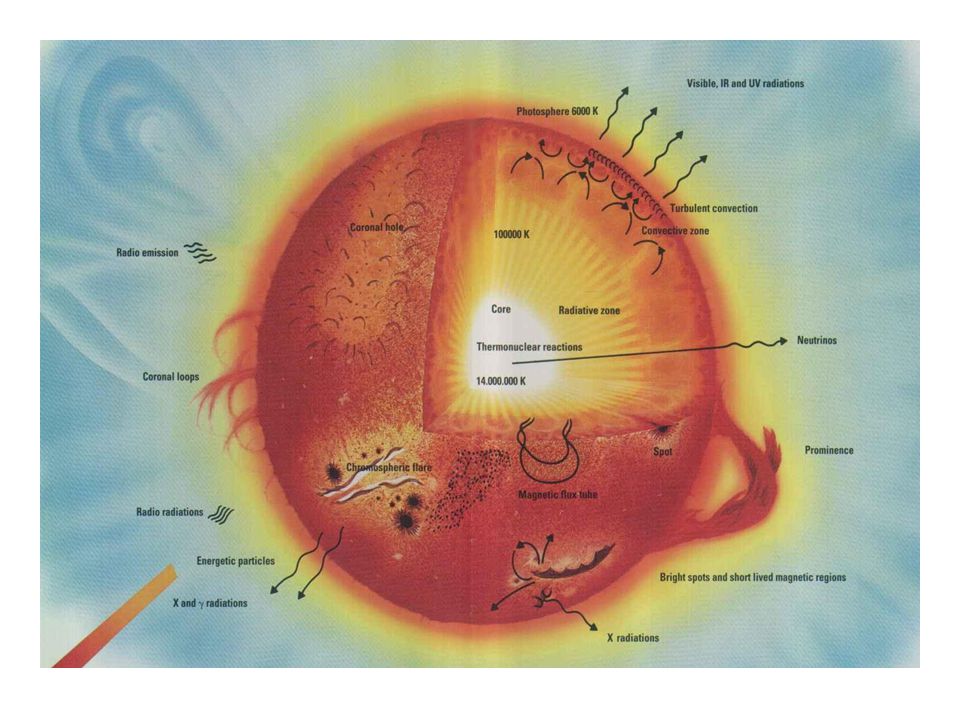
Energy is created in the core when hydrogen is fused to helium
Energy is created in the core when hydrogen is fused to helium. This energy flows out from the core by radiation through the radiative layer, by convection through the convective layer, and by radiation from the surface of the photosphere, which is the portion of the Sun we see.

6
Energy from the Sun passes through an imaginary disc that has a diameter equal to the Earth's diameter. The flux of energy through the disc is 1370 watts per square meter. The amount of energy that hits a square meter on the Earth's surface is maximum at the point where the incoming radiation is perpendicular to the Earth's surface.

7
The seasons occur because the tilt of the Earth's axis keeps a constant orientation as the Earth revolves around the Sun. A. Summer in northern hemisphere. B. Winter in southern hemisphere

8
Sun does not rotate as a rigid sphere
Sun does not rotate as a rigid sphere. The equator of the Sun rotates faster than the poles of the Sun. This is called the differential rotation. Sunspots and many other solar activities are due to this differential rotation.

9
Internal Rotation False color image showing a theoretical model of relatively hotter (red) and colder (blue) regions in the solar interior. The red layer may be a shear region between the radiative and convective zones, powering a dynamo that gives rise to the Sun’s magnetic field.

10
Sun’s Magnetic Field The Sun's corona is threaded with a complex network of magnetic fields. Solar storms and flares result from changes in the structure and connections of these fields. When some of the Sun's magnetic field lines are filled with hot gas, we see a magnetic loop.

11
X-ray images of the Sun taken by the Yohkoh spacecraft, showing changes in the corona in 1991 (left) at a solar maximum to 1995, a solar minimum (right). The most rapid changes to the Sun's magnetic field occur locally, in restricted regions of the magnetic field. However, the entire structure of the Sun's global magnetic field changes on an 11 year cycle. Every 11 years, the Sun moves through a period of fewer, smaller sunspots, prominences, and flares - called a "solar minimum" - and a period of more, larger sunspots, prominences and flares - called a "solar maximum.“ After 11 years, when the next cycle starts, the magnetic field poles are reversed. The last solar minimum was in 2006

12
Sunspots Sunspots appear as dark spots on the surface of the Sun. Temperatures in the dark centers of sunspots drop to about 3700 K (compared to 5700 K for the surrounding photosphere). They typically last for several days, although very large ones may live for several weeks.
. They typically last for several days, although very large ones may live for several weeks.")
13
Spectrum analysis shows that sunspots have strong magnetic field, about 1000 times stronger than the Sun's average. Sunspots usually appear in pairs. The two sunspots of a pair have different polarities, one would be a magnetic north and the other is a magnetic south, and can be joined by magnetic field lines. The strong magnetic field locks the gas of the photosphere in places and inhibits the hotter gas below to rise at the sunspots. As a result, the sunspots are cooler. Sunspots appear to coincide with changes in the climate of the Earth. Studies show that during the last ice age, there were very few sunspots

14
The sunspot cycle over the past 400 years
The sunspot cycle over the past 400 years. Note the period before 1700, when, for reasons that are not understood, very few sunspots were observed. Sunspots have reached a maximum about every 11 years since 1700, and there is also a suggestion of some sort of cycle on a 55- to 57-year time scale. Because the pre-1700 period of low sunspot activity coincides with a prolonged cool period that is sometimes called the Little Ice Age, some scientists have speculated that sunspot activity and climate are connected somehow.

16
Granules Convection from inside the sun causes the photosphere to be subdivided into km cells. Energy rises to the surface as gas wells up in the cores of the granules, and cool gas sinks around their edges.

17
Temperature of the Sun’s Atmosphere

18
Solar Prominences Prominences are dense clouds of material suspended above the surface of the Sun by loops of magnetic field. Prominences can remain in a quiet or quiescent state for days or weeks. However, as the magnetic loops that support them slowly change, prominences can erupt and rise off of the Sun over the course of a few minutes or hours

19
Solar Flares Solar flares are tremendous explosions on the surface of the Sun. In a matter of just a few minutes they heat material to many millions of degrees and release as much energy as a billion megatons of TNT. They occur near sunspots, usually along the dividing line (neutral line) between areas of oppositely directed magnetic fields. Images from SOHO* *NASA/ESA Solar and Heliospheric Observatory spacecraft
 between areas of oppositely directed magnetic fields. Images from SOHO* *NASA/ESA Solar and Heliospheric Observatory spacecraft.")
20
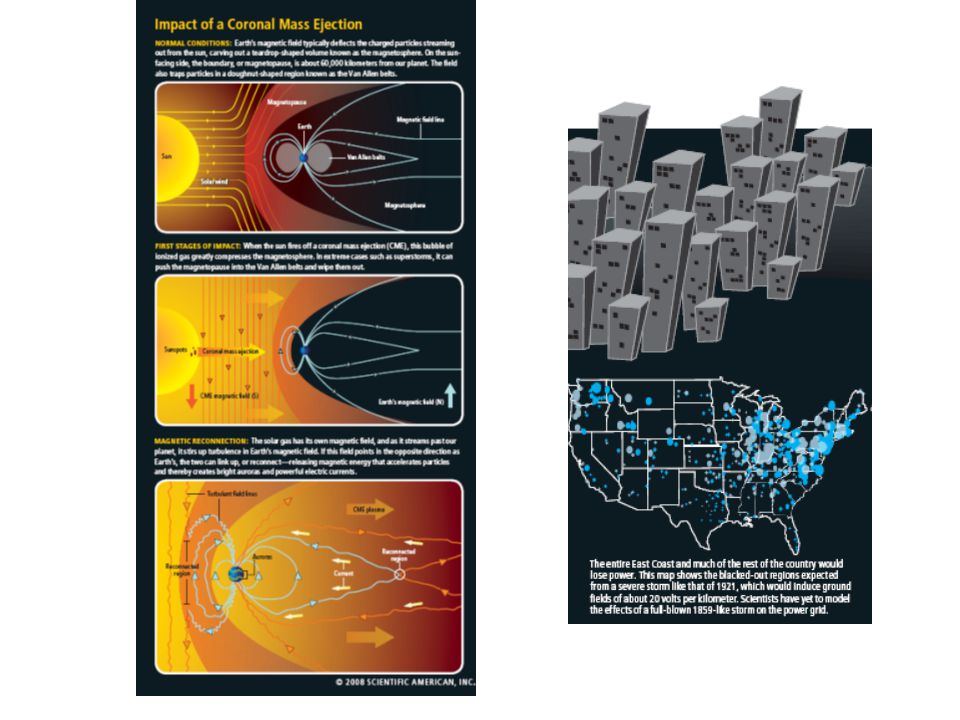
Coronal Mass Ejections (CMEs)
Coronal mass ejections (CMEs) are huge bubbles of gas threaded with magnetic field lines that are ejected from the Sun over the course of several hours. CMEs disrupt the flow of the solar wind and produce disturbances that strike the Earth with sometimes catastrophic results.
 are huge bubbles of gas threaded with magnetic field lines that are ejected from the Sun over the course of several hours. CMEs disrupt the flow of the solar wind and produce disturbances that strike the Earth with sometimes catastrophic results.")
22
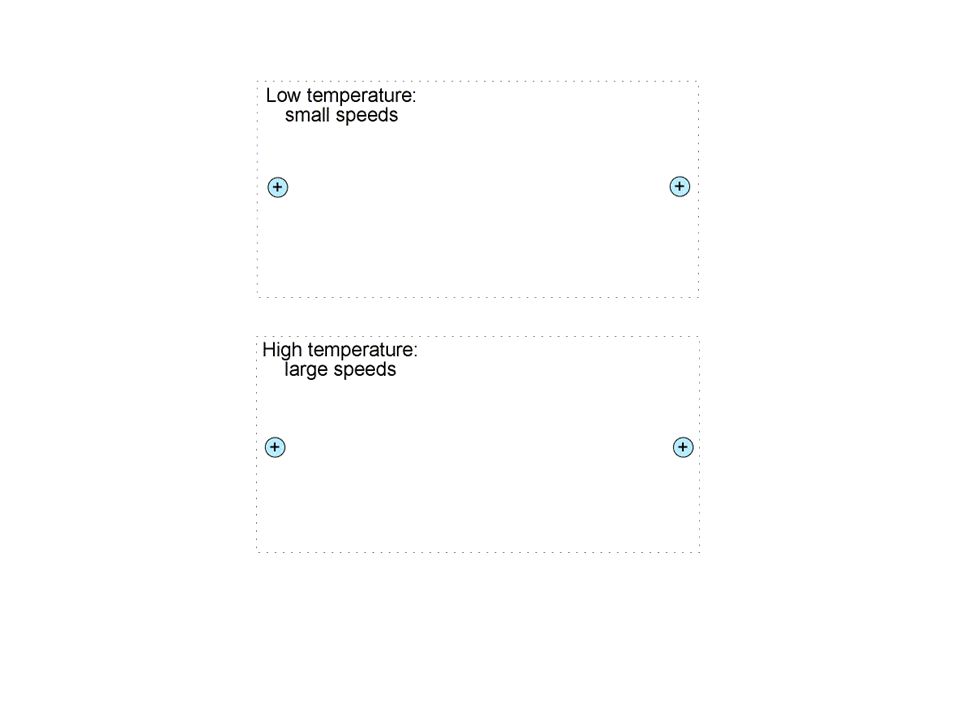
Corona and Solar Wind The Sun’s Corona is forever expanding into interplanetary space filling the solar system with a constant flow of solar wind. Solar wind is the continuous flow of charged particles (ions, electrons, and neutrons) that comes from the Sun in every direction. Solar wind consists of slow and fast components. Slow solar wind is a consequence of the corona’s high temperature. The speed of the solar wind varies from less than 300 km/s (about half a million miles per hour) to over 800 km/s.
 that comes from the Sun in every direction. Solar wind consists of slow and fast components. Slow solar wind is a consequence of the corona’s high temperature. The speed of the solar wind varies from less than 300 km/s (about half a million miles per hour) to over 800 km/s.")
23
Solar wind shapes the Earth's magnetosphere and magnetic storms are illustrated here as approaching Earth. These storms, which occur frequently, can disrupt communications and navigational equipment, damage satellites, and even cause blackouts. The white lines represent the solar wind; the purple line is the bow shock line; and the blue lines surrounding the Earth represent its protective magnetosphere.

24
Solar wind blows at 50-year low
Wednesday, 24 September :19 UK Solar wind blows at 50-year low The solar wind - the stream of charged particles billowing away from the Sun - is at its weakest for 50 years. Scientists made the assessment after studying 18 years of data from the Ulysses satellite which has sampled the space environment all around our star. They expect the reduced output to have effects right across the Solar System. Indeed, one impact is to diminish slightly the influence the Sun has over its local environment which extends billions of kilometres into space. The charged wind particles also carry with them the Sun's magnetic field, and this has a protective role in limiting the number of high-energy cosmic rays that can enter the Solar System. More of them will probably now make their way through.

25
A blackbody is a theoretical object which is a perfect radiator.
The Sun's spectrum is nearly identical to that of a blackbody radiator. The minor differences occur because gases in the chromosphere and corona selectively absorb some wavelengths of the electromagnetic radiation emitted by the Sun.

26
The energy flux from blackbody radiators at different temperatures
The energy flux from blackbody radiators at different temperatures. Note how the radiation peak moves to shorter wavelengths as the temperature increases. The area under any one curve is the total flux of energy emitted by a radiator at a given temperature. Note that the higher the temperature, the greater the flux.

27
Stars as Blackbody Radiators
Note that only for yellowish stars is the radiation peak in the visible range. For reddish, white, and bluish-white stars, the radiation peaks lie outside the visible range. We can see such stars because they do emit some radiation in the visible range.

28
Hertzsprung-Russell diagram of star luminosity versus surface temperatures. The vertical axis is a comparative one based on the Sun having a luminosity of 1. The horizontal axis is reversed from the normal order, with values of surface temperature increasing to the left. Note that the Sun is a middle-range, main-sequence star.

30
Thermonuclear fusion heats the inside of the star, creating pressure that stops the collapse and producing a long period of great stability that defines the main sequence.

31
By mass, about 70% of the Sun is hydrogen. The rest is mostly 4He.
Hydrogen is the fuel of the nuclear reaction in the core of the Sun, and helium is the product. Most of the helium is not produced by the Sun. It was already there when the Sun was formed.

35
Anticipated Future of the Sun

36
Life Cycle of the Sun Birth:
Gravitational Collapse of Interstellar Cloud "Hayashi Contraction" of Protostar Life: Stability on Main-Sequence Long life - energy from nuclear reactions in the core (E = mc2) Death: Lack of fuel, instability, variability expansion (red giant, then white dwarf)
 Death: Lack of fuel, instability, variability expansion (red giant, then white dwarf)")
Similar presentations