Download presentation
Presentation is loading. Please wait.

1
GIS in Health and Crime Analysis Stan Openshaw * or Andrew Turner** School of Geography, University of Leeds Leeds LS2 9JT email: stan@geog.leeds.ac.uk * on Tuesday and Wednesday, **on Thursday

2
The Role of GIS in Health and Crime is fairly obvious! GIS provides an integrated spatial data management environment for the capture, storage, manipulation, management and mapping of relevant data Developments in computerisation and IT have allowed GIS to cover nearly all of the Health and Crime data application areas Standardisation of address data and new digital products (eg Address Point) are very relevant
 are very relevant.")
3
BUT

5
What is currently MISSING are many serious attempts to use GIS for the ANALYSIS of Health and Crime Databases

6
So an alternative title for this talk is..

7
A quick account of how to do some useful Spatial Analysis in GIS using Health and Crime Data as examples

8
Ah....?? You guessed it!! I really wanted to talk about Spatial Analysis in GIS BUT was persuaded that this might be too complex for lunchtime audiences

9
It was thought that EQUATIONS might give you indigestion!! Quite right!!! Too.. So there are no equations, no maths and absolutely no complex statistical stuff Just two things –some reasons WHY you should be doing Spatial Analysis in GIS despite the problems –some EXAMPLES of useful Spatial Analysis being done in GIS

10
Why do you want to analyse Health and Crime Data? Why ruin a perfectly good GIS with a spotless record of sparkling multicoloured mappings by also expecting it to do SPATIAL ANALYSIS as well as everything else?

11
The answer is simply... n You really have NO CHOICE! n GIS has created an imperative for mapping and analysis by putting X,Y coordinates on data that previously lacked it n People will now EXPECT you to be constantly monitoring and analysing crime and health databases for patterns

12
Unconvinced?

13
Time for a bit of AUDIENCE baiting - bashing! Question 1. Hands up if you have a database with X,Y coordinates on it or plan to have one soon? Question 2. Hands up if you do not know what an X,Y coordinate is? Question 3. Hands up if you do not know where to find accurate X,Y coordinates to add to your data?

14
Question 4. Is it silly to collect data and create GIS databases that are not fully analysed using every suitable method? Answer. YES!! Very silly!!! Question 5. Does Mapping count as analysis? Answer. NO!! It is the display of data that have been damaged, had various biases and noise added, and may mislead you. Something far more powerful is needed.

15
Mapping is not ANALYSIS!!

17
Question 6. Will a statistical package such as SPSS or SAS help? Answer. No. This is a major problem. Most statistical methods do not work well or at all on geographical data. Sad isn’t it!!! Question 7. What about S+? Answer. No!!! NO!! NO!!!!!!!!!

18
Question 7. My GIS has a Spatial Analysis Module or Section. Will that do? Answer. Grow up!! Get wise!! What the GIS vendor’s tell you is spatial analysis is really only spatial data manipulation

19
Gulp!

20
Question 8. So is my GIS TOTALLY USELESS at SPATIAL ANALYSIS and cannot offer much relevant assistance? Answer. YES..Sorry. Did no one ever tell you?

21
Question 9. What about this Getis G statistic thingey and Moran’s autocorrelation coefficient? Answer. Quite useless!!

22
Ah!.. Well maybe we should keep quite about this Spatial Analysis deficiency. Sounds rather too academic for us practitioners. Also as no one does it (since they cannot) therefore no one probably wants it!
 therefore no one probably wants it!.")
23
Wrong!

24
Enter Joe Blogs.. “Excuse me.. are you saying that you collect data you do not fully analyse which I pay for? Yes but it is not a problem!

25
Joe Blogs..... “Excuse me.. are you saying that the analysis of DISEASES that might kill me or of CRIMES that might harm me is not important? Yes... but there is no problem.. we know what is going on out there.

26
“How!! If you are not doing analysis HOW DO YOU KNOW what is going on? I might die prematurely because of you or have my car stolen and wrecked because of your ignorance and failure to do your job properly!”

27
I exaggerate to make a point! There is a strong imperative to analyse geographical information if it is important to do so. Crime and Health Databases are IMPORTANT It is surely important that are fully analysed using state of the art methods

28
Spatial Analysis Crime.. Occurs when people collect, manage, store, cherish, archive, and map BUT not analyse data that they should analyse because it may contain patterns and processes of considerable public interest. Are you a Spatial Analysis Criminal? Do you know some others who are? There is a lot of it about right now!

29
Spatial Analysis Crime A term invented to describe users of GIS who have successfully created databases relating to all kinds of useful information BUT who then fail to ANALYSE it for whatever reasons

30
Spatial Analysis Crime is a consequence of the success of GIS in creating spatial databases and a widespread failure by users to realise that having access to a GIS is NOT SUFFICIENT because there are fundamental gaps in the GIS tool-kits

31
People DIE each year because no one BOTHERS to properly analyse DISEASE and DEATH data for unusual localised concentrations

32
People DIE each year because the spatial epidemiological analysis that is done is either too limited or too academic research orientated or based on inappropriate technology that basically does not work

33
Criminals ESCAPE Detection because no one BOTHERS to properly analyse the real- time on-line crime data that already exists

34
Lets have a closer look at Police IT! Some facts –most police forces have installed or are installing Command and Control Systems that have GIS capabilities –most have on-line crime recording with accurate X,Y coordinates –Police IT costs US lots of money –most Police Forces do little or no Crime Pattern Analysis and no localised crime forecasting?

35
A Home Office Consultative paper “Getting to Grips with Crime” Sept 1997 Creates a new need for local Crime Pattern Analysis and Crime Audits Generates a new need for the analysis of BS7666 spatially referenced crime data And...

36
According to a survey of Local Authorities in England and Wales in July 1996, some 62% undertook local Crime Pattern Analysis! Much depends what is meant by ANALYSIS! Crime counts for Police Beats is not spatial analysis or Crime Pattern Analysis! Drawing maps is NOT spatial analysis!

37
Lets look at Health IT Even more of our money spent here than with Police IT Databases cover most aspects of health, disease, vaccinations, hospital visits, deaths, etc They have done so for quite a while! Extensive national databases exist with fairly geographic referencing

38
So WHY is there so little spatial analysis? Many reasons –absolute confidentiality –owned by this or that consultant or trust or charity –ethical approval needed –more important to treat patients that spot patterns –a massive over-emphasis on causal explanation rather than pattern spotting and identifying persistent but circumstantial associations

39
GIS needs spatial analysis methods that are exploratory There are few or no hypotheses to test which paralyses conventional approaches Here more than anywhere else there is a rigid and unyielding addiction to confirmatory approaches (viz.. hypothesis testing) BUT...
 BUT....")
40
What happens if you have no hypothesis to test?

41
a blank slide

42
A category of REAL Spatial Analysis needs are essentially anomalous pattern detection Nothing too clever! Hypothesis testing is more research that an operational GIS activity Pattern detection via monitoring GIS databases will meet most immediate needs So why is not it being routinely done????

43
NO Software!

44
No SOFTWARE! GIS vendors see no need to provide any They argue there is no market They think it is too specialised and too complex for themselves to support They have been scared off by statisticians There is no consensus amongst researchers as to WHAT methods should be used AND..

45
Most serious of all.. there are no EXISTING techniques the vendors can re-code, copyright and thus own!

46
Spatial Analysis is also SPECIAL because unlike much of GIS there was little pre-GIS spatial analysis activity and hence the cost- benefit analysis is harder to perform

47
GIS has created a need for Spatial Analysis as a spin-off of its success! The vendors do not know how to cope with these needs and the users are deprived of relevant technology and have to try and make do the best they can.

48
Many Spatial Data Bases are now available for analysis BUT very few suitable spatial analysis tools exist that can cope with BOTH the data and the users

49
The Available Methods can be classified as follows..

50
almost a blank slide

51
The principal problem is an almost complete absence of suitable Geographical Analysis Technology (GAT) for use within GIS
 for use within GIS")
52
MapInfo (for example) defines spatial analysis as follows: “An operation that examines data with the intent to extract or create new data that fulfills some required condition or conditions. It includes such GIS functions as polygon overlay or buffer generation and concepts of contains, intersects, within or adjacent.” (Page 396, MapInfo Professional: User Guide, 1995)
.")
53
Yet drawing Maps is not a very good idea

54
Map based Visualization and Analysis is a simple but fundamentally flawed technology 6 maps can tell lies 6 map stories can be manipulated 6 the analysis task is left to the viewer’s eyeballs 6 it is NOT analysis!

55
Unemployment Leeds and Bradford Wards

56
Unemployment Leeds and Bradford EDs

57
The Modifiable Areal Unit Problem (MAUP) is an ADDED complication 6 scale changes the level of generalization and thus what you see on maps 6 aggregational variability is even more devastating since often far more than a billion different sets of results for each scale!
 is an ADDED complication 6 scale changes the level of generalization and thus what you see on maps 6 aggregational variability is even more devastating since often far more than a billion different sets of results for each scale!")
58
Zones are arbitrary and modifiable

59
Unemployment Equal Population

60
Unemployment Positively correlated with Ethnic Minorities

61
Unemployment negatively correlated with unemployment

62
OK... So WHAT should you be doing?

63
The NEED is for Exploratory Spatial Data Analysis capable of being safely and easily used and understood by people who do not have higher degrees in the statistical or spatial sciences

64
The need is for automated geographical analysis machines that read data, perform some analysis, and then tell you about it in a readily understood way

65
Mark 1 Geographical Analysis Machine an early attempt at automated exploratory spatial data analysis that was easy to understand it answered a simple practical question given some X,Y point referenced data of something interesting WHERE might there be evidence of localized clustering if you do not have the foggiest idea of where to look due to lack of knowledge?

66
How does GAM work? Uses circles as a pattern a detector Study region covered with millions of overlapping circles of varying sizes A significance test is applied to each and the most interesting results used to build up a density surface of pattern strength You examine this density surface for peaks which define localised excess

67
Geographical Analysis Machine (GAM) Mark 1 history GAM/1 developed in the mid 1980s it was very computationally intensive hence the term MACHINE because it really needed a dedicated computing machine Early runs took over 1 month of CPU time on a large Mainframe (Amdahl 580) Later ran on a Cray X-MP, Y-MP, and Cray 2 super computers
 Mark 1 history GAM/1 developed in the mid 1980s it was very computationally intensive hence the term MACHINE because it really needed a dedicated computing machine Early runs took over 1 month of CPU time on a large Mainframe (Amdahl 580) Later ran on a Cray X-MP, Y-MP, and Cray 2 super computers")
68
It was developed to analyze Child Leukemia Data in Northern England GAM/1 easily spotted the suspected Sellafield Cluster BUT it also found an even stronger major new cluster in Gateshead in 1986 This is possibly the ONLY instance of a major cancer cluster being found by analysis (rather than journalism) since John Snow’s famous cholera spatial epidemiology of the mid 19th century
 since John Snow’s famous cholera spatial epidemiology of the mid 19th century")
69
BUT

70
10 years ago GAM/1 was a mixed blessing! It was praised by many geographers as a major development in useful spatial analysis technology It was severely criticized by some statisticians (mainly due to ignorance of the geography of the problem) Software for GAM was never distributed as ten years ago it was not easily run
 Software for GAM was never distributed as ten years ago it was not easily run.")
71
GAM/1: good aspects it was automated prior knowledge or ignorance was rendered irrelevant it looked for localized clusters at a time when most spatial statistical methods concentrated on global measures of pattern the search for local clusters was geographically comprehensive

72
GAM/1: Bads it needed a supercomputer and was not easy to apply because of restricted access there are multiple testing problems it upset some major statisticians who conducted a brief campaign of intensive criticism most of which turned out to be either incorrect or irrelevant or mischievous in intent

73
Some of the problems went away Criticisms faded away in the early 1990s as spatial statisticians developed a better understanding of the geography of the problem and the statistical concerns were better understood The Gateshead results were subsequently corroborated although their cause remains an official mystery?

74
But GAM was no longer being developed until...

75
International Agency for Research on Cancer (IARC) Commissioned a study in 1989-91 of different clustering methods, many developed by critics of GAM, FINALLY published in late 1996 50 synthetic cancer data sets were created for which the degree of clustering and locations of clusters were known but kept secret the data were given to the participants who performed their analyses without any knowledge of the correct results
 Commissioned a study in of different clustering methods, many developed by critics of GAM, FINALLY published in late synthetic cancer data sets were created for which the degree of clustering and locations of clusters were known but kept secret the data were given to the participants who performed their analyses without any knowledge of the correct results")
76
Methods applied without knowledge of the results were –Potthoff-Whittingham –Cuzick-Edwards –GAM-K –Besag-Newell’s method –ISD’s Original Method Later extended to include 4 others but these were applied with knowledge of the cluster locations –ISD revised –Cuzick-Edwards one sample method –Diggle-Morris K functions –CAS method

77
Results published in Alexander and Boyle (1996) It was anticipated that the statistical methods preferred by the critics of GAM would work best Much to the SURPRISE of Alexander and Boyle GAM/K was shown to be the best or equivalent best means of TESTING FOR PRESENCE OF CLUSTERING and for FINDING THE LOCATIONS OF CLUSTERS
 It was anticipated that the statistical methods preferred by the critics of GAM would work best Much to the SURPRISE of Alexander and Boyle GAM/K was shown to be the best or equivalent best means of TESTING FOR PRESENCE OF CLUSTERING and for FINDING THE LOCATIONS OF CLUSTERS")
78
Overall Performance when Detecting Clustering RankMethodPercentage Errors 1GAM/K14% 2CAS16% 3Cuzick-Edwards Revised24% 4ISD Revised28%` 5ISD Original30% 6Cuzick-Edwards Original32% 7Potthoff-Whittingham34% 8Besag-Newell40% 9Diggle-Morros46%

79
Estimated Positive Sensitivities in Finding CLUSTER locations Besag-Newell36 % Cuzick-Edwards66 % GAM/K 87%

80
Alexander and Boyle (1996) authors of the IARC study concluded: “The GAM has potential applications in this area if adequate computer resources are available. At the present time, however, the new, more sophisticated version of the GAM is complex, difficult to understand..” (p 157)
.")
81
1991 That was in 1991!!!!!!!! There were THEN TWO remaining criticisms: –(1) GAM needed a supercomputer –(2) GAM was complex Others could have been added –(3) GAM was not available for others to use –(4) GAM linkages with GIS was unclear Are these criticisms still valid today?
 GAM needed a supercomputer –(2) GAM was complex Others could have been added –(3) GAM was not available for others to use –(4) GAM linkages with GIS was unclear Are these criticisms still valid today .")
82
Reviving GAM/K GAM/K still runs on the later day version of the Cray X-MP vector supercomputer (the Cray J90) Efforts were made in 1996-7 to port the Cray X-MP code on to a Cray T3D parallel supercomputer with 512 processors BUT it failed!!!
 Efforts were made in to port the Cray X-MP code on to a Cray T3D parallel supercomputer with 512 processors BUT it failed!!!")
83
Algorithm was re-programmed from scratch But it needed an estimated 9 Days of CPU time on a single J90 processor to perform a single run Fortunately: –a modern workstation is as fast as a Cray J90 processor But.. This would hardly constitute a generally applicable and easy to use method!

84
Making GAM/K run faster Subsequent modifications to the spatial data retrieval algorithm used in GAM/K reduced the 9 days to 714 seconds on a workstation GAM/K was now a PRACTICAL tool It can be readily linked to any GIS once it no longer needed a supercomputer to run it

85
Example 1. Burglary Data for somewhere in Northern England Part of a town analyzed –71,911 Address Point houses –3,784 burglaries There is no real limit on the size of area or amount of data analysed Results are self-evident!

86
Burglaries

87
Results like this are NOT found in random data... they are REAL..various options in GAM to explore the statistical aspects further (if required) and it can be run to check on its own performance!
 and it can be run to check on its own performance!.")
88
Random Crimes

89
Example 2. Applying GAM to the Long Term Limiting Illness data from 1991 census for Northern England based on Census EDs even though this is rather coarse there are 6905 eds in the area of interest GAM works best on small area data ideally one metre grid-referenced points

90
Map of Ward Level LLTI

91
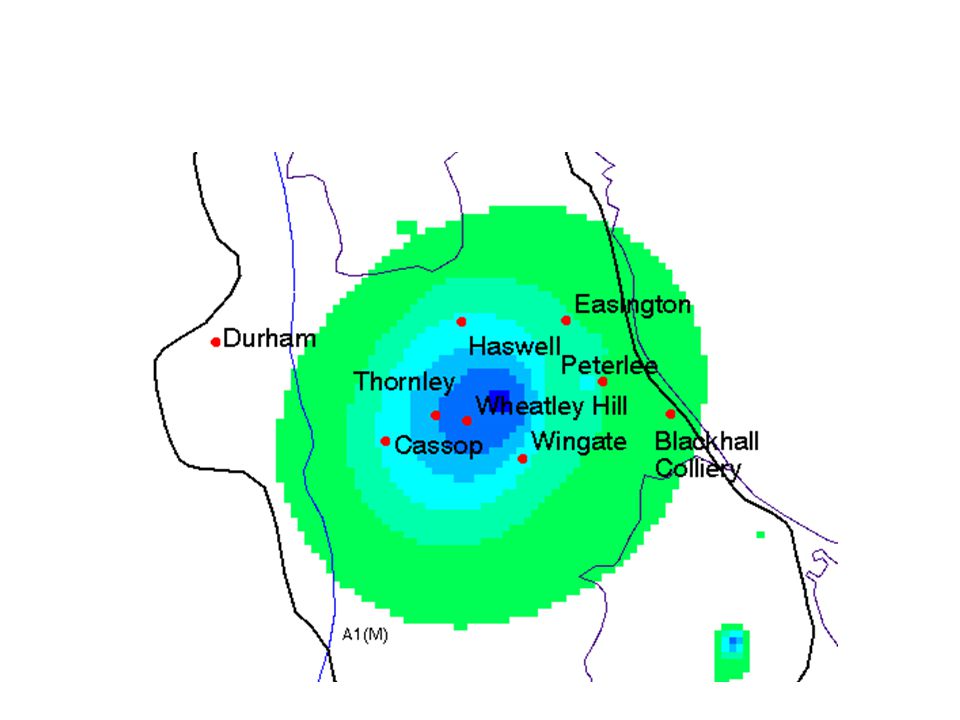
Where are the localised areas of excess?

92
All Data

93
Regional Age-Sex Covariates included

94
Results for Age-Sex Adjusted Data using Bootstrap of Excess Circle SizeThousand Number KmCirclesSignificant 0.55 14221 654 11 36211 584 1.5 626 7 418 2 359 5 149 2.5 235 3 731 3 165 2 876 4 95 1 962 5 62 1 436

95
Teeside

96
Tyneside

97
Random Data

98
GAM/K is a descriptive tool OK!! so you have found some possible clusters so what!!!!

99
But aren’t the results so self evident that merely mapping the data would be enough and a blind man with a walking stick couldn’t have helped but noticed them?

100
ROT

101
Ward LLTI Map and GAM

102
Well you PUT YOUR GEOGRAPHER’S head back on and start to relate the clusters to the underlying map patterns! What is associated with the clusters of excess? Does their DISTRIBUTION provide any clues? What is linked to the clusters of deficiency?

103
Clusters of Deficiency

104
Teeside mapped with DoE’s Deprivation Score

105
Tyneside, DoE Deprivation

106
BUT

107
this is 1997 not 1967!

108
A Geographical Explanation Machine will hunt out the map associations for you! The Geographical Correlates Exploration Machine of 1990 was a start It looked at 2 M-1 permutations of map coverages to define clusters that could be “EXPLAINED” by local spatial associations Location and GIS data layers were used as surrogates for missing explanatory variables

109
A Geographical Explanations Machine- GEM/1 Explanation here is to be interpreted in the traditional geographical sense of there being a possibly interesting localised spatial association between clusters and certain GIS data layers Maps do not cause patterns to appear BUT they do contain clues as to the processes that do if only we were clever enough to spot and decode them

110
GEM can be run in 4 modes MODE=1 is a GAM/K search for clustering MODE=2 is the use of 2 K permutations of M GIS data layers to add general covariates in an attempt to destroy the clustering (the spatial epidemiologist approach) MODE=3 examines 2 K permutations to find the strongest spatial associations with GIS layers that enhance the clustering (GCEM) MODE=4 uses 2 K permutations to add local GIS covariates to destroy the cluster
 MODE=3 examines 2 K permutations to find the strongest spatial associations with GIS layers that enhance the clustering (GCEM) MODE=4 uses 2 K permutations to add local GIS covariates to destroy the cluster")
111
Insufficient time to describe how GEM works instead we present some results using as pseudo coverages

112
Which clusters cannot be “explained” away?

114
Unexplained clusters on Tyneside

115
Clusters that can be “explained away”

116
The other GAMs MAP EXplorer (MAPEX) is an intelligent search version of GAM/K –uses Genetic Algorithm to perform search –uses AVS to create MPEG computer movies of search process Space Time Attribute Creature (STAC) extends MAPEX to multiple data domains –uses Java and web browser for animation –interactive partnership?
 is an intelligent search version of GAM/K –uses Genetic Algorithm to perform search –uses AVS to create MPEG computer movies of search process Space Time Attribute Creature (STAC) extends MAPEX to multiple data domains –uses Java and web browser for animation –interactive partnership")
117
Future Plans A ESRC project to Implement GAMs and more sophisticated GEM and Artificial Life based Geographical Analysis and Explanation Tools are planned as an Internet based distributed geographical analysis system over next 2 years If you are interested then please get in touch

118
Further Info: Email stan@geog.leeds.ac.uk ian@geog.leeds.ac.uk

Similar presentations