Download presentation
Presentation is loading. Please wait.

1
AAHAM / COPAM Retreat Annual Education Conference Lyman Sornberger Executive Director, Patient Financial Services Cleveland Clinic Foundation September 16 -17, 2010

2
Agenda Definition of Accountability Global Metrics Scheduling Financial Clearance Registration HIM Coding Edits Billing Collections Customer Service Monitoring Productivity and Quality External Controls

3
Definition of Accountability Subject to giving an account: answerable Capable of being accounted for : explainable

4
True or False? Processes supporting the Revenue Cycle are the result of evolution, not design? External requirements and changes are usually responded to by the addition of work-arounds and patches and not by fundamental process redesign? True The result is: 1.Non Standardization 2.Compliance Risk 3.Excessive Hand-off’s 4.Decreased Patient Satisfaction 5.Increased Cost 6.Untimely Data Capture

5
True or False? Accountability for the Revenue Cycle are not usually fragmented and incentives are generally aligned with the health systems mission and financial goals? False The end-result is: 1.Sub-optimal financial outcomes and frustration among management and staff. 2.Difficulty changing behavior. 3.Management fails to focus on process and focuses on functional outcomes. 4.Responsibility and Authority are not vested in the same results.

6
Performance Evaluation and Measurements The ability to monitor, assess, and improve Revenue Cycle performance relies upon the establishment of clear metrics and tools that define and COMMUNICATE performance expectations. Attributes of effective PERFORMANCE metrics are that they are: Clearly Defined Quantifiable Accessible Objective Relevant to Desired Outcomes Leading and Lagging Cascading and Multi-Level

7
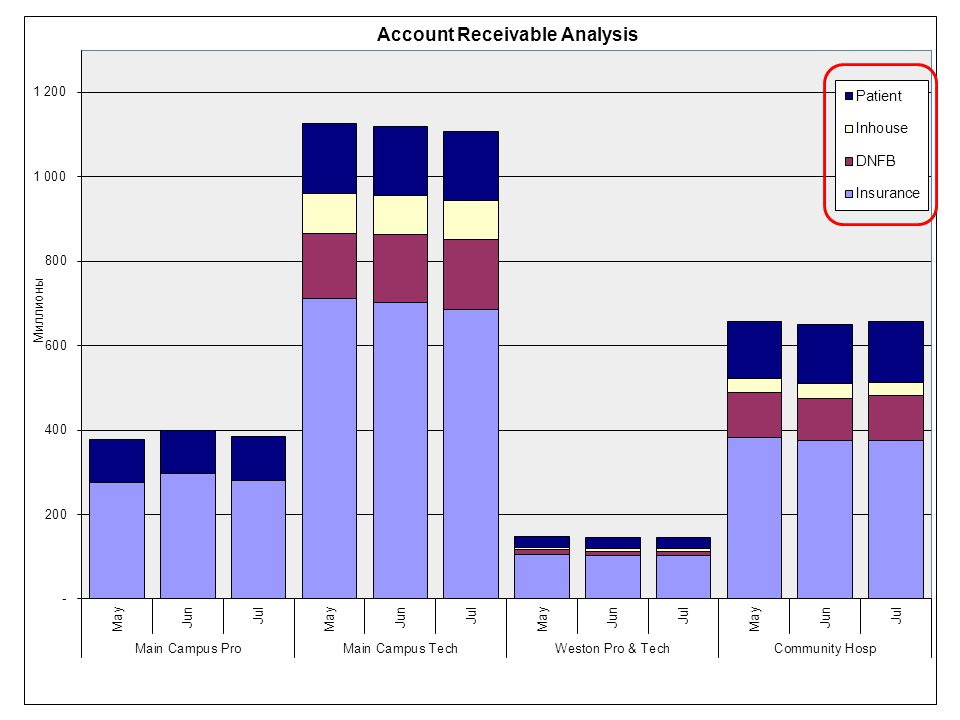
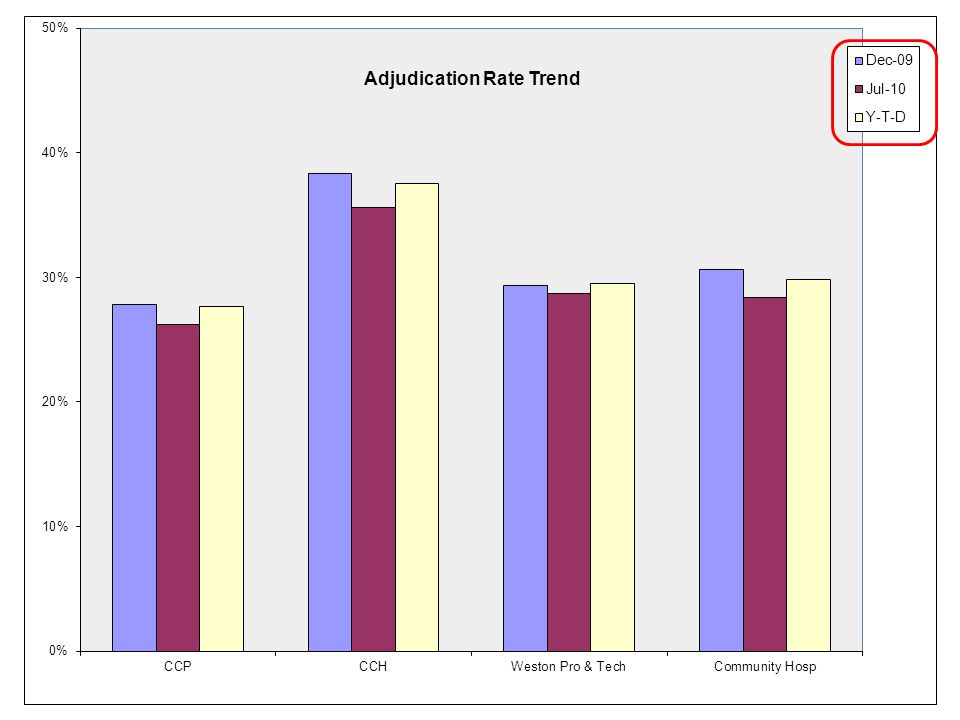
Global Metrics

8
ALL CLEVELAND CLINIC ENTITIES *Compass Based

9
ALL CLEVELAND CLINIC ENTITIES *G/L Based

15
Scheduling

17
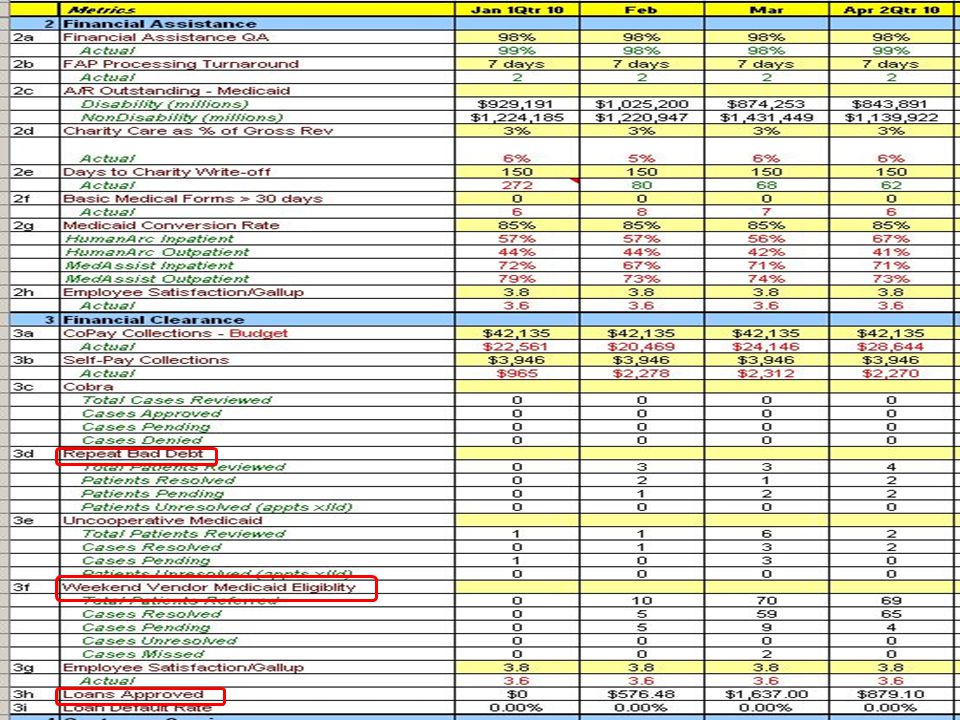
Financial Clearance

19
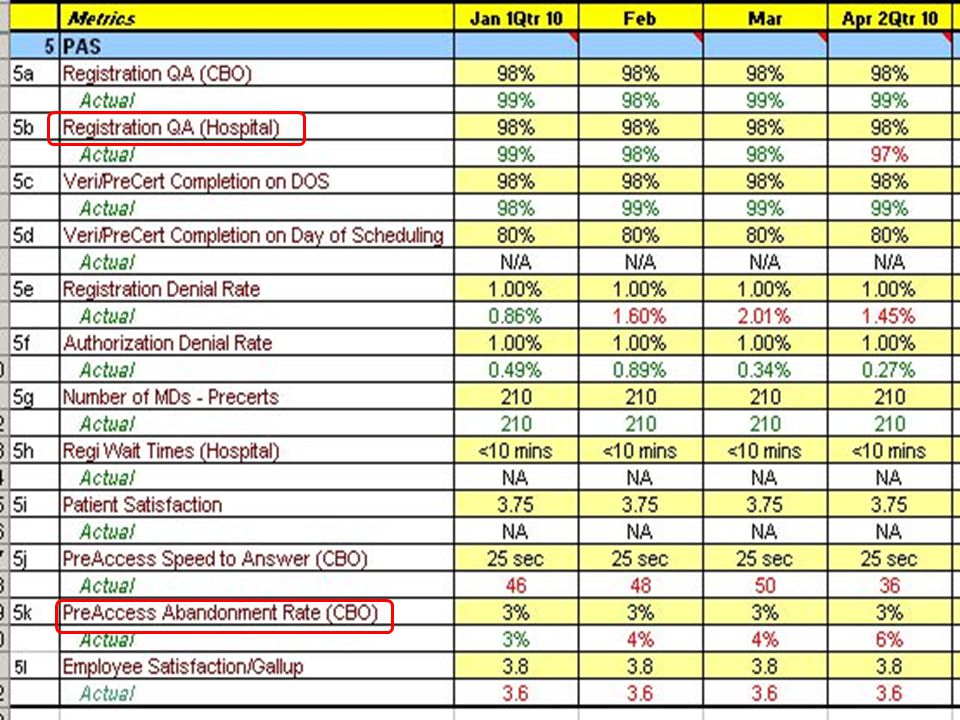
Registration

21
HIM Coding

23
Metric/MeasurementTarget Transcription Quality*98.0% Transcription Turnaround Time (%within 24 hours)98.0% Unbilled Chart Dollars at Month End Inpatient < $5M Unbilled Chart Dollars at Month End Outpatient Coding Timeliness: Discharge > Bill < 8 days94% Medical Record Completion Timeliness0>30 days Request of Information (ROI) Turnaround< 7 days DEPARTMENT OF FINANCE HEALTH DATA SERVICES Key Performance Indicators 2010
98.0% Unbilled Chart Dollars at Month End Inpatient < $5M Unbilled Chart Dollars at Month End Outpatient Coding Timeliness: Discharge > Bill < 8 days94% Medical Record Completion Timeliness0>30 days Request of Information (ROI) Turnaround< 7 days DEPARTMENT OF FINANCE HEALTH DATA SERVICES Key Performance Indicators 2010")
24
First Quarter, 2010 Facilities CDI Benchmarks CCF Main Total Medicare Cases Medical CMI Surgical CMI Overall CMI Program Performance YTD Financials Projected$ YTD Financials Achieved$ YTD Financials Achieved - RAC adjusted$ % Attainment BENCHMARK Case Coverage Rate85% Query Rate35% - 45% Physician Response Rate80% SOI Weight Change over baseline ROM compared to the state Medical Capture Rate BENCHMARK MJCC v. NMJCC32% MCC/CC v. NMCC/CC67% MCC+CC v. NCC79% MCC v. CC47% Surgical Capture Rate MJCC v. NMJCC21% MCC/CC v. NMCC/CC46% MCC+CC v. NCC74% MCC v. CC45% Color depictionExample only- Green meet or above, Red below target

25
Edits

27
Claims

30
Billing

31
Billing Operations Monthly Scorecard Monthly Performance Indicator2010 Goal JanuaryFebruary RAC Completion % by Hospital Euclid100% N/A Fairview100% N/A100% Hillcrest100% N/A Huron100% N/A100% Lakewood100% N/A Lutheran100% N/A100% Main100% N/A100% Marymount100% N/A Medina100% N/A100% Southpointe100% N/A Weston100% Appealed within 30 days of the demand letter Euclid100% N/A Fairview100% N/A Hillcrest100% N/A Huron100% N/A Lakewood100% N/A Lutheran100% N/A Main100% N/A Marymount100% N/A Medina100% N/A Southpointe100% N/A Weston100% N/A Level 1 - Learner Feedback on New Hire Training Programs PAS West>90% 96% 100% PAS East>90% 0% PAS Central>90% 100% PFS West>90% 0% 97% PFS East>90% 85% 84% PFS Central>90% 98% 95% Level 2 - New Hire Training Final Assessment Scores PAS West>89% 97% 92% PAS East>89% 89% 87% PAS Central>79% 96% 94% PFS West>84% 0% 96% PFS East>84% 93% PFS Central Signature>84% 93% 88% PFS Central HBO>84% 96% PFS Florida Signature>84% 95% 89% Cash Reconciliation % of Batches With Errors<2% 2.5%1.8% Average days for batch distribution to vendors2 Days 1.63 Days1.78 Days Average days to receive verification of posting and amount posted from billing vendors4 Days 3.49 Days3.21 Days Document Processing Correspondence inventory (average days outstanding)Future Updates Future Payer Denial Management Denial Inventory (average days outstanding)21 days To Be Updated11.6
Future Updates Future Payer Denial Management Denial Inventory (average days outstanding)21 days To Be Updated11.6")
33
Collections

35
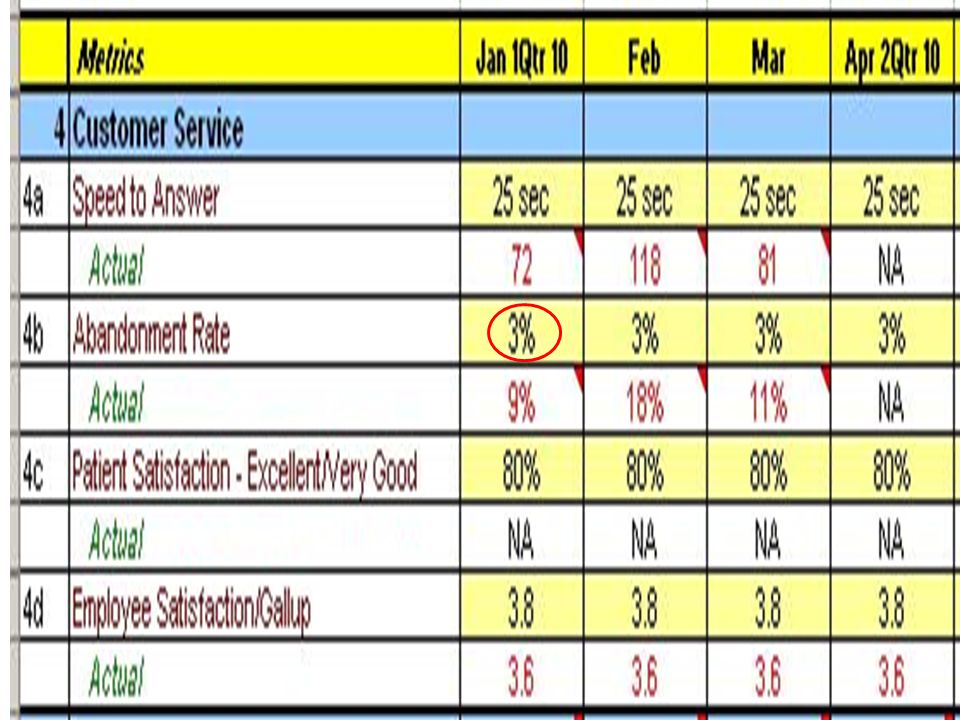
Customer Service

37
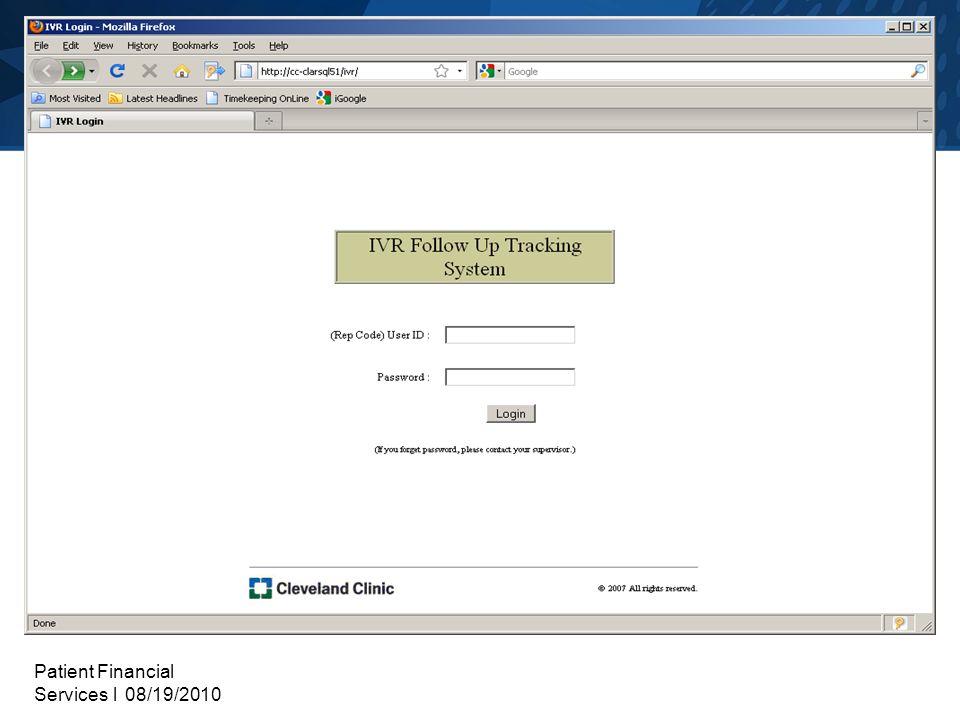
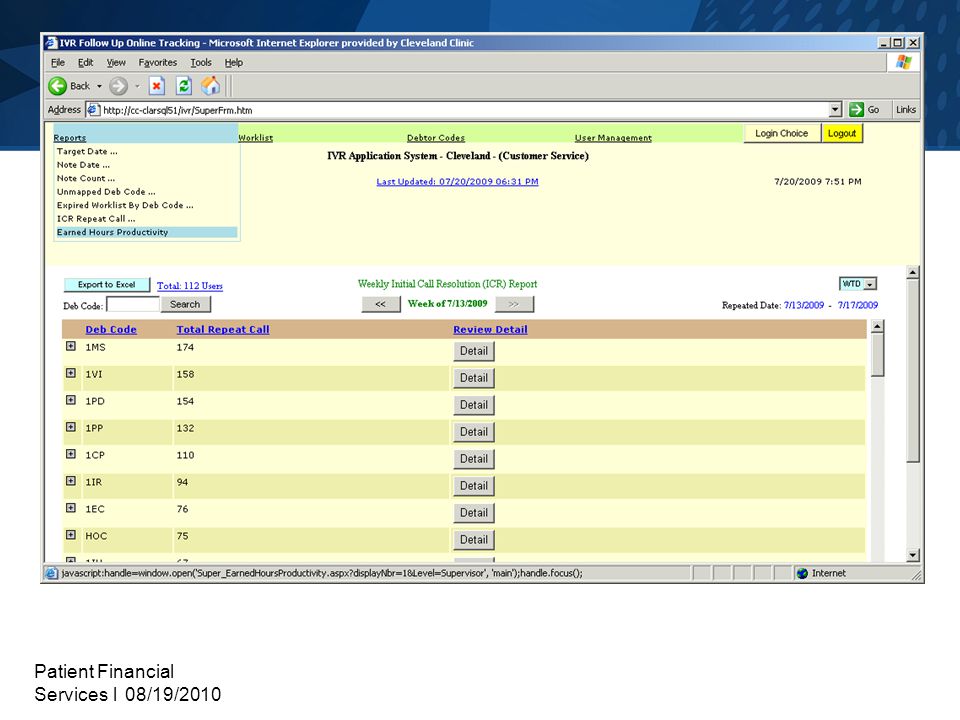
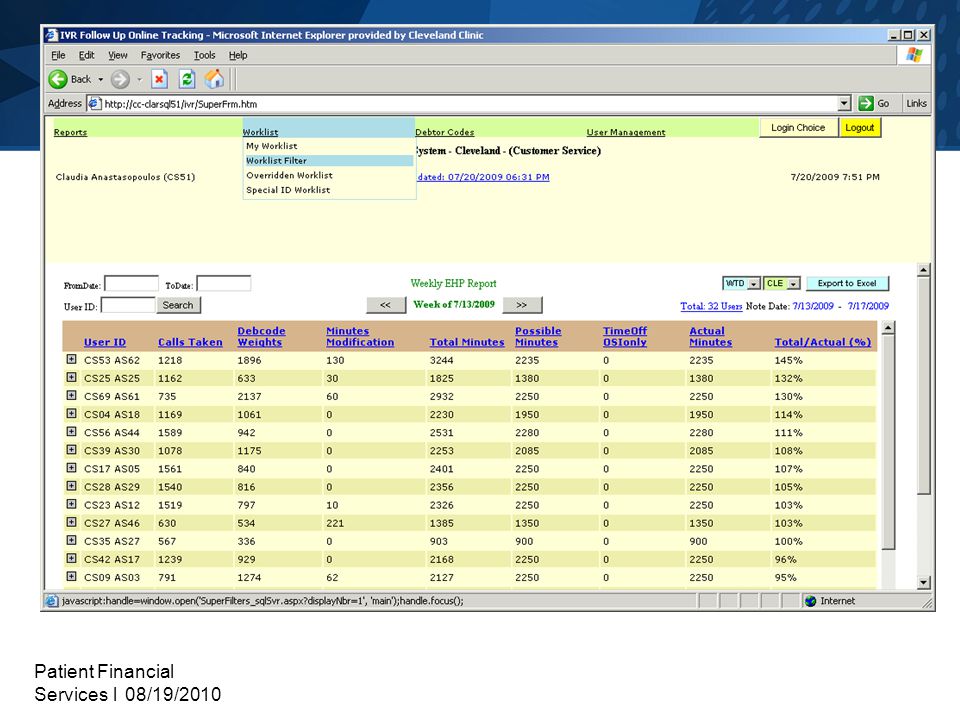
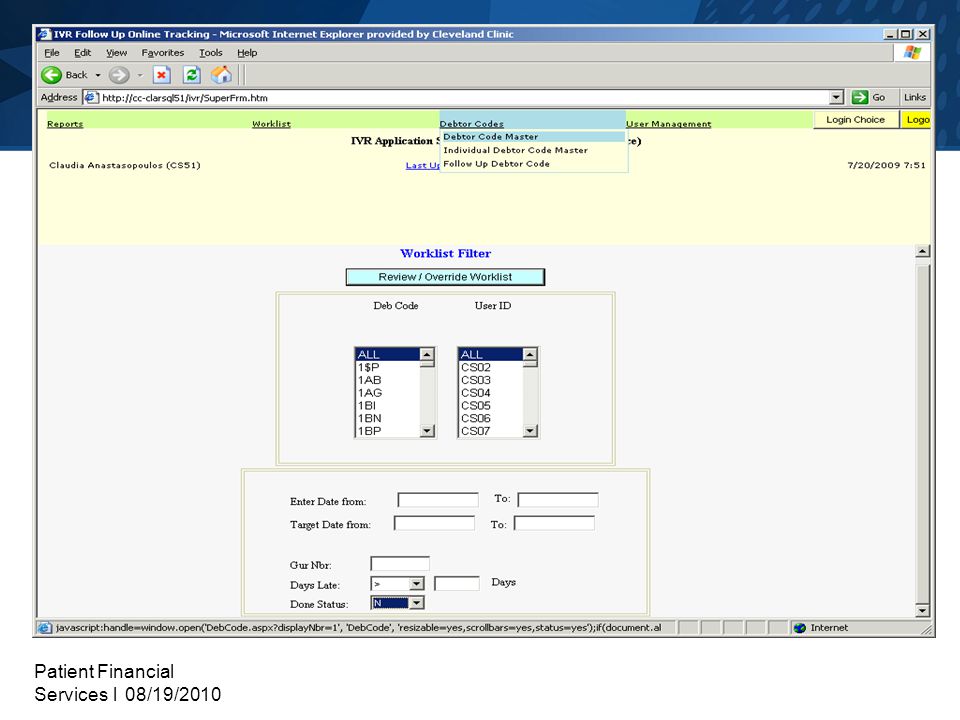
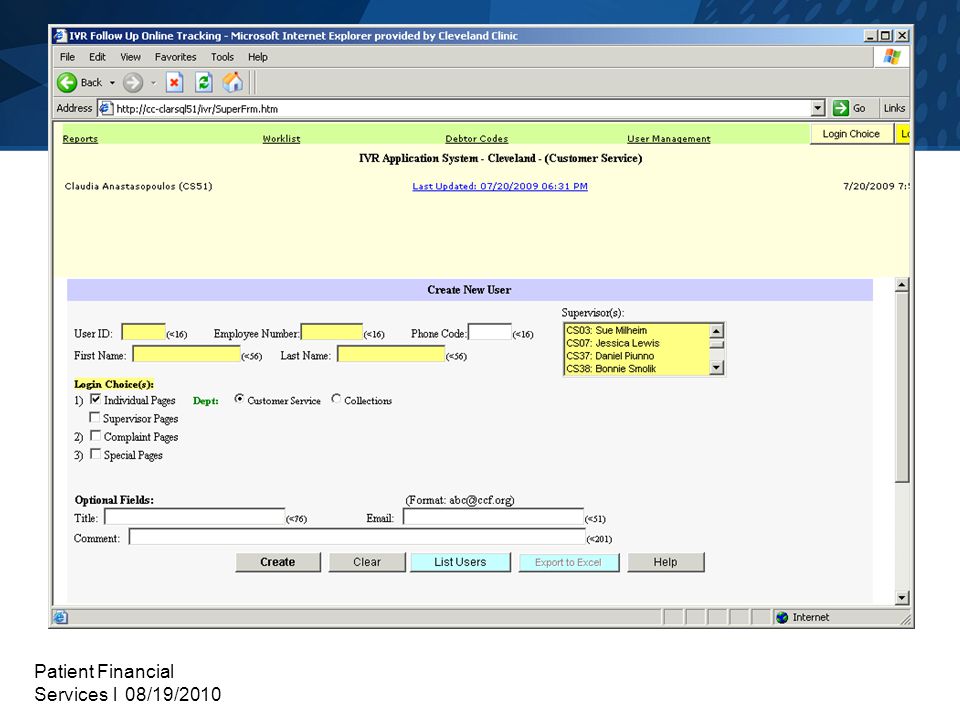
Innovations: Follow-Up Tracking and Productivity System

38
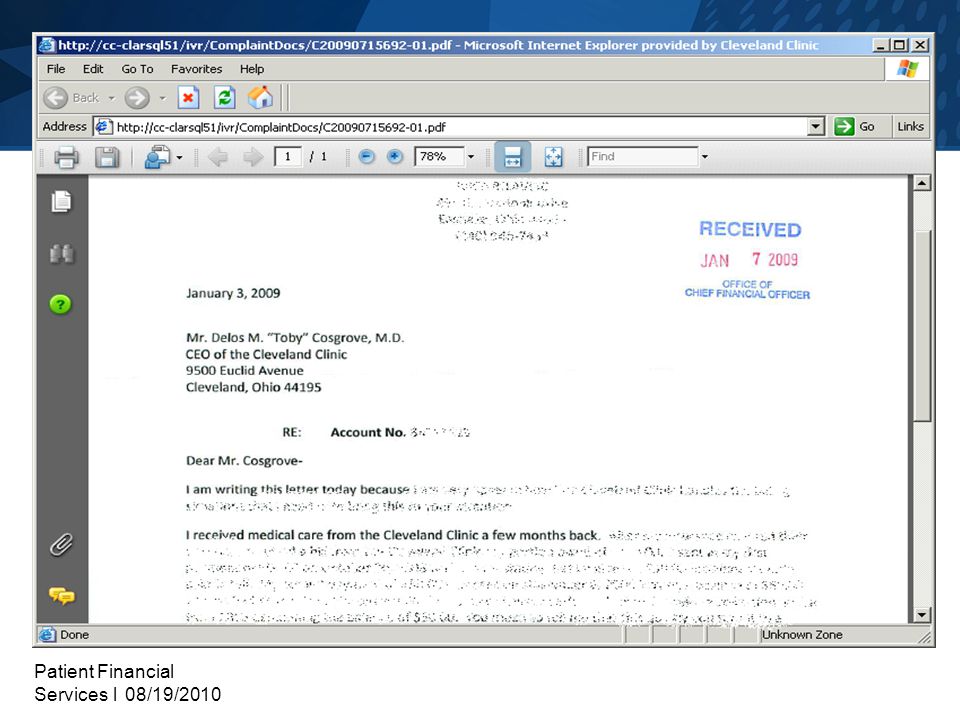
Patient Financial Services l 08/19/2010 Agenda Customer Service Follow Up and Productivity System Patient Complaint Tracking System Hospital Billing Productivity and Financial Results System

39
Patient Financial Services l 08/19/2010 Follow-Up and Productivity Tracking Old Way of Thinking: –Productivity = “Take as many calls as you can” or “Touch as many accounts as you can” –21 CEO level complaints per month –Handwritten Paper Tracking Lists New Way of Thinking: –Quality. Are we delivering what we promise to the patient? –10 CEO level complaints per month –Customer Surveys Productivity –Motivating Results Reporting –Automated Work Item Measurement

40
Patient Financial Services l 08/19/2010 9

41
8

66
External Controls

68
Managed Care - Market and Network Services Hospital (Technical) Enterprise Payer Scorecard: Sample Payers (Data is not Valid) Year-End: December 31, 2008 MetricPrimary Payer YTD: Payer APayer BPayer CPayer DPayer EPayer FPayer GPayer H IP Cases # 6,032 198 829 7,902 1,677 2,418 250 2,101 OP Cases # 106,114 3,909 15,345 171,224 6,873 50,756 5,409 44,155 IP Charges $ $ 217,079,299 $ 4,767,740 $ 22,269,816 $ 216,374,795 $ 43,239,130 $ 69,123,930 $ 8,100,557 $ 62,581,265 OP Charges $ $ 197,914,595 $ 6,397,231 $ 26,329,210 $ 281,815,261 $ 20,978,136 $ 79,324,793 $ 10,586,761 $ 70,885,926 Avg IP Charges $ $ 15,470 $ 10,365 $ 11,545 $ 11,772 $ 11,087 $ 12,289 $ 13,942 $ 12,806 Avg OP Charges $ $ 802 $ 703 $ 738 $ 708 $ 1,312 $ 672 $ 841 $ 690 Average Length of Stay Days - IP 2.1 1.8 1.9 1.8 1.9 As of Month-End (all DOS): Gross DRO-AR Days 20.8 29.4 27.3 22.3 22.0 20.6 26.1 20.4 Gross Active AR $ $ 55,127,403 $ 1,745,910 $ 8,402,280 $ 69,686,881 $ 9,066,706 $ 18,804,488 $ 2,891,421 $ 16,714,675 Gross Active AR Over 90 Days $ $ 10,294,256 $ 329,910 $ 1,156,076 $ 7,099,343 $ 948,121 $ 2,067,185 $ 775,445 $ 1,973,323 Gross Active AR Over 90 Days %8.0%8.1%5.9%4.4%4.5%4.7%11.5%5.1% Gross Active AR Over 90 Days Cases # 1,858 129 381 1,555 145 541 92 651 Gross Active AR with Denial %11.3%6.6%6.8%5.6%6.0%5.6%8.2%6.1% YTD for 2009 Dates of Service: Total Payment $ (Primary/Secondary/Patient) $ 201,245,430 $ 6,321,437 $ 24,751,778 $ 217,201,390 $ 25,637,536 $ 77,785,320 $ 11,523,155 $ 65,673,654 Average IP Payments $ $ 7,492 $ 6,363 $ 5,833 $ 5,551 $ 4,267 $ 6,247 $ 9,111 $ 7,021 Average OP Payments $ $ 423 $ 425 $ 406 $ 311 $ 610 $ 379 $ 547 $ 325 Total Payment as % of Pd Chgs21.6%25.9%23.0%19.2%17.6%23.0%27.7%21.8% Average Days to Bill 7.8 7.9 8.0 7.8 8.1 7.8 Average Days to Payment 10.1 12.4 10.9 10.4 13.2 9.3 7.8 8.6 Late Payments as a % of Paid Cases0.1%3.8%0.8%0.1%2.0%0.4%0.7%0.2% Secondary/Self Pay Residual % Expected Revenue3.1%4.7%3.0%3.6%1.9%3.6%2.3%3.2% Bad Debt/Charity $ 5,838,002 $ 362,866 $ 668,482 $ 6,518,977 $ 424,606 $ 2,015,108 $ 212,077 $ 1,837,544 Bad Debt/Charity % of Expected Revenue1.2%2.3%1.1%1.3%0.7%1.1%0.8%1.2%
 Enterprise Payer Scorecard: Sample Payers (Data is not Valid) Year-End: December 31, 2008 MetricPrimary Payer YTD: Payer APayer BPayer CPayer DPayer EPayer FPayer GPayer H IP Cases # 6, ,902 1,677 2, ,101 OP Cases # 106,114 3,909 15, ,224 6,873 50,756 5,409 44,155 IP Charges $ $ 217,079,299 $ 4,767,740 $ 22,269,816 $ 216,374,795 $ 43,239,130 $ 69,123,930 $ 8,100,557 $ 62,581,265 OP Charges $ $ 197,914,595 $ 6,397,231 $ 26,329,210 $ 281,815,261 $ 20,978,136 $ 79,324,793 $ 10,586,761 $ 70,885,926 Avg IP Charges $ $ 15,470 $ 10,365 $ 11,545 $ 11,772 $ 11,087 $ 12,289 $ 13,942 $ 12,806 Avg OP Charges $ $ 802 $ 703 $ 738 $ 708 $ 1,312 $ 672 $ 841 $ 690 Average Length of Stay Days - IP As of Month-End (all DOS): Gross DRO-AR Days Gross Active AR $ $ 55,127,403 $ 1,745,910 $ 8,402,280 $ 69,686,881 $ 9,066,706 $ 18,804,488 $ 2,891,421 $ 16,714,675 Gross Active AR Over 90 Days $ $ 10,294,256 $ 329,910 $ 1,156,076 $ 7,099,343 $ 948,121 $ 2,067,185 $ 775,445 $ 1,973,323 Gross Active AR Over 90 Days %8.0%8.1%5.9%4.4%4.5%4.7%11.5%5.1% Gross Active AR Over 90 Days Cases # 1, , Gross Active AR with Denial %11.3%6.6%6.8%5.6%6.0%5.6%8.2%6.1% YTD for 2009 Dates of Service: Total Payment $ (Primary/Secondary/Patient) $ 201,245,430 $ 6,321,437 $ 24,751,778 $ 217,201,390 $ 25,637,536 $ 77,785,320 $ 11,523,155 $ 65,673,654 Average IP Payments $ $ 7,492 $ 6,363 $ 5,833 $ 5,551 $ 4,267 $ 6,247 $ 9,111 $ 7,021 Average OP Payments $ $ 423 $ 425 $ 406 $ 311 $ 610 $ 379 $ 547 $ 325 Total Payment as % of Pd Chgs21.6%25.9%23.0%19.2%17.6%23.0%27.7%21.8% Average Days to Bill Average Days to Payment Late Payments as a % of Paid Cases0.1%3.8%0.8%0.1%2.0%0.4%0.7%0.2% Secondary/Self Pay Residual % Expected Revenue3.1%4.7%3.0%3.6%1.9%3.6%2.3%3.2% Bad Debt/Charity $ 5,838,002 $ 362,866 $ 668,482 $ 6,518,977 $ 424,606 $ 2,015,108 $ 212,077 $ 1,837,544 Bad Debt/Charity % of Expected Revenue1.2%2.3%1.1%1.3%0.7%1.1%0.8%1.2%")
69
Patient Education

70
Patient Feedback Forums Identified Topics Launched Educational Programs Basics of Insurance and Billing Preparing for Your Surgery: From a Financial Perspective About to Retire: Preparing for Medicare

71
Patient Education Additional Programs Lost Your Health Insurance Reading Your Cleveland Clinic Statement Using Cleveland Clinic Website Tools What Healthcare Reform Means to You ( 11/2010 )
")
72
Patient Education Enabling Greater Participation Online Videos Community Partnerships

73
Questions???

Similar presentations